ЕКСПЛУАТАЦІЯТАРЕМОНТЗАСОБІВТРАНСПОРТУ
doi 10.15802/stp2017/99952 © D. M. Kozachenko, R. V. Vernigora, R. S. Rustamov, 2017
UDC 656.225
D. M. KOZACHENKO
1*, R. V. VERNIGORA
2*, R. S. RUSTAMOV
3*1*Research Department, Dnipropetrovsk National University of Railway Transport named after Academician V. Lazaryan, Lazaryan St., 2, Dnipro, Ukraine, 49010, tel. +38 (056) 373 51 09, e-mail [email protected],
ORCID 0000-0003-2611-1350
2*Dep. «Stations and Nodes», Dnipropetrovsk National University of Railway Transport named after Academician V. Lazaryan, Lazaryan St., 2, Dnipro, Ukraine, 49010, tel. +38 (056) 373 15 12, e-mail [email protected],
ORCID 0000-0001-7618-4617
3*The Regional Branch of the «Odesa Railroad» PJSC «Ukrzaliznytsia», Panteleymonivska St., 19, Odesa, Ukraine, tel. +38 (048) 727 30 96, e-mail [email protected], ORCID 0000-0002-5860-1840
CREATION OF EXPORT-ORIENTED NETWORK OF GRAIN
ELEVATORS IN UKRAINE
Purpose. The scientific paper highlights improving the efficiency of export rail transportation of grain cargoes in Ukraine by introducing shipper routing and concentration of loading at the terminal grain elevators.
Methodology. According to the experience of the USA and Canada, one of the most effective ways to reduce costs in the grain to-port supply chain is a shipper routing of the rail traffic. Shipper routing for transportation of grain cargoes involves the concentration of their loading on the multiple junctions. The junctions are proposed to be selected with the use of cluster analysis methods. For the formation of the grain loading concentration areas the authors used methods of set theory and multi-criteria optimization. Findings. Based on agglomerative cluster analy-sis algorithm, the junctions on a network of Ukrainian railways are selected and the areas of possible concentration of grain loading are formed. DSU-algorithm allowed distinguishing the overlapping and non-overlapping areas of concentration. The problem of selecting non-overlapping areas of the grain loading concentration is formalized as the problem of multiobjective integer programming with boolean variables. The solution of this problem by a modi-fied simplex algorithm allows selecting on the railway network of Ukraine 24 districts of possible grain loading concentration, which cover 70 stations and at minimal additional cost provide routing of about 7.5 million tons of grain per year. Originality. The originality of the work lies in the fact that the authors developed the mathematical procedure for selection of junctions and concentration areas of grain loading at the Ukrainian railway network, tak-ing into account the economic efficiency of the process. Practical value. Application of the developed method of grain loading concentration for the formation of unit trains will significantly reduce the logistics costs in the supply chain of grain to Ukrainian ports for export and, consequently, increase its competitiveness in foreign markets.
Keywords: grain export; elevators; rail transportation; shipper routing; loading concentration
Introduction
Grain is one of the main export goods of Ukraine. Over the period from 2006 to 2016, the share of its value in the total value of goods ex-ported from Ukraine increased from 3.5 to 16.5%. In 2015/2016 marketing year among grain exporters, Ukraine, with an indicator of 38.7 mil-lion tons, took the third place, behind the United States (78.5 million tons) and the European Union (52.2 million tons). Significant volumes of grain were exported by Argentina (36.2 million tons), the Russian Federation (34.6 million tons), Canada (27.7 million tons) and other countries [14]. One of the ways to increase the competitiveness of domes-tic grain in the world market is to build an effective logistics system. For Ukraine, this task is
espe-cially important, as the share of logistics costs in the cost of domestic grain is about 35%; for com-parison, the share of logistics costs in the grain cost in the European Union is 12 – 16%, the United States – 9 % [10].
ЕКСПЛУАТАЦІЯТАРЕМОНТЗАСОБІВТРАНСПОРТУ
doi 10.15802/stp2017/99952 © D. M. Kozachenko, R. V. Vernigora, R. S. Rustamov, 2017 transport of Ukraine performs about 90% of the
turnover of electric power with the use of domestic energy carriers. On the contrary, 72% of oil products consumed in Ukraine are used for the needs of motor transport; while 80% of oil prod-ucts are imported by Ukraine [4].
Significant progress in reducing the cost of grain transportation was achieved in the US and Canada in the late 20th, early 21st century.
Changes in grain logistics in the United States began in 1972–1973 in response to a sharp increase in demand for grain in the world market [25]. These changes led to a change in the number, ca-pacity and location of elevators throughout the country, improvement of the technology of grain transportation by railways and their tariff systems. Similar changes have occurred since the 1980s in Canada.
Prior to the reform process, the logistics system for grain delivery by the North American railways was similar to that operating on the Ukrainian railways. Empty carriages for the transportation of grain were sent to technical stations, where from the groups of 1 to 25 wagons were approached to the loading stations. After loading, the wagons were sent to technical stations for making up of trains according to the composition plan. In 1965, the USA began to use technology to transport grain for export to seaports by route shipments [23]. The efficiency of grain transportation by routes is con-nected with a reduction of station costs, the more rational use of the capacity of wagons and the throughput and carrying capacity of railways. At the same time, this technology requires the devel-opment of access roads and loading capacity of elevators [20].
Further technical and technological innova-tions, state policy aimed at market development led to a change in the volume, quality and cost of rail-road services associated with the transportation of grain. The end of the 1970s – the beginning of the 1980s was the period of economic deregulation of the railway transport. The US Congress adopted a number of documents, the most important of which were: “Railroad Revitalization and Regulatory Re-form Act” of 1976 [24] and “Staggers Rail Act” of 1980 [28]. These laws significantly simplified for the railways the procedure for closing inactive ar-eas and also gave considerable freedom in the
for-mation of tariff policy. As a result, inactive areas, which constituted about 20% of the network, were closed, in addition a significant number of low-activity sections were converted into railways, in-dependent of the 1st class railways [29]. Tariff pol-icy of railways has also undergone significant changes. The railways switched from tariffing of freight in proportion to the ton of cargo to single-car rate, multiple-single-car rates, unit train and multiple origin unit train rates, stimulating shippers, on the one hand, to the maximum loading of wagons, and, on the other hand, to the concentration of grain traffic. In the 1990s, the Burlington Northern rail-way (BNSF after 1996) introduced the technology of grain transportation by shuttle train [22]. This technology implies the use of a special tariff, which is lower than that for the transportation of grain by group shipments by 46–52%. At the same time, the shipper must be able to ensure loading of the train of 75–120 cars during the limited time (about 15 hours) [27]. Trains move between the points of loading and unloading according to a rigid schedule in accordance with the contract for 6–9 months, without remarshaling and uncoupling of train locomotives at the loading station [26]. In response to changes in grain transportation condi-tions in the United States, there were significant changes in grain production and storage systems. Between 1980 and 1998, the number of agricul-tural enterprises decreased by 15%, while their size increased by 11%. The total number of elevators decreased due to a significant reduction in the number of country elevators, while the number of terminal elevators increased, and the number of terminal elevators increased, ensuring the shipment of grain to the railway transport in lots sufficient for the formation of routes [21]. Technical specifica-tions for elevators that provide shipment of grain lots for the formation of routes are presented in [25]. The average distance of to-elevator grain delivery by farmers increased from 19 to 51.5 km [22].
In general, despite the fact that the cost of grain production in the USA, as a rule, is higher than in the main competing countries, the effective logis-tics system ensures its competitiveness in world markets.
ЕКСПЛУАТАЦІЯТАРЕМОНТЗАСОБІВТРАНСПОРТУ
doi 10.15802/stp2017/99952 © D. M. Kozachenko, R. V. Vernigora, R. S. Rustamov, 2017 the amount of shipment, there occurred a
consoli-dation of elevators. Between 1994 and 2003, the number of grain elevators decreased by 62%, while their total loading capacity decreased by only 8%.
The domestic logistics system for the export of grain cargo is characterized by the dispersion of the grain loading over a large number of railway stations. So, at present in Ukraine grain loading is carried out at 630 stations, however, as the analysis of statistical data showed, for about 420 stations (67%) the volumes of average daily grain loading do not exceed 1 wagon. In addition, the loading at some stations is extremely uneven: for example, only 24 stations (4%) conducted the grain loading on more than half of the days a year, while 50% of the stations spent no more than 34 days a year for grain loading [9, 15].
The negative result of this is a significant turn-over of wagons, which in 2016 was about 9.9 days [17], inefficient use of locomotive traction at the initial and final stages of transportation, significant operating costs associated with car servicing at stations. The existence of such a logistics system is possible because of the absence in Ukraine of dif-ferentiated tariff rates for wagon, group and route shipments, as well as the availability of stand-by grain hoppers in the 2000s. However, the combina-tion of such factors as sharp increase in grain pro-duction, critical wear of grain carriers and stiffer competition in the world grain markets make it necessary to improve the logistics infrastructure and technologies for grain transportation. In these conditions, the experience of the USA and Canada can be used in Ukraine, which consists in increas-ing the loadincreas-ing capacity of elevators, on the one hand, and using routes for the grain transportation with special tariffs, on the other hand.
Purpose of the study
The purpose of the study is to develop a methodology for the formation of a network of grain loading concentration areas to ensure the shipper routing of rail transportation of grain to the seaports of Ukraine for export.
Methodology
The choice of terminal elevators (junctions) and grain loading concentration areas is a very com-plex multivariate and multifactor optimization task.
At the same time, it is necessary to take into ac-count the existing infrastructure of the junctions and the possibilities for its development, the volumes of grain loading at the stations, the addi-tional costs associated with storing grain, unit train loading, delivering grain to junctions by road and the costs of transporting grain by rail to ports.
Formulation and formalization of the problem.
The task of determining the areas of possible grain loading concentration and the corresponding junc-tions, where the grain will be loaded in unit trains, can be formulated as follows.
There are a lot of S grain loading stations on the railway range S = {s1, s2, – si sz), where z –is the total number of grain loading stations. The dis-tances lij between each pair of stations si and sj (si,
sj S) can be represented by the distance matrix L
[16]:
12 1 1
2
21 2
1 2
1 2
0 ... ... ... 0... ...
... ... ... ... ... ... ... ...
... ... 0
j z
j z
ij
i i iz
z z zj
l l l l
l l
L
l
l l l
l l l
Each element of the set S (station) is characterized by a number of parameters and can be represented by the structure:
, , , , ,Т,K ,
is I N c q p (1)
where I –station identifier (ECP code) [16]; N – station name [16]; c – station class; q –average an-nual volume of grain loading, wag.; p –capacity of the elevator facility for one-time storage of grain, ths. tons; T – vector characterizing the distance from the station to the main seaports; K – vector characterizing the volume of additional capital in-vestments for the development of the station infra-structure when loading grain unit trains.
Each element of the vector T is the number of the tariff zone corresponding to the distance from the given station si (si S ) to one of the seaports where grain is transshipped for export [7]:
1 2
Ti t t, ,....tn
ЕКСПЛУАТАЦІЯТАРЕМОНТЗАСОБІВТРАНСПОРТУ
doi 10.15802/stp2017/99952 © D. M. Kozachenko, R. V. Vernigora, R. S. Rustamov, 2017 that are required for the development of the station
(elevator and railway) infrastructure with the weekly loading of 1, 2 and 3 unit trains, respec-tively:
1 2 3
Ki k k k, , .
Average annual volumes of grain loading qi for each station are determined on the basis of statisti-cal processing of the data obtained from UFACS-UZ-E (Unified Freight Automated Control System of UZ). Data on the class of each station and the capacity of its elevator facility can be obtained from TIS of the stations using AWS TIS.
On the basis of the indicated initial data it is necessary:
– from the set S to select a subset S* (S* S) of the junctions su* (su*S*, u=1, 2, …, m), where grain loading of unit trains will be carried out;
– for each junction su* (type U) to determine the loading concentration area Ru (u=1, 2,…,m), i.e. a set of stations sv S (type V), from which the de-livery of grain by road to the junction su* will be organized:
*
1 2
, , , , ,..., ,..., ,
u r r v f v
R I Q s s s s s s S,
where Ir – identifier of the concentration area;
Qr – total annual grain loading at all stations of the area, wag.
When forming loading concentration areas, it is necessary to observe the following conditions:
– the distance from U-station su* of the area Ru to any V-station of the area sv (sv Ru) must not exceed the maximum specified value lmax (when
solving this task it is assumed that lmax=30 km):
*
max
( )( )( ),
1,2,..., ,v u u u 1,2,...,u uv
s R s R l l
v f u m
– the total annual volume of the grain shipped at the concentration area stations Ru must be not less than the minimum specified value Qmin (when
solving this task, it is assumed that Qmin=3000
wag/ year, which ensures the shipment of at least 1 unit train with grain per week):
min
(R Qu)( r Q ),u1,2,...,m (2)
And, finally, the solution of the task of select-ing junctions and areas of grain loadselect-ing
concentra-tion should ensure minimum total costs associated with the routing of grain transportation for export to ports. In aggregate, these costs can be repre-sented as
road utr
1 1 1
inf
1 1
min
m m m
st
u u u
u u u
m m
cl
u u
u u
Е Е Е
Е Е
(3)where road
u
Е – additional costs for transportation of grain to the junction of the area Ru by road, mln. UAH; st
u
Е – additional costs for grain storage at the junction of the area Ru for making up a unit train, mln. UAH; utr
u
Е – costs for transportation of grain to ports by unit trains from a junction of the area Ru, mln. UAH; cl
u
Е – costs for carload trans-portation of grain to ports from the stations of the area Ru, mln. UAH; inf
u
Е – additional reduced costs associated with the development of elevator and rail infrastructure of the junction of the area Ru, mln. UAH.
The article describes the developed methodol-ogy for solving this problem, which is based on the methods of cluster analysis, set theory and multi-criteria optimization.
Findings
Determination of junctions for loading of unit trains based on the cluster analysis. The solution of this problem involves the separation of the ini-tial set of grain loading stations S into two subsets – S*, which includes junctions of possible loading
concentration (U-stations), and S, which includes stations where the loading of grain routes is im-practical. Considering the significant number of grain loading stations (more than 600), cluster analysis methods can be used effectively to obtain these subsets [6, 13].
ЕКСПЛУАТАЦІЯТАРЕМОНТЗАСОБІВТРАНСПОРТУ
doi 10.15802/stp2017/99952 © D. M. Kozachenko, R. V. Vernigora, R. S. Rustamov, 2017 cluster are “similar” in a certain sense to each
other, and objects from different clusters are “not similar”.
To select the set of junctions S*, an agglomerate
algorithm of direct classification was used [6]. In agglomeration algorithms, unlike divisive algo-rithms, each classifiable object in the beginning is a separate cluster. At each step of the algorithm, the two closest clusters are combined. This hap-pens until the number of clusters reaches the cer-tain, in most cases, the predetermined value (in our case, two clusters). It is advisable to use divisive algorithms when the initial population must be di-vided into a sufficiently large number of clusters (more than 10) [13], which does not correspond to the conditions of the problem of grain loading sta-tion classificasta-tion.
An important factor in the effectiveness of clus-ter analysis is the choice of parameclus-ters by which the classification of objects (in this case, railway stations) is performed. As noted in [6], with the increase in the number of indicators used to clas-sify objects, its quality is reduced. In this connec-tion, from the set of parameters characterizing the freight station (2), based on the methods of disper-sion analysis and Sheffe multiple comparisons [1], and taking into account the expert estimates, the following informative parameters were singled out: station class – c, annual volume of grain loading – q, available capacity of elevator infrastructure – p, additional costs for the development of elevator and railway infrastructure to ensure the loading of grain unit trains – k1, k2, k3. It should be noted that
obtaining of specific values of the vector k1, k2, k3
in monetary terms for each station is a very labori-ous task. In this connection, the authors used pa-rameterized dimensionless values k1, k2, k3 in the
range [0; 1]; while kj=0 means that additional funds are not required for the station infrastructure development to form j of grain unit trains per week, and kj=1 –formation of j of grain unit trains per week at a given station is impractical due to the need for significant investments in infrastructure, in the rest of the cases – 0 < kj<1. The specific values of the parameters k1, k2, k3 for each station
are determined expertly on the basis of the analysis of its infrastructure.
Since the information parameters of the stations selected for classification are measured in different
units and have different ranges of values, we car-ried out their standardization. For this purpose, the effectiveness of several methods for standardizing data considered in [3, 13, 19] was researched. Herewith, the “reference” classification was per-formed expertly, during which a set of 35 grain loading stations were divided into two clusters: U -stations and V-stations. The effectiveness of each of the standardization methods was evaluated ac-cording to two criteria: probability of erroneous classification – Per (as compared to a “reference”)
and value of the total intragroup dispersion – Dgr.
The studies performed on a computer with the help of the “Statistica” package showed that the best results (Per= 4–7 %) were obtained with the
stan-dardization of data by maximum and by range, the worst results were obtained with standardization by dispersion.
During classification, an important role is also played by the choice of the distance between the individual objects. The distance between the two objects a and b is the value of the distance dab, which is the greater, the less similar are the objects
a and b. When choosing the method of classifica-tion to obtain the training sample, we compared 6 distances in order to determine the most suitable for the solution of the problem posed [6, 13, 19]: the Euclidean distance, the Manhattan distance, the Brey-Curtis distance, the Chebyshev distance, the Canberra distance, the power distance.
To select the most effective distance with the help of the “Statistica” package, their comparative analysis was performed while classifying the “ref-erence” set of stations. The effectiveness of each distance was also assessed by the indicators Per and Dgr. The study of the distance effectiveness showed
that the best quality of the classification of grain loading stations was obtained using the “Canberra” distance (Per=3–5 %). The worst results were
ob-tained using the Chebyshev distance (Per=30–
35%).
ЕКСПЛУАТАЦІЯТАРЕМОНТЗАСОБІВТРАНСПОРТУ
doi 10.15802/stp2017/99952 © D. M. Kozachenko, R. V. Vernigora, R. S. Rustamov, 2017 [3, 6, 19]: “nearest neighbor”, “furthest neighbor”,
“group mean”, “centroid”, “quadratic”, “flexible”, Ward's method. The comparative analysis of the application of these methods for the classification of the “reference” set of grain loading stations, per-formed with the help of the “Statistica” package, showed that the closest results to the “reference” classification were obtained using the “flexible” unification method and Ward's method (Per = 5–
7%). The worst results were obtained using the methods of “nearest” and “furthest” neighbor (Per = 25–35%).
Thus, using the agglomeration cluster analysis method based on the “flexible” unification method and the “Canberra” distance between objects, the initial set of grain loading stations S was divided into two subsets – S*, which includes the junctions
of possible loading concentration (U- Station) – 43 stations in total, and S, which includes the sta-tions where the loading of grain unit trains is not relevant – 587 stations in total.
Determination of areas of possible grain
load-ing concentration. Based on the found subset of junction stations S* the areas of possible grain
loading concentration Ru (5) are formed, according to the territorial proximity of V-stations to the junc-tion U-station (6). For each junction station su* at the first step of the formation procedure of the cor-responding area Ru (5): Qr=qu, f = 0, (QrRu, fRu,
qusu*). Next, the i-th row of the distance matrix L (1) corresponding to the station su* is analyzed and those stations sjS (j=1, 2,–z), for which the condi-tion lij lmax (6) is true, are included in the set Ru. At the same time for the area Ru the following pa-rameters are recalculated:
, 1, ( ).
r r j j j
Q Q q f f q s
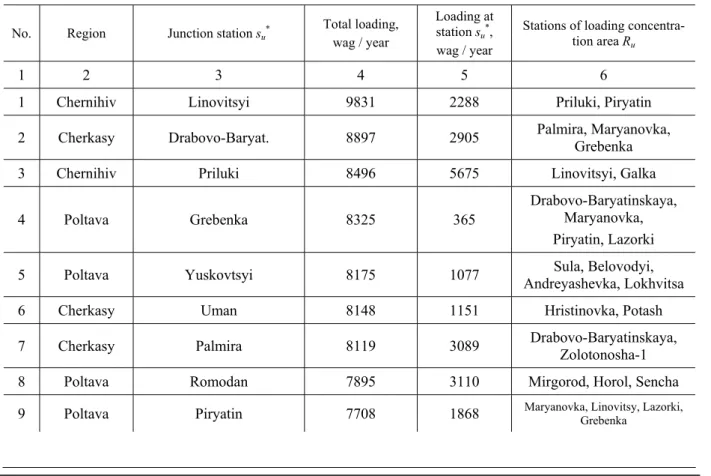
With the help of this procedure, the set R = {R1, R2,…, Ru,…, Rm} was formed, which includes 43 areas (m=43) of the possible grain loading concen-tration (Table 1).
Table 1
Areas of possible grain loading concentration
No. Region Junction station su* Total loading, wag / year
Loading at station su*,
wag / year
Stations of loading concentra-tion area Ru
1 2 3 4 5 6
1 Chernihiv Linovitsyi 9831 2288 Priluki, Piryatin
2 Cherkasy Drabovo-Baryat. 8897 2905 Palmira, Maryanovka, Grebenka
3 Chernihiv Priluki 8496 5675 Linovitsyi, Galka
4 Poltava Grebenka 8325 365
Drabovo-Baryatinskaya, Maryanovka, Piryatin, Lazorki
5 Poltava Yuskovtsyi 8175 1077 Andreyashevka, Lokhvitsa Sula, Belovodyi,
6 Cherkasy Uman 8148 1151 Hristinovka, Potash
7 Cherkasy Palmira 8119 3089 Drabovo-Baryatinskaya, Zolotonosha-1
8 Poltava Romodan 7895 3110 Mirgorod, Horol, Sencha
ЕКСПЛУАТАЦІЯТАРЕМОНТЗАСОБІВТРАНСПОРТУ
doi 10.15802/stp2017/99952 © D. M. Kozachenko, R. V. Vernigora, R. S. Rustamov, 2017
Continuation of table 1
10 Cherkasy Maryanovka 7676 2538 Drabovo-Baryatinskaya, Piryatin, Grebenka
11 Cherkasy Nosovka 7353 2426 Nezhin, Bobrovitsyi
12 Sumy Toropilovka 7121 5016 Sumy, Syrovatka, Basyi, Golovashevka
13 Sumy Sumy 7121 1047 Toropilovka, Syrovatka,
Basyi, Golovashevka
14 Sumy Syrovatka 7010 590 Basyi, Toropilovka, Sumy, Boromlya
15 Cherkasy Hristinovka 6876 5134 Uman, Monastyrishche
16 Poltava Mirgorod 6813 3273 Romodan, Gogolevo, Melashenkovo
17 Poltava Sula 6744 4417 Yuskovtsyi, AndreyashevkaLohvitsa, Sencha
18 Kirovohrad Aleksandriya 5875 732 Koristovka, Korolevka,
Pantaevka, Schastlivaya
19 Cherkasy Monastyrishche 5725 591 Hristinovka
20 Kirovohrad Korolevka 5632 708 Schastlivaya, Koristovka, Aleksandriya
21 Sumy Belovodyi 5495 1835 Romnyi, Yuskovtsyi, Andreyashevka
22 Cherkasy Zolotonosha 1 5214 2125 Zolotonosha 1, Palmira
23 Poltava Horol 4768 1108 Romodan, Veselyiy Podol, Petrovka
24 Sumy Romnyi 4418 2154 Belovodyi, Andreyashevka
25 Kirovohrad Novoukrainka 4221 1537 Pomoshnaya, Kapustino, Pletenyiy Tashlyik
26 Kiev Ustinovka 4106 866 Fastov-1, Belaya Tserkov
27 Poltava Seleshchina 4105 1683 Karlovka, Bozhkov
28 Poltava Karlovka 4020 2251 Seleschina, Lannaya
29 Kiev Yagotin 3911 3911 –
30 Cherkasy Gorodishche 3823 418 Korsun, Signaevka, Tsvetkovo
31 Kirovohrad Koristovka 3758 2075 Aleksandriya, Korolevka, Pantaevka
32 Vinnytsia Kryzhopol 3640 1197 Vapnyarka, Knyazhevo, Popelyuhi
ЕКСПЛУАТАЦІЯТАРЕМОНТЗАСОБІВТРАНСПОРТУ
doi 10.15802/stp2017/99952 © D. M. Kozachenko, R. V. Vernigora, R. S. Rustamov, 2017
End of the table 1
34 Kirovohrad Pomoshnaya 3498 1563 Novoukrainka, Lyudmilovka
35 Poltava Reshetilovka 3494 3064 Brateshki, Umantsevka Fedunka, Sagaydak,
36 Vinnytsia Vapnyarka 3423 1494 Knyazhevo, Kryizhopol
37 Vinnytsia Knyazhevo 3423 732 Vapnyarka, Kryizhopol
38 Khmelnitsky Kamenets-Podol. 3248 3248 –
39 Kharkiv Savintsy 3163 1955 Zakomelskaya, Balakleya
40 Kharkiv Zakomel'skaya 3149 824 Savintsyi, Izyum
41 Poltava Globino 3108 2237 Veselyiy Podol, Rublevka
42 Cherkasy Kamenka 2948 880 Im. Tarasa Shevchenko, Fundukleevka
43 Kirovohrad Kapitanovka 2833 350 Signaevka, Novomirgorod, Serdyukovka
In total m=43 areas included n=82 stations: 43 junction (U-stations) and 39 non-junction (V- sta-tions). The condition (6) is not fulfilled for the re-maining non-junction stations, i.e. they are located from the nearest junction station at a distance greater than lmax.
For each formed concentration area Ru (Ru R) the condition (7) is checked i.e. the sufficiency of the total annual volume of grain loading at the sta-tions of the area for sending of at least one grain unit train per week from the corresponding junc-tion stajunc-tion su*. If the condition (7) is not fulfilled, then this area is excluded from further calculations. As can be seen from Table 1, the total volumes of annual grain loading in concentration areas on the basis of Kamenka and Kapitanovka stations are less than Qmin=3000 wag/year; therefore, the areas R42 and R43 are excluded. Thus, in the list of m=41
area there are n=76 stations (41 junction U-station and 35 non-junction V-stations). It should also be noted that some areas include only junction sta-tions: R29 (Yagotin), R33 (Starobelsk) and R38
(Kamenets-Podolskiy), own grain loading at which exceeds Qmin.
Selection of effective areas of grain loading concentration. Analysis of Table 1 shows that the majority of the obtained sets Ru (u=1, 2,…, 41) are overlapping, i.e. one or several elements (stations) of one set (area) are simultaneously elements of
other sets (areas). For example, Lazorka non-junction station belongs to the areas R4 (Grebenka)
and R9 (Piryatin), while Linovitsyi junction, in
ad-dition to the R1 area, is also part of the areas R3
(Priluki) and R9 (Piryatin). At the same time, there
are several disjoint sets, the elements of which are part of only one set, for example, R11 (Nosovka), R29 (Yagotin).
Thus, in the resulting set R it is necessary to se-lect the subset R*, all of m* elements of which
(loading concentration areas Ru, u=1, 2,…, m*) are mutually disjoint sets. Herewith, the total volume of grain loading in the final subset R* must be the maximum, and the total amount of costs associated with the concentration of grain loading and the making up of grain unit trains must be minimal (3), i.e.:
* *
( ) max ( ) min
Q R E R
*
* ( ) 1
1
max
min m
r i i m
i i
Q
E
(4)The required subset R* R is the union of
dis-joint sets Ru* (u=1, 2,…, m*), for which the objec-tive function (4) reaches an extremum.
ЕКСПЛУАТАЦІЯТАРЕМОНТЗАСОБІВТРАНСПОРТУ
doi 10.15802/stp2017/99952 © D. M. Kozachenko, R. V. Vernigora, R. S. Rustamov, 2017 subsets Ru (u=1, 2,…, m) are distinguished in the
original set R (Table 1). For this purpose, one of the DSU (disjoint set union) algorithms can be used [2, 12]. The result of this algorithm is the ma-trix G = |guv| (u=1, 2,…, m; v=1, 2,…, m), where each row u and column v correspond to a certain set (concentration area) Ru and Rv, respectively (Table 1), and each element of the matrix guv is a list of stations si (si S), which are simultaneously included in the areas (sets) of Ru and Rv. In case if
guv= {}, the sets Ru and Rv are disjoint and are included in the resulting subset R* R. If g
uv {}, then the sets Ru and Rv are overlapping; herewith the following options are possible:
– common elements of the sets Ru and Rv are only junction U-stations (for example, areas of concentration R32 –Kryzhopol, R36 –Vapnyarka, R37
– Knyazhevo);
– common elements of the sets Ru and Rv are only non-junction V-stations (for example, An-dreashevka station for the areas R17 –Sula and R24 –
Romnyi);
– common elements of the sets Ru and Rv are both junction and non-junction stations (for exam-ple, the areas R12 –Toropilovka and R24 – Sumy).
It is necessary to redistribute common elements for all pairs of overlapping sets Ru and on their ba-sis to form such sets *
u
R , that the objective function (4) reaches an extremum. The above problem (4) can be solved by methods of the optimal set parti-tioning theory [8]; however, these methods are ra-ther laborious and require a considerable amount of computation. The specificity of this problem allows us to obtain a solution by more simple methods.
We transform the matrix G into the matrix
X=|xut| (u=1, 2,…, m; t=1, 2,…, n), in which each row u corresponds to a certain set (area) Ru (Table 1), and each column t – to a definite U -station or V-station. Each element of the matrix is the Boolean variable xut = {0; 1}, which takes the values xut = 1, if the station st can be included in the concentration area Ru (st Ru), and xut = 0 otherwise (st Ru). Each station st corresponds to a certain value of the average annual amount of grain loading qt (1), as well as a certain parameter eut, which characterizes the value of additional costs when the station st is included in the loading con-centration area Ru. st Ru. The objective function
(4) in this case takes the following form:
1 1 1 1
1 1 1 1
max
max min
m n m n
t ut t ut
u t u t
m n m n
ut ut ut ut
u t u t
q x q x
e x e x
(5)It should be noted that determining the values of the parameter eut for each grain loading station directly in monetary terms is a very complex and time-consuming task. In this connection we ac-cepted the parameterized scale of values eut {1; 10}, when eut = 1 corresponds to the minimum level of additional costs when including station st into the concentration area *
u
R , and eut = 10 – to the maximum. The specific values of eut for each sta-tion at the stage of preliminary calculasta-tions are determined expertly.
Let us state the constraints of the problem:
1
( t)( m ut 1), 1,2,..., u
s x t n
(6)*
min
1 1
( u)( n t ut n t ut 0), 1,2,...,
t t
R q x Q q x u m
(7)
( st Ru)(xut 0),u1,2,..., ;m t1,2,...,n (8)
The constraint (6) means that each station st can be included in not more than one concentration area *
u
R , but it can be included in no area. The con-straint (7) determines that the total volume of load-ing for each concentration area *
u
R must not be less than Qmin (2), otherwise this region is excluded,
and the stations included in it are redistributed among other areas. The constraint (8) excludes the possibility of adding the station st to the area Ru*, if this is not provided in the original set R (see Table 1).
objec-
ЕКСПЛУАТАЦІЯТАРЕМОНТЗАСОБІВТРАНСПОРТУ
doi 10.15802/stp2017/99952 © D. M. Kozachenko, R. V. Vernigora, R. S. Rustamov, 2017 tive function (11) in this case takes the following
form:
0 0
1 1 1 1
( q m n t ut e m n ut ut) max
u t u t
w q x w e x
,where 0, 0
t ut
q e – normalized values of the parame-ters of grain loading stations; wq, we – weight coef-ficients of the optimization criteria, the specific
values of which (in the range [0; 1]) are deter-mined expertly
The resulting problem was solved with the help of the simplex method, modified for problems with Boolean variables [11]. As a result, the subset R*,
was formed, which is a union of disjoint sets *
u
R ; each such set *
u
R corresponds to a certain area, where the grain loading concentration is the most effective (Table 2).
Table 2
Effective areas of grain loading concentration
No. Multiple junction su* Stations of loading concentration area Ru*
Total loading, wag/year
1 Drabovo-Baryatinskaya Maryanovka, Grebenka 5808
2 Priluki Galka 6208
3 Uman Potash 3014
4 Romodan Horol, Sencha 4622
5 Piryatin Linovitsyi, Lazorki 4805
6 Nosovka Nezhin, Bobrovitsyi 7353
7 Toropilovka Sumy, Syirovatka, Basyi, Golovashevka 7121
8 Hristinovka Monastyirische 5725
9 Mirgorod Gogolevo, Melashenkovo 3703
10 Sula Yuskovtsyi, Lohvitsa 5911
11 Aleksandriya Koristovka, Korolevka, Pantaevka, Schastlivaya 5875
12 Zolotonosha 1 Zolotonosha-1, Palmira 5214
13 Romnyi Belovodyi, Andreyashevka 4418
14 Ustinovka Fastov-1, Belaya Tserkov 4106
15 Karlovka Seleschina, Lannaya 4020
16 Yagotin – 3911
17 Gorodishche Korsun, Signaevka, Tsvetkovo 3823
18 Kryzhopol Vapnyarka, Knyazhevo, Popelyuhi 3640
19 Starobelsk – 3570
20 Pomoshnaya Novoukrainka, Lyudmilovka 3498
21 Reshetilovka Fedunka, Sagaydak, Brateshki, Umantsevka 3494
22 Kamenets-Podolskiy – 3248
23 Zakomel'skaya Savintsyi, Izyum 3149
ЕКСПЛУАТАЦІЯТАРЕМОНТЗАСОБІВТРАНСПОРТУ
doi 10.15802/stp2017/99952 © D. M. Kozachenko, R. V. Vernigora, R. S. Rustamov, 2017 In the final solution, 70 stations are included in
24 grain loading concentration areas, which, with minimal additional costs, provides the maximum total volume of grain loading by unit trains with 109344 wag. per year.
Originality and practical value
The originality of the work lies in the fact that the authors, based on the modern mathematical apparatus of cluster analysis, set theory and multi-criteria optimization, developed the methodology for the formation of grain loading concentration areas on the Ukrainian railways network that takes into account both infrastructure-technological and economic factors.
Application of the developed method of grain loading concentration for the formation of unit trains will significantly reduce the logistics costs in the supply chain of grain to Ukrainian ports for export and, consequently, increase its competitive-ness in foreign markets.
Conclusions
The performed researches allow drawing the following conclusions.
1. Ukraine is one of the world's largest grain exporters. At the same time, one of the main prob-lems in the export of Ukrainian grain is a high
share of logistics costs, which reaches 35% of the final cost of production.
2. More than 95% of the grain is exported through the seaports of Ukraine, whereto the delivery is carried out mainly by rail transport by carload. One of the ways to reduce costs in the lo-gistics chain of grain delivery to ports is the rout-ing of rail traffic. The experience of the USA and Canada shows that the introduction of grain unit trains allows reducing the share of logistics costs up to 9%.
3. To organize the shipper routing of grain transportation by rail it is necessary to form a net-work of terminal elevators for grain loading con-centration. Delivery of grain from linear to termi-nal elevators can be carried out by road.
4. The selection of junction stations and grain loading concentration areas is a complex task, which is proposed to be solved on the basis of clus-ter analysis, set theory and multi-criclus-teria optimiza-tion.
5. Using the developed methodology, there are selected 24 areas of possible grain loading concen-tration on the Ukrainian rail network, which cover 70 stations and, with a minimum additional cost, provide for about 110,000 ths. wag. per year of unit trains (more than 7 million tons of grain).
LIST OF REFERENCE LINKS
1. Алгоритмы: построение и анализ / Т. Кормен, Ч. Лейзерсон, Р. Ривест, К. Штайн. – Москва : ООО «И. Д. Вильямс», 2013. – 1328 с.
2. Андерсон, Т. В. Введение в многомерный статистический анализ / Т. В. Андерсон. – Москва : Физматгиз, 1963. – 360 с.
3. Ахо, А. Построение и анализ вычислительных алгоритмов / А. Ахо, Дж. Хопкрофт, Дж. Ульман. – Москва : Мир, 1979. – 536 с.
4. Вернигора, Р. В. Оценка уровня профессиональной подготовки дежурных по станции
с использованием компьютерных тренажеров / Р. В. Вернигора, В. В. Малашкин // Транспортні системи і технології перевезень : зб. наук. пр. Дніпропетр. нац. ун-ту залізн. трансп. ім. акад. В. Лазаряна. – Дніпропетровськ, 2015. – Вип. 10. – С. 29–37.
5. Дюран, Б. Кластерныйанализ / Б. Дюран, П. Оделл. – Москва : Книгапотребованию, 2012. – 128 с. 6. ЕнергетичнийбалансУкраїниза 2015 рік [Electronic resource] / ДержавнаслужбастатистикиУкраїни. –
Available at: http://ukrstat.gov.ua/operativ/operativ2016/energ/en_bal/Bal_2015_u.zip. – Title from the screen. – Accessed : 03.03.2017.
7. Зак, Ю. А. Прикладныезадачимногокритериальнойоптимизации / Ю. А. Зак. – Москва : Экономика, 2014. – 455 с.
ЕКСПЛУАТАЦІЯТАРЕМОНТЗАСОБІВТРАНСПОРТУ
doi 10.15802/stp2017/99952 © D. M. Kozachenko, R. V. Vernigora, R. S. Rustamov, 2017
9. Киселева, Е. М. Модели и методы решения непрерывных задач оптимального разбиения множеств: линейные, нелинейные, динамическиезадачи : монография / Е. М. Киселева, Л. С. Коряшкина. – Киев : Наук. думка¸ 2013. – 607 с.
10. Козаченко, Д. М. Удосконалення технічного забезпечення та технологій експортних перевезень зерновихвантажів вУкраїні / Д. М. Козаченко, Р. Г. Коробйова, Р. Ш. Рустамов // Вісн. Дніпропетр. держ. аграрно-економ. ун-ту. – 2015. – № 4. – С. 121–127.
11. Колодійчук, В. А. Ефективність логістики зерна та продуктів його переробки : монографія / В. А. Колодійчук. – Львів : Укр. бестселер, 2015. – 574 с.
12. Корбут, А. А. Дискретноепрограммирование / А. А. Корбут, Ю. Ю. Финкельштейн. – Москва : Наука, 1969. – 368 с.
13. Мандель, И. А. Кластерныйанализ / И. А. Мандель. – Москва : Финансыистатистика, 1988. – 215 с.
14. Обзор рынка зерновых [Electronic resource]. – Available at:
http://www.igc.int/downloads/gmrsummary/gmrsummr.pdf. – Title from the screen. – Accessed : 03.03.2017. 15. Рустамов, Р. Ш. Оценка перспектив развития зерновой логистики в Украине / Р. Ш. Рустамов //
Транспортні системи і технології перевезень : зб. наук. пр. Дніпропетр. нац. ун-ту залізн. трансп. ім. акад. В. Лазаряна. – Дніпропетровськ, 2014. – Вип. 8. – С. 127–133.
16. Тарифноеруководство№ 4 железныхдорогУкраины. – Киев : Логос, 2001. – 403 с.
17. Укрзализныця оценивает дефицит зерновозовв 500–1000 вагонов ежесуточно [Electronic resource]. – Available at: http://cfts.org.ua/news/2016/10/06/ukrzaliznytsya_otsenivaet_defitsit_zernovozov_v_500_1000_ vagonov_ezhesutochno_36864. – Title from the screen. – Accessed : 03.03.2017.
18. Штойер, Р. Многокритериальная оптимизация. Теория, вычисления и приложения / Р. Штойер. – Москва : Радиоисвязь, 1992. – 504 с.
19. Энслейн, К. СтатическиеметодыдляЭВМ / К. Энслейн. – Москва : Наука, 1986. – 464 с.
20. Hauser, R. J. Implicit Values of Multiple Car Grain Loading Facilities in Iowa and Nebraska / R. J. Hauser, J. Beaulieu, C. P. Baumel // North Central J. of Agricultural Economics. – 1984. – Vol. 6. – Iss. 2. – Р. 80–90. doi: 10.2307/1349253.
21. Hyland, M. Analytical models of rail transportation service in the grain supply chain: Deconstructing the operational and economic advantages of shuttle train service / M. Hyland, H. Mahmassani, L. Mjahed // Transportation Research, Part E: Logistics and Transportation Review. – 2016. – Vol. 93. – Р. 294–315. doi: 10.1016/j.tre.2016.06.008.
22. Ndembe, E. Hard Red Spring Wheat Marketing: Effects of Increased Shuttle Train Movements on Railroad Pricing in the Northern Plains / E. Ndembe // J. of the Transportation Research Forum. – 2015. – Vol. 54, No. 2. – Р. 101–115.
23. Nightengale, E. A. Some Effects of Recent Changes in the Railway Grain-Rate Structure on Interregional Competition and Regional Development / E. A. Nightengale, J. Davidson, H. Ottoson // Transportation Problems and Policies in the Trans-Missouri West. – Lincoln : University of Nebraska Press, 1967. – Р. 77–102.
24. Railroad Revitalization and Regulatory Reform Act of 1976 [Electronic resource] : Public Law 94-210, § 801. – Available at: http://www.legisworks.org/GPO/STATUTE-90-Pg31.pdf. – Title from the screen. – Accessed : 03.03.2017.
25. Sarmiento, C. Spatial Modeling in Technology Adoption Decisions: The Case of Shuttle Train Elevators / C. Sarmiento, W. Wilson // American J. of Agricultural Economics. – 2005. – Vol. 87. – Iss. 4. – Р. 1034–1045. doi: 10.1111/j.1467-8276.2005.00786.x.
26. Schnake, L. D. Inland grain elevator operating costs and capital requirements [Electronic resource] / L. D. Schnake, C. Jr. Stevensю // Kansas Agricultural Experiment Station. – 1983. – Bulletin 644. – P. 1–32. – Available at: https://www.ksre.k-state.edu/historicpublications/pubs/SB644.pdf. – Title from the screen. – Accessed : 03.03.2017.
27. Sparger, A. A comprehensive rail rate index for grain [Electronic resource] / A. Sparger, M. Prater. – Available at: http://ageconsearch.umn.edu/bitstream/147348/2/Rail%20Rate%20Index.pdf. – Title from the screen. – Accessed : 03.03.2017.
ЕКСПЛУАТАЦІЯТАРЕМОНТЗАСОБІВТРАНСПОРТУ
doi 10.15802/stp2017/99952 © D. M. Kozachenko, R. V. Vernigora, R. S. Rustamov, 2017
29. Wilson, W. U.S. grain handling and transportation system: factors contributing to the dynamic changes in the 1980s and 1990s [Electronic resource] / W. Wilson ; Dept. of Agricultural Economics, Agricultural Experiment Station, North Dakota State University. – Fargo, North Dakota, 1998. – 27 p. – Available at: http://ageconsearch.umn.edu/bitstream/23081/1/ae98004.pdf. – Title from the screen. – Accessed : 03.03.2017.
Д
.
М
.
КОЗАЧЕНКО
1*, P.
В
.
ВЕРНИГОРА
2*,
Р
.
Ш
.
РУСТАМОВ
3*1*Науково-дослідначастина, Дніпропетровськийнаціональнийуніверситетзалізничноготранспортуіменіакадеміка
В. Лазаряна, вул. Лазаряна, 2, Дніпро, Україна, 49010, тел. +38 (056) 373 51 09, ел. пошта [email protected], ORCID 0000-0003-2611-1350
2*Каф. «Станціїтавузли», Дніпропетровськийнаціональнийуніверситетзалізничноготранспортуіменіакадеміка
В. Лазаряна, вул. Лазаряна, 2, Дніпро, Україна, 49010, тел. +38 (056) 373 15 12, ел. пошта [email protected], ORCID 0000-0001-7618-4617
3*Регіональнафілія «ОдеськазалізницяПАТ «Укрзалізниця», вул. Пантелеймонівська, 19, Одеса, Україна, 65012,
тел. +38 (048) 727 30 96, ел. пошта [email protected], ORCID 0000-0002-5860-1840
СТВОРЕННЯ ЕКСПОРТНО-ОРІЄНТОВАНОЇ МЕРЕЖІ ЕЛЕВАТОРІВ
В УКРАЇНІ
Мета.Внауковійроботінеобхіднодослідитипитанняпідвищенняефективностіекспортнихзалізничних перевезеньзерновихвантажіввУкраїнізарахуноквпровадженнявідправницькоїмаршрутизаціїтаконцен -траціїнавантаженнязернанавузловихелеваторах. Методика. ЯксвідчитьдосвідСШАйКанади, одниміз ефективнихнапрямків зниження витрат улогістичному ланцюзі доставкизерна в портиє відправницька маршрутизаціязалізничнихперевезень. Відправницькамаршрутизаціяперевезеньзерновихвантажівперед -бачаєконцентраціюїхнавантаженнянавузловихстанціях. Вибірвузловихстанційпропонуєтьсяздійснюва -тизвикористаннямметодівкластерногоаналізу. Дляформуваннярайонівконцентраціїнавантаженнязерна використаніметодитеоріїмножинібагатокритеріальноїоптимізації. Результати. Наосновіагломеративно -гоалгоритмукластерногоаналізунамережізалізницьУкраїнивиділенівузловістанціїтасформованірайо -ниможливоїконцентраціїнавантаженнязерна. Звикористанням DSU-алгоритмувиділеніпересічнійнепе -ресічні райони концентрації. Задача вибору непересічних районів концентрації навантаження зерна формалізована як задача багатокритеріального цілочислового програмування з булевими змінними. У результаті розв'язання цієї задачі задопомогою модифікованого симплекс-методу на мережі залізниць Українивиділено 24 райониможливоїконцентраціїнавантаженнязерна, які охоплюють 70 станційта при мінімальнихдодаткових витратах забезпечують відправницькумаршрутизацію близько 7,5 млнт. зернав
рік. Науковановизна. Наосновісучасногоматематичногоапаратаавторамирозроблена методикавибору
вузловихстанцій та районівконцентраціїнавантаження зернових вантажівнамережізалізниць України з урахуванням економічної ефективності процесу. Практична значимість. Застосування розробленої методикиконцентрації навантаженнязернадля формування відправницькихмаршрутів дозволить суттєво знизити логістичні витрати в ланцюзі постачання українського зерна в морські порти на експорт і, відповідно, підвищитийогоконкурентоспроможністьназовнішніхринках.
Ключові слова: експорт зерна; елеватори; залізничні перевезення; відправницька маршрутизація; концентраціянавантаження
Д
.
Н
.
КОЗАЧЕНКО
1*, P.
В
.
ВЕРНИГОРА
2*,
Р
.
Ш
.
РУСТАМОВ
3*1*Научно-исследовательскаячасть, Днепропетровскийнациональныйуниверситетжелезнодорожноготранспортаимени
академикаВ. Лазаряна, ул. Лазаряна, 2, Днипро, Украина, 49010, тел. +38 (056) 373 51 09, эл. почта [email protected], ORCID 0000-0003-2611-1350
2*Каф. «Станциииузлы», Днепропетровскийнациональныйуниверситетжелезнодорожноготранспортаимени
академикаВ. Лазаряна, ул. Лазаряна, 2, Днипро, Украина, 49010, тел. +38 (056) 373 15 12, эл. почта [email protected], ORCID 0000-0001-7618-4617
3*Региональныйфилиал «Одесскаяжелезнаядорога» ПАО «Укрзализныця», ул. Пантелеймоновская, 19,
ЕКСПЛУАТАЦІЯТАРЕМОНТЗАСОБІВТРАНСПОРТУ
doi 10.15802/stp2017/99952 © D. M. Kozachenko, R. V. Vernigora, R. S. Rustamov, 2017
СОЗДАНИЕ ЭКСПОРТНО-ОРИЕНТИРОВАННОЙ СЕТИ
ЭЛЕВАТОРОВ В УКРАИНЕ
Цель. В научной работе необходимо рассмотреть вопрос повышения эффективности экспортных железнодорожныхперевозокзерновыхгрузоввУкраинезасчетвнедренияотправительскоймаршрутизации и концентрации погрузки зерна на узловых элеваторах. Методика. Как свидетельствует опыт США и Канады, однимиз эффективных направлений снижения расходов в логистической цепи доставки зерна в портыявляетсяотправительскаямаршрутизация железнодорожныхперевозок. Отправительскаямаршрути -зацияперевозокзерновыхгрузовпредусматриваетконцентрациюихпогрузкинаузловыхстанциях. Выбор узловыхстанцийпредлагаетсяосуществлятьсиспользованиемметодовкластерногоанализа. Дляформиро -ваниярайоновконцентрациипогрузкизернаиспользованыметодытеориимножествимногокритериальной
оптимизации. Результаты. На основе агломеративного алгоритма кластерного анализа
на сети железных дорог Украины выделены узловые станции и сформированы районы возможной
концентрации погрузки зерна. С использованием DSU-алгоритма выделены пересекающиеся и
непересекающиеся районы концентрации. Задача выбора непересекающихся районов концентрации погрузки зерна формализована как задача многокритериального целочисленного программирования с булевыми переменными. В результате решения этой задачи с помощью модифицированного симплекс -метода на сети железных дорог Украины выделено 24 района возможной концентрации погрузки зерна,
которые охватывают 70 станций и при минимальных дополнительных расходах обеспечивают
отправительскуюмаршрутизациюоколо 7,5 млнт. зернавгод. Научнаяновизна. Наосновесовременного
математического аппарата авторами разработана методика выбора узловых станций и районов
концентрации погрузки зерновых грузов на сети железных дорог Украины с учетом экономической эффективностипроцесса. Практическая значимость. Применениеразработанной методикиконцентрации
погрузки зерна для формирования отправительских маршрутов позволит
существенноснизитьлогистические расходыв цепипоставкиукраинского зернав морские портынаэкс -порти, соответственно, повыситьегоконкурентоспособностьнавнешнихрынках.
Ключевые слова: экспорт зерна; элеваторы; железнодорожные перевозки; отправительская маршрутизация; концентрацияпогрузки
REFERENCES
1. Cormen, T. H., Leiserson, C. E.; Rivest, R. L., & Stein, C. (2013). Introduction to Algorithms (3rd ed.). Moscow: I. D. Vilyams.
2. Anderson, T. V. (1963). Vvedeniye v mnogomernyy statisticheskiy analiz. Moscow: Fizmatgiz.
3. Aho, A. V., Hopcroft, J. E., & Ullman, J. D. (1979). The design and analysis of computer algorithms. Moscow: Mir.
4. Vernigora, R. V., & Malashkin, V. V. (2015). Assessment training level of railway dispatchers using computer simulators. Transport Systems and Transportation Technologies, 10, 29-37. doi: 10.15802/tstt2015/57063 5. Duran, B. S., & Odell. P. L. (2012). Cluster Analysis. Moscow: Kniga po trebovaniyu.
6. State Statistics Service of Ukraine. (2016). Energy balance of Ukraine for 2015 year. Retrieved from http://ukrstat.gov.ua/operativ/operativ2016/energ/en_bal/Bal_2015_u.zip
7. Zak, Y. A. (2014). Prikladnyye zadachi mnogokriterialnoy optimizatsii. Moscow: Ekonomika.
8. Ministry of Infrastructure of Ukraine. (2009). Zbirnyk taryfiv na perevezennia vantazhiv zaliznychnym transportom u mezhakh Ukrainy ta poviazani z nymy posluhy. Kyiv: TOV «Inpres».
9. Kiseleva, Y. M., & Koryashkina, L. S. (2013). Modeli i metody resheniya nepreryvnykh zadach optimalnogo razbieniya mnozhestv: lineynyye, nelineynyye, dinamicheskiye zadachi. Kyiv: Naukova dumka.
10. Kozachenko, D. M., Korobyova, R., & Rustamov, R. (2015). Improving of technical means and technologies of grain transportation for export in Ukraine. Visnyk Dnipropetrovs’kogo derzhavnogo agrarno-economichnogo universytetu, 4, 121-127.
11. Kolodiichuk, V. A. (2015). Efektyvnist lohistyky zerna ta produktiv yoho pererobky. Lviv: Ukrainskyi bestseler. 12. Korbut, A. A., & Finkelshteyn, Y. Y. (1969). Diskretnoye programmirovaniye. Moscow: Nauka.
13. Mandel, I. A. (1988). Klasternyy analiz. Moscow: Finansy i statistika.
14. International Grains Council. (2016 November, 24). Obzor rynka zernovykh. Retrieved from
ЕКСПЛУАТАЦІЯТАРЕМОНТЗАСОБІВТРАНСПОРТУ
doi 10.15802/stp2017/99952 © D. M. Kozachenko, R. V. Vernigora, R. S. Rustamov, 2017
15. Rustamov, R. (2014). The assessment of the prospects for the development of grain logistics in Ukraine. Transport Systems and Transportation Technologies, 8, 127-133. doi: 10.15802/tstt2014/38101
16. Ministry of Infrastructure of Ukraine. (2001). Tarifnoye rukovodstvo №4 zheleznykh dorog Ukrainy. Kyiv: Logos.
17. Centre for Transport Strategies. (2016 October, 06). Ukrzaliznytsya otsenivayet defitsit zernovozov v 500-1000 vagonov ezhesutochno. Retrieved from http://cfts.org.ua/news/2016/10/06/ukrzaliznytsya_otsenivaet_defitsit_zernovozov_v_500_1000_vagonov_ezhe sutochno_36864
18. Shtoyer, R. (1992). Mnogokriterialnaya optimizatsiya. Teoriya, vychisleniya i prilozheniya. Moscow: Radio i svyaz.
19. Ensleyn, K. (1986). Staticheskiye metody dlya EVM. Moscow: Nauka.
20. Hauser, R. J., Beaulieu, J., & Baumel, C. P. (1984). Implicit Values of Multiple Car Grain Loading Facilities in Iowa and Nebraska. North Central Journal of Agricultural Economics, 6(2), 80-90. doi: 10.2307/1349253 21. Hyland, M., Mahmassani, H., & Mjahed L. (2016). Analytical models of rail transportation service in the grain
supply chain: Deconstructing the operational and economic advantages of shuttle train service. Transportation Research, Part E: Logistics and Transportation Review, 93, 294-315. doi: 10.1016/j.tre.2016.06.008
22. Ndembe, E. (2015). Hard Red Spring Wheat Marketing: Effects of Increased Shuttle Train Movements on Railroad Pricing in the Northern Plains. Journal of the Transportation Research Forum, 54(2), 101-115. 23. Nightengale, E. A., Davidson, J., & Ottoson, H. (1967). Some Effects of Recent Changes in the Railway
Grain-Rate Structure on Interregional Competition and Regional Development. Transportation Problems and Policies in the Trans-Missouri West, 77-102.
24. Railroad Revitalization and Regulatory Reform Act, Public Law 94-210, § 801. (1976). Retrieved from http://www.legisworks.org/GPO/STATUTE-90-Pg31.pdf
25. Sarmiento, C., & Wilson, W. W. (2005). Spatial Modeling in Technology Adoption Decisions: The Case of Shuttle Train Elevators. American Journal of Agricultural Economics, 87(4), 1034-1045. doi: 10.1111/j.1467-8276.2005.00786.x
26. Schnake, L. D., & Stevens, C. A. (1983). Inland grain elevator operating costs and capital requirements. Bulletin: Kansas Agricultural Experiment Station, 644. Retrieved from https://www.ksre.k-state.edu/historicpublications/pubs/SB644.pdf
27. Sparger, A., & Prater M. E. (2013). A comprehensive rail rate index for grain. U.S. Department of Agriculture. doi: 10.9752/TS060.04-2013
28. Staggers Rail Act, Public Law 96-448. (1980). Retrieved from https://www.gpo.gov/fdsys/pkg/STATUTE-94/pdf/STATUTE-94-Pg1895.pdf
29. Wilson, W. W. (1998). U.S. grain handling and transportation system: factors contributing to the dynamic changes in the 1980s and 1990s. Fargo, North Dakota: Department of Agricultural Economics, Agricultural Experiment Station, North Dakota State University. Retrieved from http://ageconsearch.umn.edu/bitstream/23081/1/ae98004.pdf
Prof. V. I. Bobrovskiy, D. Sc. (Tech.), (Ukraine), Prof. O. M. Ogar, D. Sc. (Tech.), (Ukraine) recommended this article to be published