p-ISSN:2460-1497 and e-ISSN: 2477-3840 DOI: https://doi.org/10.26858/est.v6i2.13179
178
Comparison of the Accuracy of Item Response Theory Models in
Estimating Student’s Ability
Ilham Falani1, Makruf Akbar2, Dali Santun Naga3
1Measurement and evaluation, Universitas Negeri Jakarta, Indonesia
Email: [email protected]
2Measurement and evaluation, Universitas Negeri Jakarta, Indonesia
Email: [email protected]
3 Measurement and evaluation, Universitas Negeri Jakarta, Indonesia
Email: [email protected]
(Received: March-2020; Reviewed: March-2020; Accepted: June-2020;
Available online: June-2020; Published: August-2020)
This is an open access article distributed under the Creative Commons Attribution License CC-BY-NC-4.0 ©2019 by author (https://creativecommons.org/licenses/by-nc/4.0/ ).
Abstract. This study aims to determine the item response theory model which is more accurate
in estimating students' mathematical abilities. The models compared in this study are Multiple Choice Model and Three-Parameter Logistic Model. Data used in this study are the responses of a mathematical test of 1704 eighth-grade junior high school students from six schools in the Depok City, West Java. The Sampling is done by using a purposive random sampling technique. The mathematics test used for research data collection consisted of 30 multiple choice format items. After the data is obtained, Research hypotheses were tested using the variance test method (F-test) to find out which model is more accurate in estimating ability parameters. The results showed that Fvalue is obtained 1.089, and Ftable is 1.087, thevalue of Fvalue > Ftable, so it
concluded that Ho rejected. That means Multiple Choice Model is more accurate than
Three-Parameter Logistic Model in estimating the parameters of students' mathematical abilities. This makes the Multiple-Choice Model a recommended model for estimating mathematical ability in MC item format tests, especially in the field of mathematics and other fields that have similar characteristics.
Keyword: Ability estimation, accuracy, item response theory
INTRODUCTION
Evaluation of learning outcomes is essential in efforts to improve the quality of education. Based on evaluation results, prepared appropriate corrective steps to improve the quality of the learning process. Therefore, we need valid information for evaluation material. An important component in evaluating learning outcomes is measurement. Accurate measurements produce valid information.
Measurement of student ability is important in evaluating learning outcomes. Student ability
describes student mastery of expected competency standards. Student ability is also a measure of the level of success of the learning process that has been implemented. Therefore the measurement of student ability must be done very accurately with the lowest possible error rate. Accurate measurement results produce reliable data. The data can then be processed into useful information as a consideration in compiling appropriate steps in improving the quality of learning.
the Item Response Theory (IRT) approach, which believed to increase validity and reliability in measurements (Linden, 2010; Zanon, et al., 2016). There are many models in the IRT approach that can be used in estimating the ability of test-takers. The selection of the right model is expected to be able to measure students' abilities accurately. Therefore, it is necessary to compare the accuracy of the model in estimating test-takers' ability; this is done to get the best model that produces accurate estimation results to obtain precise information to arrange the right steps in improving the quality of learning.
According to Borsboom (2017), the measurement of learning outcomes done using tests. The tests used based on competency standards according to the curriculum currently used in Indonesia. The test consisted of 30 items in a multiple-choice format. This selection is because this format test has many advantages. According to Yılmaz, (2019); Grunert, et al., (2013); Kastner & Stangl, (2011) the use of the MC format can minimize the cost and time of the test, increase the validity and reliability of the test, and it is easy to use in measuring several aspects simultaneously.
Based on literature studies that have carried out. Several previous studies have tried to analyze the accuracy of IRT models in estimating student ability parameters. Dragon (2012), Baker & Kim (2017), An & Yung (2014) suggested that many models can be used. The most frequently used model in analyzing the results of the MC format test responses is 3PLM. A literature study that has been done suggests that 3PLM produces excellent performance in the estimation of ability parameters, considering that 3PLM considers the possibility of guesses in making estimates (Naga, 2012). On the other hand, a previous study conducted by Kim and Hanson (2012) revealed that MCM could be used to analyze the results of MC format tests and produce more accurate ability measurements, especially at low ability (De Ayala, 2013).
In Indonesia, research related to the implementation of the IRT approach in measuring learning outcomes conducted by Sudaryono (2011) and Nurcahyo (2016), but this study did not use a specific model to estimate IRT parameters. Retnawati's research (2011) measured students' mathematical abilities using the Generalized Partial Credit Model (GPCM) polytomous model. Previously in 2006,
Retnawati researched analyzing students' mathematical abilities using 3PLM but did not compare the results with MCM, whereas Abadyo (2014) investigated the estimation of capability parameters by using a combination of 3PLM / GRM and MCM + GPCM, which used to analyze mixed-format test response data. Literature studies conducted show that there has not found a study that directly compares the level of accuracy of 3PLM and MCM empirically on the MC format test. Besides, research has not found comparing MCM and 3PLM directly using the same data, especially in mathematics tests based on the education curriculum in Indonesia.
The explanation above is the background of this study to directly compare 3PLM and MCM's accuracy using the same test data, where the tests used based on competency standards according to the curriculum used in Indonesia.
METHOD
This study uses data from the responses of students of the Eighth-Grade Junior High School Even Semester Academic Year 2018/2019 from six "A" accredited schools in the City of Depok, West Java, Indonesia. This research conducted in September 2018 until completion. The data collection of this study carried out using MC format tests totaling 30 items for the field of mathematics, which had been validated by experts.
The procedure for preparing the test instrument is as follows: (1) 1.Arranging items based on competency standards and indicators of learning achievements in the Kurikulum 2013 applicable in Indonesia; (2) Validate items that have been made through validation tests by experts in the field of mathematics. Content validation is done both quantitatively and qualitatively. To determine the suitability between competency standards, indicators, context, and language of delivery of test items; (3) Testing the instrument; (4) Perform validity and reliability calculations statistically; (5). Making improvements to the preparation of items based on the calculation of validity and reliability. So that the items used are all valid and reliable to collect research data.
contrast, the independent variable is the Item Response Theory model used in this study, namely: MCM and 3PLM.
Birnbaum introduced the three-parameter logistics model (3PLM) in 1968. 3PLM logistical functions used to connect people's abilities and item parameters to the probability of correct responses for each item. 3PLM mathematical equation, as follows (Baker & Kim, 2017; Linden, 2016):
exp[ ( )] ( ) (1 ) ,
1 exp[ ( )]
i i
i i i
i i
Da b
P c c
Da b
− = + −+ −
( )
i
P
is an opportunity for participants with the ability
to answer correctly item i. The three parameter characteristics of item i arei
a representing slope, bidifficulty level, and
i
c guessing. The constant D in the above equation is 1,702, this constant is used in IRT in order to minimize the difference between normal and logistic distribution functions.
MCM is a model introduced by Thissen and Steinberg in 1984. This model recommended overcoming the limitations of the Nominal Response Model (NRM) in modeling multiple-choice guessing. The MCM mathematical equation developed by Tissen and Steinberg can be written as follows Suh & Bolt (2010),
0 0
0
exp( ) exp( )
( ) ,
exp( )
ik ik ik i i
ik m
ih ih
h
a c d a c
P
a c
=
+ + +
=
+
With k=1, …, m
0,
ik ik
a = c =
djk =1.( )
ik
P
is an opportunity for participants with the ability
to choose responses to k for item i.ik
a represents the slope in responses to k for
item i. bik the level of difficulty in responses to
k for item i, and cik guessing in responses to k
for item. dik probability response to k for item i
(Baker & Kim, 2017; Crc, Linden, & Crc, 2016).
Parameter estimation in this study uses the help of PARSCALE 4.1 (Toit, 2013). Software PARSCALE 4.1 is a calibration program that uses the Marginal Maximum Likelihood (MML) estimation method to estimate grain parameters
for models one, two, three, and several polytomous models.
The following is the research design used,
Table 1. Design of Accuracy Comparison
Statistic Model
MCM 3PLM
Scoring Polytomous Dichotomous
Variance 2
MCM
23PLM
df= n-1 df1= n-1 df2= n-1 Hypothesistesting
F-test
The test criteria used in assessing the level of accuracy of the estimates used in the study are the values of the estimated variance obtained. According to Naga (2012), if the parameter values that we obtain through estimates contain small variances, then this means that the parameter values obtained are sharp enough or careful enough. This is one way to assess the accuracy of a measurement that is no exception is the parameter estimation of students' abilities. Therefore, testing the hypothesis in this study was done by testing the difference in the value of the variance through the F test.
RESULTS AND DISCUSSION
In this study, the characteristics of the items owned by 3PLM and MCM did not participate compared, because the two models have a mathematical equation that cannot be compared (Bastari, 2015). Therefore this study only focuses on estimating the ability of examinee.
Estimation of the ability of the test was initially carried out on the results of the test responses of 1704 students. Checking the distribution of this ability is done using Statistical Package for Social Science (SPSS) 21 software. The normality test used is the Kolmogorov-Smirnov normality test.
Following is the Kolmogorov-Smirnov Normality test table,
Table 2. Normality test
Model
Kolmogorov-Smirnova
Statistic df Sig.
3PLM .018 1531 .200*
MCM .021 1531 .113
Based on the table above, it can be seen from the analyzed data that it produces sig values> 0.05. According to Kadir (2017) Kolmogorov-Smirnov test criteria, sig values> 0.05, then the data are normally distributed. This data then used to analyze and test hypotheses in this study.
Before further data analysis is done using PARSCALE 4.1. It is necessary to test the IRT prerequisite assumptions. According to Price (2017), unidimensional assumptions can be tested using factor analysis, with the help of SPSS 21 (Almquist, Ashir, & Brännström, 2020). The unidimensional test is carried out on the data before it used to estimate the ability of examinee.
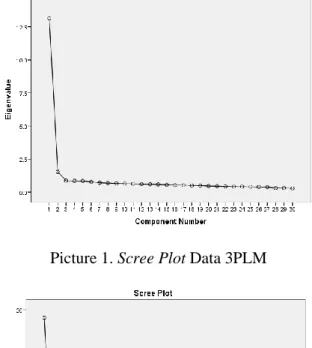
Based on SPSS 21 output, the results of dimension reduction for the tested data show that the principal axis factoring extracts the data into a number of factors with more than one eigenvalue. Data for 3PLM produces the main factor with a total variance explained by 43.8%, the second factor only contributes to the total variance explained by 5.1%, while the remainder contributes to the total variance explained which ranges from less than 0.8%. Data for MCM produces the main factor with a total variance explained by 63.7%, the second factor contributes a total variance explained by 3.4%, while the remainder contributes to the total variance explained which ranges from less than 1%.
The results of the calculation of the factor analysis of the data tested show that the main factors of each data can explain most of the total variance. So it can be concluded that the test items used are unidimensional. Most of the items form a factor which can be called general mathematical
ability.
Picture 1. Scree Plot Data 3PLM
Picture 2. Scree Plot Data MCM
Based on Figures 1 and 2, the scree plot graph, data processed using 3PLM (Figure 1) and MCM (Figure 2) shows that there is only one factor with the most dominant eigenvalue. This can be represented that the tests used to meet unidimensional requirements or measure only one dimension, namely mathematical ability.
After unidimensional prerequisite testing, the model goodness of fit test is then performed. Based on the results of the fit test on the test items with the help of PARSCALE 4.1, item fit statistics obtained the value of ꭓ2 3PLM is 434.71 (p-value =0.101), the value of ꭓ2 MCM is 448.47 (p-value = 1,000). The resulting values of ꭓ2 are less than the critical value of the distribusi ꭓ2 distribution, this shows that the model used has high fit with empirical data (Naga, 2012; Retnawati, 2014; Yılmaz, 2019). Furthermore, these models can be used to estimate the ability of students.
3,2 2,4 1,6 0,8 0,0 -0,8 -1,6 -2,4 140
120
100
80
60
40
20
0
Ability
F
re
q
u
en
c
y
Normal
Figure 3. Histogram of Ability Estimation with 3PLM.
2,4 1,6 0,8 0,0 -0,8 -1,6 -2,4 140
120
100
80
60
40
20
0
Ability
F
re
q
u
en
c
y
Normal
Figure 4. Histogram of Ability Estimation with MCM.
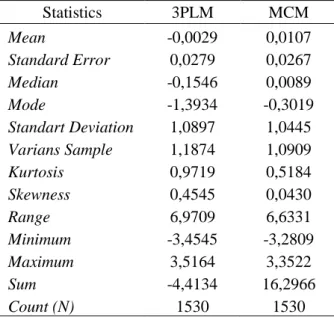
Table 3. Summary Description of Statistics
Statistics 3PLM MCM
Mean -0,0029 0,0107
Standard Error 0,0279 0,0267
Median -0,1546 0,0089
Mode -1,3934 -0,3019
Standart Deviation 1,0897 1,0445 Varians Sample 1,1874 1,0909
Kurtosis 0,9719 0,5184
Skewness 0,4545 0,0430
Range 6,9709 6,6331
Minimum -3,4545 -3,2809
Maximum 3,5164 3,3522
Sum -4,4134 16,2966
Count (N) 1530 1530
Table 3 is a summary of descriptive statistics that illustrate data from both data. It can see that the estimation results with 3PLM
produce a wider range of data compared to the estimated data range with MCM, whereas both data have the same average.
Hypothesis testing
The hypothesis in this study is that the variance of the estimated students’ ability with MCM is smaller than 3 PLM, the following is the statistical hypothesis,
2 2
3 3
0: 2 1; 1: 2 1
PLM PLM
MCM MCM
H
H
=
with: 2 3PLM
= variance of ability estimation with 3PLM.2
MCM
= variance of ability estimation with MCM.Table 4. Hypothesis testing Statistics Ability Estimation
3PLM MCM
n 1531 1531
df df1=n1-1 df2=n2-1
2
1.187 1.090F
i 1.187/1.090=1.0885
Ftable F(0.05;1530;1530) = 1.089
In the table above, we get the result of the value of Fcount>Ftable, so it concluded that Ho rejected. This means that the variance of the test taker's ability estimation results with MCM is smaller than the variation of the examinee's ability estimation results with 3PLM. Although both models are used to produce the same data, they provide different estimation results. According to Naga (2012), the smaller the variance produced from the estimated parameter, the more accurate the resulting estimate. Retnawati's research (2011) stated the same statement.
from the dichotomy. The results of this study show empirical evidence of the statement.
The difference in variance is caused by, according to Suh & Bolt (2010) items that are caught by politics in MCM can illustrate to what extent students' knowledge based on learning outcomes, while according to Ioannis, (2017) items that are dichotomized in 3PLM tend to ignore learning outcomes in part, by grouping all responses into two categories namely understanding "all" and "none." Political data allows measurement of ability levels, thus providing an opportunity to obtain more information, especially for medium-level abilities on each item. It causes the MCM to produce a capability estimate that is far more accurate than the 3PLM. This research is empirical proof of this statement by comparing politics and dichotomy directly by using the same data empirically.
In addition, note that MCM also considers guesses in analyzing examinees' responses. Guess opportunities calculated for all response categories. It indicated when the data calibrated using Parscale 4.1. The syntax used in estimating MCM's ability based on a combination of 3PLM and NRM (Abadyo & Bastari, 2015). This research is one of the empirical evidences that this model is ideal for analyzing MC format items. So far, 3PLM has stated as the best model for analyzing MC format test data because it considers guesses in the model's parameters.
ACKNOWLEDGMENTS
Acknowledgments to Lembaga Pengelola Dana Pendidikan (LPDP), which has sponsored this research.
CONCLUSIONS AND SUGGESTIONS
Based on the analysis results, it concluded empirically this study shows that MCM produces a more accurate estimation of examinees' abilities compared to 3PLM. Especially for mathematics ability tests that are compiled based on competency standards under the current curriculum in Indonesia. It expected that through the use of this, MCM could improve the accuracy of measuring the learning outcomes carried out so that the results of these measurements can be more accurate and made into consideration by teachers to make appropriate corrective steps in improving the quality of learning.
Suggestions for further research, there is a need for further investigation regarding mixed-format tests that combine MC mixed-format tests with other formats. The selection of the right model to use in analyzing the results of the mixed-format test improves the accuracy of measuring students' abilities.
REFERENCES
Abadyo. (2014). Estimasi Parameter Kemampuan dan Butir Tes Matematika dengan Menggunakan Kombinasi
3PLM/GRM dan MCM/GPCM.
Universitas Negeri Yogyakarta.
Abadyo, & Bastari. (2015). Estimation of Ability and Item Parameters in Mathematics Testing By Using The Combination of 3PLM/GRM and MCM/GPCM Scoring Model. Research and Evaluation in Education Journal, 1(1), 55–72.
Almquist, B., Ashir, S., & Brännström, L. (2020). A guide to quantitative methods. Sweden: Stockholm University.
An, X., & Yung, Y. (2014). Item Response Theory : What It Is and How You Can Use the IRT Procedure to Apply It. USA: SAS Institute.
Baker, F. B., & Kim, S. (2017). The Basics of Item Response Theory Using R. New York: Springer International Publishing.
Bastari. (2015). Comparison of IRT Models that Handle Dichotomous and Polytomous Response Data Simultaneously. Unpublished Paper Work.
Borsboom, D. (2017). Educational Measurement Structural Equation Modeling A Multidisicplinary Journal. Vol 4. October https://doi.org/10.1080/107055109032060 97
Linden, W. J. Van Der, & R. Hambleton (2016). Handbook of Item Response Theory (Vol. 2). New York: Springer.
Creswell, J. W., & Lecompte, M. D. (2012). Handbook on Measurement, Assessment, and Evaluation inHigher Education. Taylor & Francis The. New York: Taylor & Francis The.
De Ayala, R. J. (2013). The theory and practice of item response theory. New York: Guilford Publications.
Oxford University Press. https://doi.org/10.15713/ins.mmj.3
Grunert, M. L., Raker, R., Murphy, K. L., & Holme, T. A. (2013). Polytomous versus Dichotomous Scoring on Multiple-Choice Examinations: Development of a Rubric for Rating Partial Credit. Chemimcal Education.
Ioannis, K. (2017). Calibration and Validation of Instruments measuring Academic Ability in Physics using Item Response Theory. University of Ioannina.
Kadir. (2017). Statistika Terapan. (5, Ed.) (3rd ed.). Jakarta: Rajawali Press.
Kastner, M., & Stangl, B. (2011). Multiple Choice and Constructed Response Tests : Do Test Format and Scoring Matter ? Procedia - Social and Behavioral Sciences,
12, 263–273.
https://doi.org/10.1016/j.sbspro.2011.02.03 5
Kim, J., Madison, W., Hanson, B. A., & Mcgraw-hill, C. T. B. (2012). Test Equating Under the Multiple-Choice Model. Applied Psychological Measurement, 26(3), 255–270.
Naga, D. S. (2012). Teori Sekor pada Pengukuran Mental. Jakarta: PT Nagarani Citrayasa.
Nering, M. L., & Ostini, R. (2011). Handbook of Polytomous Item Response Theory Models. New York: Taylor & Francis.
Nurcahyo, F. A. (2016). Aplikasi IRT dalam Analisis Aitem Tes Kognitif, 24(2), 64–75. https://doi.org/10.22146/buletinpsikologi.2 5218
Price, L. R. (2017). Psychometric Methods Theory into Practice. New York: The Guilford Press.
Retnawati, H. (2011). Mengestimasi Kemampuan Peserta Tes Uraian Matematika Dengan Penskoran Politomus, Prosiding Semnas Matematika UNY, Mei 2011. 53–62.
Retnawati, H. (2014). Teori Respon Butir dan Penerapannya (Untuk Peneliti, Praktisi Pengukuran dan Pengujian, Mahasiswa Pascasarjana) (1st ed.). Yogyakarta: Mulia Medika.
Sudaryono. (2011). Implementasi Teori Responsi Butir (Item Response Theory) Pada Penilaian Hasil Belajar Akhir di Sekolah. Jurnal Pendidikan Dan
Kebudayaan, 17(6), 719.
https://doi.org/10.24832/jpnk.v17i6.62 Suh, Y., & Bolt, D. (2010a). Nested Logit
Models for Multiple-Choice Item Response Data. Psychometrika, 75(3), 454–473. https://doi.org/10.1007/s11336-010-9163-7
Suh, Y., & Bolt, D. M. (2010b). Nested Logit Models for Multiple-Choice Item Response Data. Psychometrika, (C), 454– 473.
Thissen, D., & Steinberg, L. (1984). A response model for multiple choice items. Psychometrika, 49(4), 501–519. https://doi.org/10.1007/BF02302588 Toit, M. du. (2013). IRT from SSI : Bilog-MG,
Multilog, Parscale, Testfact. United States of America: Scientific Software International, Inc.
Van Der Linden, W. J. (2010). Item response theory. International Encyclopedia of
Education, 4, 81–88.
https://doi.org/10.1016/B978-0-08-044894-7.00250-5
Yılmaz, H. B. (2019). A Comparison of IRT Model Combinations for Assessing Fit in a Mixed Format Elementary School Science Test. International Electronic Journal of Elementary Education, 11(5), 539–545. https://doi.org/10.26822/iejee.2019553350 Zanon, C., Hutz, C. S., Yoo, H. H., &