Intelligent and Improved Self-Adaptive Anomaly
based Intrusion Detection System for Networks
Zouhair Chiba, Noreddine Abghour, Khalid Moussaid, Amina El omri and Mohamed Rida
LIMSAD Labs, Faculty of Sciences Ain Chock, Hassan II University of Casablanca, 20100, Casablanca, Morocco
Abstract: With the advent of digital technology, computer networks have developed rapidly at an unprecedented pace contributing tremendously to social and economic development. They have become the backbone for all critical sectors and all the top Multi-National companies. Unfortunately, security threats for computer networks have increased dramatically over the last decade being much brazen and bolder. Intrusions or attacks on computers and networks are activities or attempts to jeopardize main system security objectives, which called as confidentiality, integrity and availability. They lead mostly in great financial losses, massive sensitive data leaks, thereby decreasing efficiency and the quality of productivity of an organization. There is a great need for an effective Network Intrusion Detection System (NIDS), which are security tools designed to interpret the intrusion attempts in incoming network traffic, thereby achieving a solid line of protection against inside and outside intruders. In this work, we propose to optimize a very popular soft computing tool prevalently used for intrusion detection namely Back Propagation Neural Network (BPNN) using a novel machine learning framework called “ISAGASAA”, based on Improved Self-Adaptive Genetic Algorithm (ISAGA) and Simulated Annealing Algorithm (SAA). ISAGA is our variant of standard Genetic Algorithm (GA), which is developed based on GA improved through an Adaptive Mutation Algorithm (AMA) and optimization strategies. The optimization strategies carried out are Parallel Processing (PP) and Fitness Value Hashing (FVH) that reduce execution time, convergence time and save processing power. While, SAA was incorporated to ISAGA in order to optimize its heuristic search. Experimental results based on Kyoto University benchmark dataset version 2015 demonstrate that our optimized NIDS based BPNN called “ANID BPNN-ISAGASAA” outperforms several state-of-art approaches in terms of detection rate and false positive rate. Moreover, improvement of GA through FVH and PP saves processing power and execution time. Thus, our model is very much convenient for network anomaly detection.
Keywords: Network intrusion detection system, Back propagation neural network, Optimization, Self-adaptive genetic algorithm, Simulated annealing algorithm, Kyoto dataset.
1.
Introduction
In the recent years, the use of Internet in terms of social networking sites, e-commerce, e-banking and many more applications have been raising exponentially. Now all type of businesses and information resources are available at the Internet for exchanging information, social networking, searching, purchasing and educational services [1, 2]. The rapid development and expansion of World Wide Web and computer networks have changed the computing world in the last decade and have especially favored the advent of the Internet. Today, the computers and its networking have become the backbone for critical sectors and all the top multi-national companies [3]. In fact, computer networks contribute significantly to social and economic development; international trade, healthcare systems and military capabilities are examples of human activity that increasingly
rely on networks. This has led to an increasing interest in the security of networks by industry and researchers [4].
Cybersecurity is a serious issue for any sector in the cyberspace as the number of security breaches is rising from time to time, as result, thousands of zero-day attacks are continuously emerging [5]. Cyber-attacks is modern war without weapons yet most calamitous and harmful leading to exposing sensitive personal and business information, disrupting critical operations, continuous vulnerabilities, unauthorized and illegal access to devices and software’s there by imposing high costs on the country economy [3]. In the coming years, cyber attacks will almost certainly intensify. Networking technology vendor Cisco Systems forecasts that by 2020, 50 billion devices will be connected to the Internet, including a large portion of industrial, military and aerospace related devices and systems. Each new thing that connects to cyberspace is a potential target for a cyber attack [6]. Moreover, the well-known internet security corporation, Symantec, states in its 2018 Internet Security Threat Report (ISTR) [7] that “From the sudden spread of WannaCry and Petya/NotPetya, to the swift growth in coinminers, 2017 provided us with another reminder that digital security threats can come from new and unexpected sources. With each passing year, not only has the sheer volume of threats increased, but the threat landscape has become more diverse, with attackers working harder to discover new avenues of attack and cover their tracks while doing so”. Also, McAfee; the American global computer security software company, in its 2018 Threats Predictions Report [8] previews that “Attackers will target less traditional, more profitable ransomware targets, including high net-worth individuals, connected devices and businesses. This pivot from the traditional will see ransomware technologies applied beyond the objective of extorting individuals, to cyber sabotage and disruption of organizations. The drive among adversaries for greater damage, disruption, and the threat of greater financial impact will not only spawn new variations of cybercrime ‘business models’, but also begin to seriously drive the expansion of the cyber insurance market”. These reports indicate that today, it has become more substantial to defend IT infrastructure from security issues. Security has now become necessary due to intensive use of information technologies in day-to-day life with greatly confidential commercial and personal data being transferred over the network [9].
method, which is widely deployed in network architectures in order to watch for abnormalities in traffic, to raise alarm and eventually respond to any malicious or suspicious activity in the network [11]. Network-based intrusion detection is generally implemented using two techniques; misuse-based (also called rule based) and anomaly-based.
• Signature-based intrusion detection: This approach is intended to identify known attack patterns. Initially, all the known attack patterns are specified, and any incoming packet matching with any of these patterns stored in signature database is considered to be an intrusion.
• Anomaly-based intrusion detection: This approach
creates a model or a profile from normal behaviors and any deviation from this model is reported as an intrusion. Both anomaly and misuse-based systems [9] have their own limitations. Misuse systems fail to detect new attacks and derivative of known attacks; they can only detect the attacks, which are predefined with their signatures in misuse/signature database. Whereas, anomaly-based systems are able to detect novel attacks have abnormal patterns without prior knowledge, since the classification model established by this approach has the generalization ability to extract intrusion pattern and knowledge during the training phase [10]. However, number of false alarms (false negatives and false positives), i.e., the possibility misclassification of an attack and legitimate/normal pattern is high. In signature-based IDS there is very less chance of wrong classification except the incapability of detecting new attacks. Hence currently, although misused detection techniques are most commonly used in practice, but there are good features of detecting novel attacks in anomaly-based systems, which can give better results when there is reduction in the false alarms. Therefore, a lot of research is going on in building anomaly-based systems to minimize false positives and false negatives using soft computing techniques and other techniques [12]. Hence, in this study, we focus on the anomaly detection, because theoretically, it is capable of detecting both known and new unseen attacks, and under the current complicated network environment, the anomaly detection is much more required and has a better application foreground. On the negative side, anomaly detection can detect normal new packets as attack and vice versa, thus raising false alarm rate [11].
Nowadays, with the rise of machine learning (ML) related models [13], it is becoming a trend to apply machine learning methods into intrusion detection system. In the field of machine learning, one of the techniques that has successful used in solving complex practical problems is neural network. Artificial neural networks have the ability to solve several problems confronted by the other present techniques used in intrusion detection [14]. There are three advantages of intrusion detection based on neural network [15, 16]:
• Neural network provides elasticity in intrusion detection process, where the neural network has the ability to analyze and ensure that data right or partially right. Likewise, neural network is capable of performing analysis on data in nonlinear fashion.
• Neural network has the ability to process data from a
number of sources in a non-linear fashion. This is very important especially when coordinated attack by multiple attackers is conducted against the network.
• Neural network is characterized by high speed in processing data [17].
According to survey in [18], anomaly-based detection approach namely Back Propagation Neural Network (BPNN) has good detection rate as compared to other neural network technique [17].
Our goal in this work is to build an effective and efficient NIDS based on anomaly approach using a very popular soft computing tool widely used for intrusion detection, namely Back Propagation Neural Network (BPNN), optimized through a novel hybrid machine learning framework called “ISAGASAA”, which combines Improved Self-Adaptive Genetic Algorithm (ISAGA) and Simulated Annealing Algorithm (SAA). The role of the developed framework is to search and find the optimal or near optimal values of two prominent parameters of BPNN, namely Learning rate and Momentum term with the purpose to improve performance of BPNN classifier. ISAGA is a variant of standard Genetic Algorithm (GA), which is developed based on GA, improved through an Adaptive Mutation Algorithm (AMA) [19] and optimization strategies. AMA allows to automatically adjust the mutation rate should be applied for any given individual from the population of ISAGA, in order to augment the chance of preserving individuals that are performing well versus the optimization problem in hand and reduce the chance of preserving individuals that don’t perform well. That tuning or adjustment of mutation rate take place while ISAGA is running, hopefully resulting in the best parameters being used at any specific time during execution. It is this continuous adaptive adjustment of ISAGA parameters that will often result in its performance improvement. Further, ISAGA is optimized through optimization strategies, like Parallel Processing and Fitness Value Hashing, which reduce execution time, convergence time and save processing power. As the fitness function is typically the most computationally expensive component, and it is often going to be the bottleneck of GA, this makes it an ideal candidate for multi-core optimization (Parallel Processing). By using multiple cores, it is possible to compute the fitness of numerous individuals simultaneously [9, 17]. Besides, Fitness Value Hashing is another strategy that can reduce the amount of time spent computing fitness values by storing previously calculated fitness values in a hash table. Thereby, when a previously visited solution (chromosome) is revisited, its fitness value can be retrieved from the hash table, avoiding the need to recalculate it. SAA was incorporated to ISAGA to optimize its heuristic search. In fact, SAA reduces slowly crossover rate during ISAGA process that pushes it to focus its search on areas of search space where fitness values are higher. The main aim of our proposed IDS is to detect network attacks (known attacks and unseen attacks), while ensuring higher detection rate, lower false positive rate, higher accuracy and higher precision with an affordable computational cost and low execution time.
present briefly Back Propagation Neural Network and Simulated Annealing Algorithm, while in the second part, we introduce different components to build our ISAGA algorithm, namely standard Genetic Algorithm (GA), Adaptive Mutation Algorithm and the optimization strategies applied to GA (Parallel processing and Fitness value hashing). Section 4 provides an overview of our previous IDS, presents our new proposed system in detail, describes its work, explains the role of Simulated Annealing Algorithm in this system and provides the framework of our model. Section 5, introduces the Kyoto Benchmark dataset used in our experimentation and describes the approach adopted for data pre-processing. Experimental results and analysis are given in section 6. Finally, section 7 ends with the conclusions.
2.
Literature Review
Rinku Sen et al. [20] have developed a flexible back propagation neural network (BPNN) architecture to identify the intrusion based on anomaly detection approach. To look for the best architecture, they have tested different combinations of hidden layers and various neurons in each hidden layers with three distinct percentage split of the KDD dataset, namely 6-40 percent split, 70-30 percent split and 80-20 percent split. According to the outcomes of their experiments, they concluded that the BPNN architecture with 4 hidden layers with neurons combination of 3-4-5-3, using 70-30% split of KDD dataset yields best results than others architectures. Moreover, the comparison of the proposed model with other related works, show that it performs better in terms of execution time and detection rate. However, the testing accuracy (97%) of the proposed model is less than the accuracy obtained by two works cited, namely, kuanf et al. [21] and Devaraju and Ramakrishnan [22]. Thus, the accuracy should be improved.
N. Lokeswari and B. Chakradhar Rao [12] have proposed an anomaly intrusion detection model based on artificial neural network classifier to detect intruders trying to enter into a system. They have chosen back propagation algorithm (BPN) as the learning algorithm for their artificial neural network of type multilayer perceptrons (MLP), and weight updating is done based on particle swarm optimization weight extraction algorithm (PSO WENN). To let the learning algorithm to operate faster and more efficiently, they have used a modified Kolmogorov–Smirnov correlation-based filter algorithm to select subset of 12 features which are useful in detecting the intrusion, and also data preprocessing and normalization are done to enable proper processing and analysis of the data. The experiments conducted by the authors show that the proposed NN classifier with PSO-based BPN algorithm gives good results than BPN used individually. However, false positive rates (FPR) of proposed model for U2R-Normal dataset (FPR: 9.85%) and R2L-Normal dataset (FPR: 11.34%) are still high. As well, the detection rates corresponding to those datasets, 88.46% and 88.79% respectively, need to be improved.
Kumar and Venugopalan [23] have developed a novel adaptive algorithm for network anomaly detection called “Adaptive Network Anomaly Detection Algorithm (ANADA)”. The proposed method uses the labeled dataset
for training but can adapt itself and can learn/get trained automatically from the changing traffic and therefore can detect unknown attacks. This adaptation is performed by modifying the training dataset with the new traffic/the test dataset; for each instance in test dataset, the algorithm decides whether the test data is worth being included/replaced with an instance of training data. The ANADA algorithm goes through two phases; namely the training phase and the testing phase. It was trained and tested with Kyoto University’s 2006+ Benchmark dataset. In the training phase, the training dataset is splited into two subsets according to the label of the records; namely normal dataset and attack dataset. Then, the algorithm finds the centroid of the attack class and normal class. Afterwards, in the testing phase, for each record in the testing dataset, the algorithm computes the distance between this record and the centroid of the attack/normal dataset using 0.8-norm. Thus, it is labeled as normal if it is closer to normal centroid than attack centroid, otherwise, it is labeled as an attack. After labeling the test data, the algorithm decides whether to replace the test data with the training data also by using the distance measure 0.8-norm. This is done by calculating the distance by using 0.8-norm between the test data and the attack/normal centroid and the ith (counter used for replacement) row of attack data and the centroid of the attack/normal. If the new test data is closer to the centroid than the ith data, then replace the ith data with the new one. The experiments conducted by the authors indicate that the proposed algorithm outperforms Naïve Bayes classifier. In fact, it exhibits a detection rate of 93.36%, an accuracy of 96.66%, and a false alarm rate of 1.59%. However, F-score obtained is relatively low in comparison to Naïve Bayes classifier.
rate of BPNN is 10.33%, and the training time average is 60.24 s. However, the error rate remains relatively high and other important performance measurement was not used as to say the detection rate.
Saljoughi et al. [25] have presented a network intrusion detection system (NIDS) for Cloud environment using Multilayer Perceptron Neural Network (MLP) and Particle Swarm Optimization Algorithm (PSO) to detect intrusions and attacks. The PSO algorithm was utilized to find the best weights and biases of the neural network (MLP), which is then trained by trained data and the obtained optimal weights. In order to have the most efficiency and security, the proposed NIDS is placed in the network, and it is connected directly to the router of the Cloud, and the others similar NIDS are installed on the processing servers. All NIDS send attack incidents to a central server with a large storage space; and if necessary, this data will be used by the proposed system. The results obtained from optimization of the neural network using the Particle Swarm algorithm showed a substantial improvement in the function of the NIDS based on MLP, in terms of the precision of detecting attacks faced by the networks and reduction of time complexities.
Shukla and Maurya [2] have presented a framework for network anomaly detection using Shannon and Reyni entropy. Shannon entropy is used as measure of information and uncertainty; the Shannon entropies are calculated for features selected to measure the normal behavior of current network, whereas Renyi entropy is a measure for diversity, uncertainty or randomness of a system and it is applied on Shannon entropy vector to detect the attack in current network traffic. In the proposed work, open source Intrusion Detection System (IDS) Snort is used for collecting malicious data in network. Then, Snort alert has been processed for selecting the attributes from Snort alert file. Shannon Entropies are computed to analyze source IP address, source port address, destination IP address, destination port address, source IP threat, source port threat, destination IP threat, destination port threat and datagram length. Finally, Renyi cross Entropy approach is applied on Shannon entropy vector to detect network attack. If the value of Renyi cross Entropy calculated is greater than a threshold value (β) then network is under attack and the program generates the lists of source IP, destination IP, source Port and destination Port addresses with the respective threat value. Based on above generated lists the network administrator can block/unblock the traffic incoming/outgoing to IP addresses or Port addresses. Otherwise there is no attack in current network. With this framework about 90% of attacks are detected. However, the rest of attacks (10%) could not be detected.
In [26], an RNN-IDS (intrusion detection system using recurrent neural networks) was projected as a deep learning method to investigate the performance of binary and multi-class model multi-classifications on NSL-KDD dataset. Also, researchers in [26] investigated the effects of different number of neurons and learning rates of the RNN-IDS model. Moreover, the proposed method was compared with other techniques, such as Support Vector Machine (SVM), J48, Random Forest (RF), naïve Bayes, and Artificial Neural Network (ANN). Results showed that the RNN-IDS was a
suitable classification model with higher accuracy and lower false acceptance rate, and performed reasonably well for both binary and multi-class classification methods as compared to conventional approaches.
Tao Ma et al. [27] have proposed a novel approach called KDSVM, which utilized the K-mean clustering technique and advantage of feature learning with deep neural network (DNN) model and strong classifier of support vector machines (SVM), to detect network intrusions. KSVM algorithm consists of three phases. In the first phase, the training dataset is separated and clustered into k subsets based on the cluster centers of k-means algorithm in a bid to find more knowledge and patterns from similar clusters. In the second phase, the sub train datasets are trained by kth DNNs, the number k is the value of clusters, this take DNNs that have learned various characteristic of each cluster centers. In the third phase, testing dataset is distanced with Huffman function by the same cluster centers generated in the first phase, and then the sub testing datasets obtained are applied to detect intrusion attack type by completely trained per DNN which top layer used SVM classifier. Lastly, the outputs of every DNN are aggregated for the final results of intrusion detection classifiers. The experimental results show that the KDSVM outperforms SVM, BPNN, DBN-SVM and Bayes tree models in terms of detection accuracy and it has the lower error rate than these four methods. However, limitations of the KDSVM include the DNN parameters of weights and threshold of the every layer, and the SVM parameters that necessitate to be optimized by heuristic algorithms.
The proposed model goes through four phases. The first phase is the data pre-processing; firstly, some symbolic features are converted to numeric features, thereafter, the correlation-based feature selection is applied for selecting the prominent features in the dataset in order to reduce the number of features. The second phase is to train varied classifiers with the training set. In this phase, five classifiers including k-NN, C4.5, MLP, SVM, and LDA are adopted to build the weak classifiers. Each classifier is efficacious for detecting each type of intrusion. The third phase is to construct a strong classifier by Adaboost.M1. The final phase is to assess the performance of the resulted classifier. In the experiments conducted by the authors, UNB-CICT or network traffic dataset was employed for testing the performance of the proposed method. The results indicate that the proposed method can reach higher efficiency in every attack type detection. Moreover, the experiments with Phishing website dataset UNSW-NB 15 dataset NSL-KDD dataset and KDD Cup’99 dataset are also carried out, and the results demonstrate that the proposed model can achieve higher efficiency as well.
Bardamova et al. [30] have described a new method of constructing systems for detection network intrusion based on an effective fuzzy classifier. The proposed approach consists of using of the binary gravitational search algorithm for feature selection and the continuous binary gravitational search algorithm for tuning the parameters of the fuzzy classifier. The effectiveness of three developed fuzzy classifiers (classifier # 1 based on 30 features, classifier # 2 based on 27 features and classifier # 3 based on 12 features) was investigated using the KDD Cup 1999 data set.
Zhang et al. [31] have built an intrusion detection model based mainly on Elman neural network, which is optimized by using Mind Evolutionary Algorithm (MEA). Further, they have employed Genetic Algorithm (GA) in order to reduce the dimension of KDDCUP99_10% dataset used for training and testing the MEA-Elman network model. The proposed model goes through two stages. The first stage consists firstly of construction of an Elman neural network composed of four layers: input layer that contains 41 nodes corresponding to the 41 features of KDDCUP99_10% dataset, ten hidden layers, one context layer and one output layer of five nodes (Normal, Probe, DOS, U2R and R2L) . Thereafter, MEA is used to optimize the initial weights and thresholds of this network. Evaluation of the MEA-Elman network model built in the first stage highlights that it has a high accuracy of Normal, Probe and DOS classification of more than 90%, but the accuracy of the U2R and R2L classification is too low. To address this issue, the GA was used in the second stage as a data processing algorithm with the goal of reducing dimension of the dataset used by the proposed IDS model based MEA-Elman network. That may help to improve the accuracy of U2R and R2L classification. At the end of GA process, the MEA-Elman model is rebuilt using the subset of relevant features among the 41 features of KDDCUP99_10% dataset. Indeed, the experimental results show that the detection accuracy of U2R and R2L has been greatly improved by using the GA algorithm. However, detection accuracy of Normal, Probe and DOS has decreased slightly in comparison the obtained results following the evaluation of the system before application of GA, but it still
keeps around 90%. The average accuracy of the proposed system is 77.82%. Thus, it need to be improved.
3.
Preliminaries
This section provides the necessary background to understand the problem in hand. First subsection shed the light on BPNN and the importance of Learning rate and Momentum term parameters for this neural network. Second subsection presents Simulated Annealing Algorithm (SAA). As mentioned previously, ISAGA used in this work is a variant of standard Genetic Algorithm (GA), which is developed based on GA, improved through an Adaptive Mutation Algorithm (AMA) and optimization strategies. Hence, the third subsection describes the operation of a standard GA, followed by a succinct presentation of Adaptive Genetic Algorithms, especially AMA. Finally, the last subsection introduces and explains the role of the optimization strategies applied to ISAGA, namely Parallel Processing and Fitness Value Hashing.
3.1 Back propagation neural network (BPNN)
Researchers have found that the human ability of thinking, reasoning and learning can be imitated to some extent by computer [34]. Neural network has the ability to imitate some behavior of human brain. Fish in [34] also pointed out that “neural network is capable enough of approximate matching”, where incomplete patterns could be recognized also. Neural network is composed of nodes, which are processing elements called “artificial neurons” and some weighted connections between them. These nodes operate independently. BPNN is a special type of neural network [20]. It is also named error back propagation neural network, and it is a feed forward neural network which uses Multi-layer Perception (MLP) as network architecture and Back Propagation Learning Algorithm as training or learning algorithm. BPNN is widely used in the current pattern recognition, mapping tasks, process control, image processing and analysis, mechanical fault diagnosis, expert systems and other relative fields [11, 35].
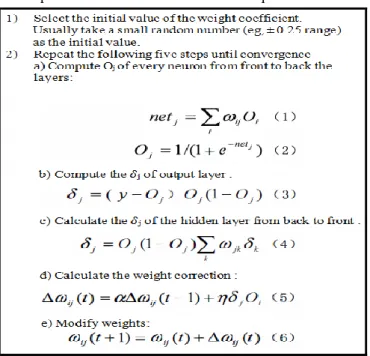
BPNN as supervised machine learning technique is composed of the two successive stages; the learning stage and the testing stage. During the first stage, the network is learned by modification of the weights. During the second stage, the weights from learning stage are used to forecast the class label of the new input patterns [14]. As shown in figure 1, the learning process of BPNN can be divided into two parts: the forward propagation process and the error back propagation process. During the former one, the output of each neuron is based on the output values and corresponding weights of all the neurons in the previous layer, the bias factor and the activation function. During the back propagation process, based on the forward propagation, the result of the calculation is compared with the expected result then inverses the error and correct the weights and bias [11, 24].
Every set of forward and backward operations are termed as single ‘Epoch’. For every epoch, a fresh set of patterns is given to the network as inputs. The network is trained in this way with a training set for certain number of epochs. After the training phase, the network is capable of identifying the unknown pattern according to its training [36]. Several research papers have used neural network approach [11, 16].
According to survey in [18], BPNN has good detection rate as compared to other neural network techniques.
Figure 1. Operation of BPNN learning process
3.1.1 Role of Learning Rate and Momentum term in Learning phase of BPNN
As it is shown in figure 1, to adjust the weights of connections between neurons in neural network, Back Propagation Learning Algorithm uses equations (5) and (6). In those equations, this algorithm uses two prominent and crucial parameters namely Learning rate and Momentum term [17].
• Learning rate (η): The learning rate is a relatively small constant that indicates the relative modification in weights. If the learning rate is too low, the network will learn very slowly, and if the learning rate is too high, the network may oscillate around minimum point, overshooting the lowest point with each weight adjustment, but never actually reaching it. Habitually, the learning rate is very small, located in the interval [0; 1].
• Momentum term (α): The introduction of the momentum
term is used to accelerate the learning process by "encouraging" the weight changes to continue in the same direction with larger steps. Furthermore, the momentum term prevents the learning process from settling in a local minimum by "over stepping" the small "hill". Typically, the momentum term has a value between 0 and 1 [17, 37]. 3.2 Simulated annealing algorithm
themselves randomly. In the ground state, the particles are arranged in a highly structured lattice and the energy of the system is minimal. The ground state of the solid is obtained only if the maximum temperature is sufficiently high and the cooling is performed sufficiently slow. Otherwise, the solid will be frozen into a metastable state rather than into the ground state.
3.3 Genetic algorithm
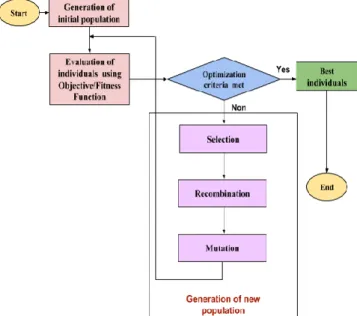
John Holland [17] in 1970 has introduced familiar problem solving algorithms called Genetic Algorithms (GAs) which are based on the principles of biological development, natural selection and genetic recombination. GAs are computational intelligence techniques and search procedures often used for optimization problems. A potential solution to the problem is encoded in chromosome (each chromosome represents an individual) like data structure. Each parameter in a chromosome is called as gene. Genes are selected according to our problem definition. These are encoded on bits, character or numbers. The set of generated chromosomes is called a population [39]. An evaluation function is used to calculate the goodness of each chromosome according to the desired solution; this function is known as “Fitness Function”. As shown by figure 2, from one generation to the next, GA evolves the group of chromosomes to a new population of quality individuals through selection, crossover (recombination to produce new chromosomes) and mutation operators until a global optimum solution is found at the end of GA process (convergence).
Figure 2. Flow of Genetic Algorithm
3.4 Adaptive genetic algorithms : adaptive
mutation algorithm
Adaptive Genetic Algorithms (AGA) [17, 19] are a popular subset of genetic algorithms, which can provide significant performance improvements over standard implementations when utilized in the suitable circumstances. A key factor that determines how well a genetic algorithm (GA) will perform is the manner in which its parameters are configured. Thus, finding the right values for the mutation rate and crossover rate plays in substantial role when building an efficient and effective GA. Typically, configuring the parameters will
require some trial and error, together with some intuition, before eventually attaining a satisfactory configuration. AGA are useful because they can help in the tuning of these parameters automatically by adjusting them based on the state of the algorithm. These parameter adjustments take place while GA is running, hopefully resulting in the best parameters being used at any specific time during execution. It is this continuous adaptive adjustment of GA parameters that will often result in its performance improvement. AGA used in this work uses information such as the average population fitness and the population’s current best fitness to calculate and update its parameters in a way that best suits its present state. For example, by comparing any specific individual to the current fittest individual in the population, it’s possible to gauge how well that individual is performing in relation to the current best. Typically, we want to augment the chance of preserving individuals that are performing well and reduce the chance of preserving individuals that don’t perform well. One way we can do this is by allowing the algorithm to adaptively update the mutation rate. We can determine if the algorithm has started to converge by calculating the difference between the current best fitness and the average population fitness. When the average population fitness is close to the current best fitness, we know the population has started to converge around a small area of the search space. When calculating what the mutation rate should be for any given individual, two of the most important factors/characteristics to consider are how well the current individual is performing and how well the entire population is performing as a whole. The algorithm we had used in this work to assess these two characteristics and update the mutation rate is called Adaptive Mutation Algorithm, and it is defined as follows:
P
m=
(
F
max−
F
i)/(
F
max−
F
avg),
F
i
F
vg (1)P
m=
m F
,
F
avg (2)When the individual’s fitness is higher than the population’s average fitness, we take the best fitness from the population (Fmax) and find the difference between the current individual fitness (Fi). We then find the difference between the max population fitness (Fmax) and the average population fitness (Favg) and divide the two values as shown by (1). We can use this value to scale our mutation rate that was set during initialization. As indicated by (2), if the individual’s fitness is the same or less than the population’s average fitness, we simply use the mutation rate as set during initialization. Adaptive genetic algorithm can be employed to adjust more than just the mutation rate however. Similar technique can be applied to adjust other parameters of the genetic algorithm like the crossover rate to get further improvements as needed. 3.5 Optimization strategies for genetic algorithm
3.5.1 Parallel Processing
One of the easiest approaches to achieve a performance enhancement of GA is by optimizing the fitness function. The fitness function is typically the most computationally expensive component; and it is often going to be the bottleneck of GA. This makes it an ideal candidate for multi-core optimization. By using multiple multi-cores, it is possible to compute the fitness of numerous individuals simultaneously, which makes a tremendous difference when there are often hundreds of individuals to evaluate per population. Java 8 provides some very useful libraries that make supporting parallel processing in our GA much easier. Using Java’s IntStream, we can implement parallel processing in our fitness function without worrying about the fine details of parallel processing (such as the number of cores we need to support); it will instead create an optimal number of threads depending on the number of cores available in our multi-core system. Hence, by using parallel processing, fitness function will be able to run across multiple cores of the computer, consequently, it is possible to considerably reduce the amount of time the GA spends evaluating individuals and, so reduce the overall time of execution of GA, and accelerate convergence process [9, 19].
3.5.2 Fitness Value Hashing
Fitness Value Hashing is another strategy that can reduce the amount of time spent computing fitness values by storing previously calculated fitness values in a hash table [19]. During running of GA, solutions found previously will occasionally be revisited due to the random mutations and recombinations of individuals. This occasional revisiting of solutions becomes more common as GA converges and begins to find solutions in an increasingly smaller area of the search space. Each time a solution is revisited its fitness value needs to be recalculated, wasting processing power on recurrent, duplicate computations. Luckily, this can be easily fixed by storing fitness values in a hash table after they have been computed. When a previously visited solution is revisited, its fitness value can be retrieved from the hash table, avoiding the need to recalculate it [9].
4.
The Proposed System
This section provides an overview of our previous IDS, describes in detail our new proposed IDS and gives the model of that IDS.
4.1 Overview of our previous IDS
In our previous work [11], we have built an effective Anomaly Network Intrusion Detection System (ANIDS) based on Back Propagation Neural Network (BPNN), which yields higher accuracy, higher detection rate and lower false positive rate in comparison to several traditional and new techniques as demonstrated by experimental results obtained by using KDD Cup’99 dataset. The two keys of our success were; firstly, we have adopted a novel architecture of neural network, which is given by a new technique of calculating the number of nodes in hidden layer of BPNN (H = 0.75 * Input + Output). Regarding our experiments conducted, this method has outperformed both two rules of Thumb and Arithmetic mean approaches. Secondly, we have adopted an efficient methodology to select an optimal set of the most relevant
values of the parameters which are included in construction of BPNN classifier or impacting its performance. Those parameters are; the number of selected features/attributes, normalization of data, architecture of neural network specifically the number of nodes in the hidden layer, activation function, Learning rate and Momentum term. Except for Learning rate and Momentum term which are fixed at 0.01 value, for each parameter cited beforehand, we have chosen between two and four values that are used in other works and have yielded good results in term of intrusion detection. Searching of optimal values of both Learning Rate and Momentum is the focus of our current work.
Table 1. Parameters values and performance of our best previous ANIDS [11]
Value
P
a
ra
m
eters
Number of attributes 12 ( Feature Selection Algorithm : A modified Kolmogorov–Smirnov Correlation Based Filter)
Normalization Min-Max
Architecture (I-H-O) 12-10-1
Method of calculating number of nodes in hidden layer
H = 0.75*Input + Output
Activation Function Sigmoid
P
erfo
rm
a
nce
Me
tr
ics
Accuracy 98.66%
Precision 99.62%
FPR 1.13%
FNR 1.41%
TPR (DR) 98.59%
TNR 98.87%
F-score 0.99
AUC 98.73%
Our precedent approach [11] was consisted of generating all possible combinations of these values (except for Learning rate and Momentum term) and then building the IDSs corresponding to each combination. Afterwards, we have compared the performance of the IDSs constructed by means of various performance measurements like accuracy, detection rate, F-score, false positive rate, AUC (ability to avoid false classification) etc., and selected the two best among them. Our preceding experiments were conducted on KDD CUP’99 and the results indicate that, compared to several traditional and recent techniques, the proposed approach achieves higher detection rate, higher accuracy, higher F-score and lower false positive rate. The best IDS obtained in our previous work have the characteristics shown in table 1.
4.2 The Approach of our novel proposed system
hybrid machine learning framework of optimization based on Improved Self-Adaptive Genetic Algorithm (ISAGA) and Simulated Annealing Algorithm (SAA). The purpose of this framework is looking for the optimal or near optimal values of Learning rate and Momentum term parameters, which affect the performance of that classifier. In fact, the Learning rate and the Momentum term are two prominent parameters in the learning phase of BPNN, which influence the convergence and performance of that classifier. Since their values are between 0 and 1, we thought to use “ISAGASAA” (ISAGA & SAA) in order to find the optimal or near-optimal values of those parameters in the interval [0;1], which is a large space of real numbers.
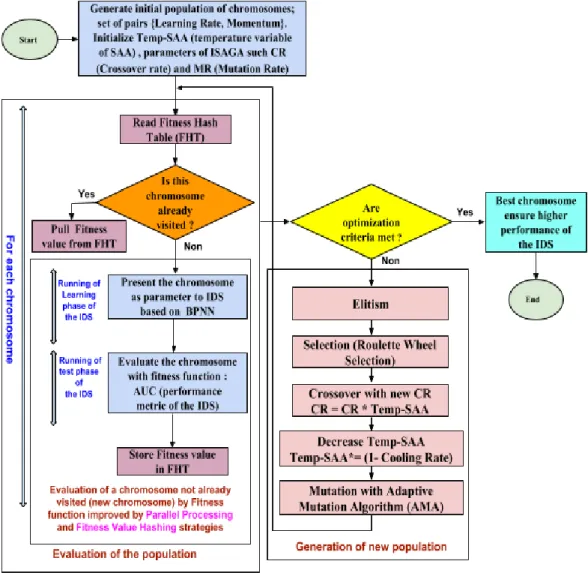
As shown in figure 10, illustrated our approach, ISAGA process begins with a randomly generated population of individuals (potential solutions) represented by their chromosomes; each chromosome takes the form of a pair of values (Learning rate, Momentum). Later, this population evolves through several generations by means of genetic operations such elitism, selection, recombination (crossover) and self-adaptive mutation through adaptive mutation algorithm (AMA) until stopping or optimization criteria of ISAGA is met. At each generation, for each chromosome, the Fitness Hash Table (FHT) is checked to verify if this chromosome is already visited, in this case, its fitness value is pulled from FHT. Otherwise, this chromosome (chromosome = pair (Learning rate, Momentum)) is evaluated by passing it as parameter to ANIDS obtained in our precedent work [11], after using Min-Max normalization to convert the two substrings representing Learning rate and Momentum term into values between 0 and 1. This IDS firstly goes through the learning phase, started with random initial weights that will be adjusted by means of Back Propagation Learning Algorithm during this phase. Thereafter, it passes to the test/evaluation phase and returns the values of performance metrics calculated at the end of the last phase (test). Among those performance metrics, we select the pertinent of them, namely AUC metric to serve as “Fitness Function” for evaluation of goodness of chromosomes, and the AUC value (fitness value) is stored in FHT. From one generation to the next, ISAGA converges towards the global optimum through genetic operations mentioned earlier. At last, the best individual (chromosome) is picked out as the result once the optimization criterion is met. In our work, termination condition adopted for ISAGA is production of 200 generations. Thereby, the best chromosome obtained corresponds to the optimal or near-optimal values of the pair (Learning rate, Momentum), which ensuring high detection rate and low false alarm rate.
For successful use of ISAGA, two key elements must be well defined; the representation/encoding of chromosomes and the Fitness Function [1].
• Chromosome encoding/representation: In our study as
indicated by figure 3, we have chosen the binary representation for chromosomes. At the beginning of ISAGA process, when the initial population of individuals was created, 100 binary strings of length 40 bits representing the chromosomes are generated randomly. Afterwards, each string is divided into two substrings of 20 bits [1]. The first binary substring is then converted in decimal value, and this value is normalized
using the Min Max normalization to get a value between 0 and 1, which will serve as the Learning rate of our IDS. Similarly, the foregoing approach is applied to the second binary substring to obtain Momentum term of our IDS, with a value within the interval [0;1].
• Fitness Function or Evaluation Function: Among the
values returned by the IDS at the end of the test/evaluation phase, we have chosen the AUC metric as a score (fitness function) of individuals to assess their adaptability to the optimization problem. The AUC [40] metric is by definition the ability to avoid misclassifications of network packets, and from our point of view, it represents a good trade-off between the DR (Detection Rate) metric and the FPR (False Positive Rate) metric [1]. In effect, this is due to the fact that AUC is the arithmetic mean of the DR and TNR (1-FPR) as shown by (3).
UC =
(
DR +TNR)
=(
DR + 1 - FPR(
)
)
2 2
A (3)
As it is known, a good IDS is one that achieves a high detection rate (DR) and a low false positive rate (FPR). In fact, as the value of the DR metric increases and that of FPR measure decreases, consequently, the value of AUC augments. Therefore, from our point of view, AUC is the best metric for evaluating an IDS [11]. That is the reason of choice of AUC as fitness function.
Figure 3. Structure of ISAGA chromosome
In our optimization framework based on ISAGASAA, ISAGA uses the following algorithms/methods:
• Elitism;
• Roulette Wheel Selection; • Single point Crossover; • Bit flip mutation;
• Adaptive Mutation Algorithm.
4.3 Role of simulated annealing algorithm in the proposed system
The aim [9] of using Simulated Annealing Algorithm in our framework of optimization is to optimize Improved Self-Adaptive Genetic Algorithm (ISAGA) process. Simulated Annealing Algorithm is a hill climbing algorithm that initially accepts worse solutions at a high rate, then as the algorithm runs, it gradually reduces the rate in which worse solutions are accepted. One of the easiest methods to implement this characteristic into a genetic algorithm is by updating the crossover rate to start with a high rate then gradually decrease the rate of crossover as the algorithm progresses. This initial high crossover rate will drive ISAGA to search a large area of the search space. Thereafter, as the crossover rate is slowly reduced, ISAGA should begin to focus its search on areas of the search space where fitness values are higher.
cooling technique is directly inspired by the process of annealing found in metallurgy. At the end of each iteration/generation of ISAGA, the temperature is cooled slightly, which decreases the crossover rate that will be used in the next generation of ISAGA [9, 19].
4.4 Framework of optimized ANIDS based on BPNN-ISAGASAA
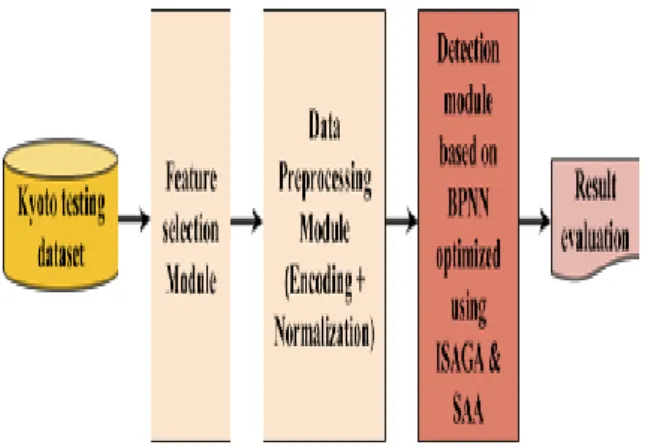
Our optimized ANIDS (ANIDS BPNN-ISAGASAA) passes firstly through an optimization stage in order to be optimized [17]. Consequently, it becomes ready to operate in operation/normal mode. The framework of our system in optimization mode consists of four modules as illustrated in figure 4.
Figure 4. Framework of optimized ANIDS based on
BPNN-ISAGASAA in optimization stage
• Feature selection module: Feature selection is the most
critical stage in building intrusion detection models. Our intrusion detection model incorporates a feature selection module mainly to select useful features for intrusion detection. This module allows selection of a set of 14 relevant features among 24 features of Kyoto 2006+ dataset (subsection 5.1) [17].
• Data Preprocessing module: After selection of
significant and relevant features for intrusion detection, raw data extracted from Kyoto 2006+ dataset version 2015 contained only those selected features, needs to be preprocessed before fed into our learning model and the most used technique is normalization. Normalization or Scaling refers to the process of scaling the feature values to a small range that can help to obtain better detection results and avoid numerical difficulties during the calculation. Our data-preprocessing module uses the mean range normalization for quantitative attributes, whereas the hybrid normalization using probability function is employed for qualitative attributes.
• Detection module based on BPNN and optimization
module based on ISAGA & SAA: In order to enhance the performance of the detection module based on BPNN, this module interacts with an optimization module based on ISAGA and SAA as explained in details in subsections 4.2 and 4.3 with the goal to search the optimal values of Learning rate and Momentum term. The period of optimization is called “optimization stage”. This period is achieved at the end of ISAGA process. Hence, the optimal values of Learning rate and Momentum term are found [17].
After passing through optimization phase and finding the optimal values of Learning rate and Momentum term, the optimized ANIDS (ANIDS BPNN-ISAGASAA) operates in operation/normal mode as shown in figure 5 to classify connection instances extracted from Kyoto test dataset.
Figure 5. Framework of optimized ANIDS based on
BPNN-ISAGASAA in operation/normal mode
5.
Dataset for Experimentation
In this study, the publicly available dataset Kyoto University Benchmark Dataset [41] is used for experimentation. The first subsection describes this dataset and presents the selected features representing connection instances in it. Afterwards, the following subsection provides normalization techniques applied for data preprocessing.
5.1 Kyoto university benchmark dataset
Kyoto 2006+ University Benchmark Dataset [41] is one of the most recently used intrusion detection dataset in the IDS domain [42]. It consists of real network traffic data originally gathered between November 2006 to December 2015 in Kyoto University. The Kyoto dataset is captured using honeypots, darknet sensors, email server and web crawler. Song et al in [43] provided a detailed analysis of honeypots (i.e. computer network security mechanisms which detect attempts of unauthorized use of information) and darknets data collected on many real and virtual machines as honeypots. They have deployed various types of honeypots, darknets and other systems on the five networks inside and outside of the Kyoto University, and collected all traffic data to and from 348 honeypots (Windows XP, Windows Server, Solaris…). All traffic was thoroughly inspected using three security software SNS7160 IDS, Clam AntiVirus, Ashula and since Apr. 2010, snort was added. This dataset was developed by [44] to solve the problems of underperformance of machine learning based IDS model trained and tested on KDD or NSL-KDD and any other related old datasets heavily criticized for not reflecting the current trend of network situation and sophistication of ever evolving cyber-attacks [45].
whether the record is an attack or normal, and excluded the features that can be used to investigate what kinds of attacks happened on computer networks [45]. Table 8 shows selected features used in our experiments. Label feature indicates whether the session was attack or not; ‘1’ means normal. ‘-1’ means attack was observed in the session. The data pertaining to date December 31, 2015 of Kyoto dataset is used for this study and this dataset has 309068 records, out of which 23062 are normal and the 286006 are attack data records.
5.2 Dataset data preprocessing
After selection of significant and relevant features for intrusion detection, raw data extracted from Kyoto 2006+ dataset version 2015 contained only those selected features needs to be preprocessed before fed into our learning model. The most used technique for data pre-processing is normalization [47]. Network traffic data contains features that are qualitative or quantitative nature and have to be handled differently. The attributes with high values can dominate the results than the attributes with lower values. This dominance can be reduced by the process of normalization, i.e., scaling the values within certain range. Normalization is defined as is the process of enclosing the values of attributes to a specific range to minimize the complexity involved in handling data spread over an absolute range and type values. Various features have values spread over large ranges and types. Hence, they are to be minimized to a specific range being useful to enable proper processing and analysis of the data [12]. Quantitative attributes can be directly normalized, whereas in case of qualitative attributes, the nominal values first needs to be converted to numeric value before applying the normalization. The numeric values can be assigned based on certain criteria or simply replacing every nominal value with 1, 2, 3…n. Once the qualitative attributes have been converted to quantitative attributes, the normalization process can be applied to them [48]. Normalization techniques such as mean-range normalization, frequency normalization, maximize normalization, rational normalization, ordinal normalization, statistical normalization [48, 49] and softmax scaling [50] can be applied directly to quantitative attributes, whereas they requires the qualitative data to be transformed firstly to quantitative attributes, while the hybrid normalization technique that will be discussed later in subsection 5.2.2 do not requires such transformation of qualitative attributes. In this study, for quantitative attributes, Min-Max normalization is used, whilst the hybrid normalization is employed for the qualitative data.
5.2.1 Min-Max Normalization
This approach is also known as Mean range [0, 1]. If we know the maximum and minimum value of a given attribute, it is easy to transform the attribute into a range of value [0, 1] by (2). Thereby, the mean range normalization normalizes an attribute value by subtracting minimum value of that attribute from the current value. This value is further divided by the difference maximum and minimum value of that attribute [48, 49].
X
'x
MinA
MaxA MinA
-=
- (4)
x
andx
'are value to be normalized and the normalized attribute value respectively. MinA and MaxA are the minimum and maximum possible values for attribute A before normalization.5.2.2 Hybrid Normalization
As discussed prior, qualitative attributes/features requires to be transformed to quantitative values before the normalization can be applied to them using one of the normalization techniques given in the subsection 5.2. A general method is to substitute qualitative values with quantitative/numeric values. In hybrid normalization, the probability function defined by (5) is used to normalize the qualitative attributes without need of such transformation to quantitative attributes; this technique is able to normalize directly qualitative attributes and scales those attributes between [0,1] . Suppose that X is a qualitative attribute define as a X= a, d, b, a, c, d, b, a, b, d, d, c , where N=12 and K=4. Using probability function fx(x).
f (x) = Pr(X = x) = Pr({s S : X(s) = x})x Î (5)
Based on probability function fx(x), the qualitative values are transformed to quantitative values within the range of [0-1].
fx(a)=3/12=0.25, fx(b)=3/12=0.25, fx(c)=2/12=0.16, fx (d)=4/12=0.33 [49].
The reason for choosing the mean range (for quantitative attributes) and probability function (for qualitative attributes) is because these normalization techniques yield better results in terms of time and classification rate [51]. Further, Data normalization improved the efficiency and the accuracy of mining algorithms including ANN’s. Where these algorithms provide better result when the data to be analyzed fall between [0, 1] [14]. There are two qualitative attributes, i.e., flag and service; and all the other 12 attributes are quantitative. The mean-range normalization (Min-Max normalization) is applied for quantitative attributes whereas hybrid normalization (probability function) is employed for qualitative attributes.
6.
Experimental Results and Analysis
This section is splited into two subsections; the first one describes the performance measurements used for evaluation and comparison of the original ANIDS based BPNN and our new optimized ANIDS based BPNN using IGASAA. Next, the second subsection gives an overview of our implementation, shows experimental results and analysis and finally provides a comparison of the performance between our new IDS and other related works.
6.1 Performance evaluation metrics
Besides, FN and FP rates reduce the effectiveness of IDS where FP reduce the capability of system in detection and FN will make the system susceptible to intrusion [14,52]. Therefore, for an IDS to be effective, the FP and FN rates should be minimized, and TP and TN rates to be maximized.
Table 2. Confusion matrix
Actual class Predicted class
Attack Normal
Attack True positive (TP) False negative (FN)
Normal False positive (FP) True negative (TN)
• True Positive (TP): Number of instances correctly
predicted as attacks.
• False Positive (FP): Number of instances wrongly
predicted as attacks.
• True Negative (TN): Number of instances correctly
predicted as non-attacks (normal instances).
• False Negative (FN): Number of instances wrongly
predicted as non-attacks [53].
Based on confusion matrix shown in table 2 [23], to determine the performance of IDSs, the following metrics used for the numerical evaluation. These performance criteria are not dependent on the size of the training and testing samples and can be really helpful in assessing the performance of the ensemble model [54, 55]:
• Accuracy (ACC): Is the ratio of samples which are
correctly predicted as normal or attack to the overall number of samples in test set. Overall, it measures how often the classifier is correct and is calculated using equation 6.
𝐴𝑐𝑐𝑢𝑟𝑎𝑐𝑦(𝐴𝐶𝐶) = 𝑇𝑃+𝑇𝑁
𝑇𝑃+𝑇𝑁+𝐹𝑃+𝐹𝑁 (6)
• Detection Rate (DR)/Recall: Called also True Positive Rate (TPR) or Sensitivity. It is a performance metric which indicates the ratio of the number of samples that are correctly classified as attack to the total number of attack samples present in test set and is calculated using equation 7.
Detection Rate
(DR/ Recall)TP
TP
FN
=
+ (7)
• Precision: It indicates the percentage of intrusions that have occurred, and the IDS detects them correctly. It is calculated by the number of correctly classified positive (intrusion) examples divided by the number of examples labeled by the system as positive. It is calculated using equation 8.
Precision =
TP
TP + FP
(8)• True Negative Rate (TNR): Called also Specificity. Is
the ratio of the number of legitimate records detected as normal instances divided by total number of normal (legitimate) instances included in the test set. It is calculated using equation 9.
True Negative Rate (TNR) TN TN FP
=
+ (9)
• False Alarm Rate (FAR): Also known as False Positive
Rate (FPR) refers to the proportion of normal packets being falsely detected as malicious. In other way, it represents the ratio of samples which is improperly categorized as attack to the overall number of samples of normal behavior. If this value is consistently elevated, it causes the administrator to intentionally disregard the system warnings, which makes the system enter into a dangerous status. Thus, it should be as minimum as possible. The FPR value can be calculated by one minus TNR. FAR is obtained from equation 10.
False Alarm Rate FAR
( )FP
FP TN
=+ (10)
• False Negative Rate (FNR): Is the ratio of the number of attack instances detected as normal instances divided by total attack instances included in the test set. This term is used to describe a network intrusion device's inability to detect the true attack. The FNR value can be calculated by one minus TPR. FNR is obtained from equation 11.
False Negative Rate FNR
( )FN
FN
TP
=
+ (11)
• F-Score: Also called as F-measure. This is a statistical criterion to evaluate the performance of the systems. In fact, this criterion is a harmonic mean between metrics recall (true positive rate) and precision, which includes a range of values between 0 and 1. The higher value of F-score indicates that the IDS is performing better on recall and precision [56]. F-Score is obtained from the equation 12.
𝐹 − 𝑠𝑐𝑜𝑟𝑒 =2×𝑅𝑒 𝑐𝑎𝑙𝑙×𝑃𝑟𝑒𝑐𝑖𝑠𝑖𝑜𝑛
𝑅𝑒 𝑐𝑎𝑙𝑙+𝑃𝑟 𝑒𝑐𝑖𝑠𝑖𝑜𝑛 (12)
• AUC: Is ability to avoid false classification [40] and is calculated using equation 13.
(13)
6.2 Experimental results and analysis
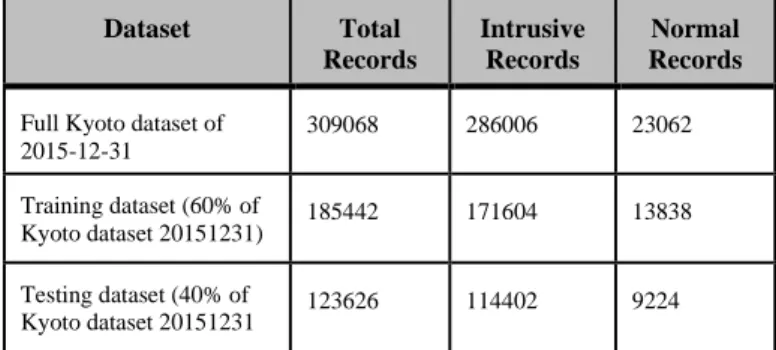
For experimental set up, we have used a computer with a Core-i7 2700K CPU and 16 GB of DDR3. As mentioned previously in section 5, the data pertaining to date December 31, 2015 of Kyoto dataset was used in this work.
Table 3. Distribution and size of training and testing datasets
Dataset Total Records
Intrusive Records
Normal Records
Full Kyoto dataset of 2015-12-31
309068 286006 23062
Training dataset (60% of
Kyoto dataset 20151231) 185442 171604 13838
Testing dataset (40% of
Kyoto dataset 20151231 123626 114402 9224
proposed framework of optimization based on IGASAA for our previous ANIDS based BPNN.
Table 4. Parameters of our framework of optimization based on ISAGA and SAA for our previous ANIDS
Components of the Framework
IGASAA
Parameters of Improved Genetic Algorithm
Value
Improved Self-Adaptive
Genetic Algorithm
(ISAGA)
Length of chromosomes 40 bits Elitism number: the number of best
chromosomes which will be copied without changes to a new population (next generation)
10
Population size 100
Maximum number of generations 200 Initial Crossover rate (Dynamic value) 0.95 Initial Mutation rate (Dynamic value) 0.1 Size of Fitness Hash Table (FHT) 1000
Simulated Annealing Algorithm
(SAA)
Initial Temperature (Dynamic value) 1.0
Cooling rate 0.001
Table 5. Configuration of our optimized IDS “ANIDS
BPNN-ISAGASAA”
Parameters Value
Number of attributes 14 ( selected features from Kyoto 2006 +)
Normalization Min-Max
Architecture (I-H-O) 14-12-1 Method of calculating number
of nodes in hidden layer H = 0.75*Input + Output Activation Function Sigmoid
Learning rate 9.478021496576301E-7
Momentum term 1.347983517208652E-4
Table 6 highlights the performances attained by our ANIDS BPNN-ISAGASAA. The evaluation of its performance was carried out based on the Kyoto testing dataset shown by the table 3, and by means of various metrics such accuracy, precision, detection rate, F-score, FPR and AUC.
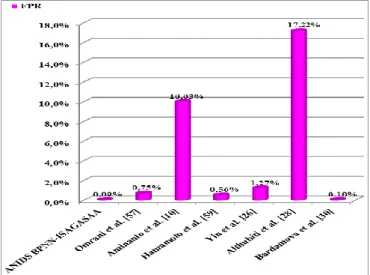
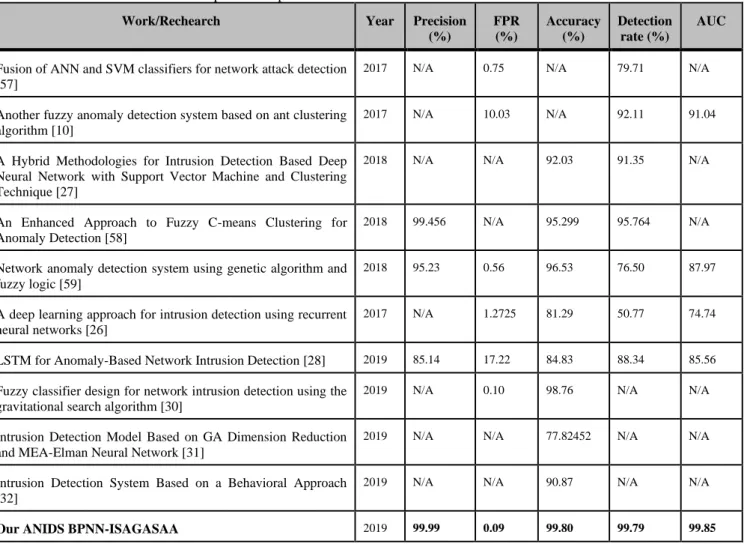
As demonstared by table 7, our ANIDS BPNN-ISAGASAA outperform the original ANIDS BPNN, the optimized ANIDS using only GA “ANIDS BPNN-GA” and the optimized ANIDS using GA & SAA “ANIDS GA-SAA” [1]. In addition, table 9 and figures 6-9 show that our IDS model yields best results that other state-of-art methods. Further, incorporating of optimization strategies to the fitness function of ISAGA, namely Parallel Processing and Fitness Value Hashing have brought several benefits. These advantages are: 85% reduction of execution time compared
to a standard GA, acceleration of the ISAGA convergence process and save processing power.
Table 6. Performances of our optimized IDS “ANIDS
BPNN-ISAGASAA”
Parameters Value
Accuracy 99.80%
Precision 99.99%
TPR (DR) 99.79%
F-score 0.99
False Positive Rate (FPR) 0.09%
AUC 99.85 %
Table 7. Comparison of performances of our novel ANIDS
BPNN-ISAGASAA and our previous IDSs
Performance Metric
IDS
ANIDS BPNN [11]
ANIDS
BPNN-GA
ANIDS BPNN-GASAA
[1]
Novel ANIDS BPNN-ISAGASAA
Accuracy 98.66% 98.82% 99.07% 99.80%
Precision 99.62% 99.96% 99.96% 99.99%
FPR 1.13% 0.11% 0.12% 0.09%
FNR 1.41% 1.54% 1.20% 0.21%
TPR (DR) 98.59% 98.46% 98.80% 99.79%
TNR 98.87% 99.89% 99.88% 99.91%
F-score 0.99 0.99 0.99 0.99
AUC 98.73% 99.18% 99.34% 99.85%
Figure 6. Comparison of Accuracy of our ANIDS
![Table 1. Parameters values and performance of our best previous ANIDS [11]](https://thumb-us.123doks.com/thumbv2/123dok_us/8122097.2154246/8.892.480.819.339.822/table-parameters-values-performance-best-previous-anids.webp)