http://www.sciencepublishinggroup.com/j/eas doi: 10.11648/j.eas.20170206.13
ISSN: 2575-2022 (Print); ISSN: 2575-1468 (Online)
A New Damage Model to Predict Orthotropic Nonlinear
Behavior of Woven Glass-Epoxy Composite
Mohammad Kashfi
1, *, Gholamhossein Majzoobi
1, Nicola Bonora
2, Gianluca Iannitti
2,
Andrew Ruggiero
2, Ehsan Khademi
31
Department of Mechanical Engineering, Bu-Ali Sina University, Hamedan, Iran
2Department of Civil and Mechanical Engineering, University of Cassino and Southern Lazio, Cassino, Italy 3Department of Robotics, Hamedan University of Technology, Hamedan, Iran
Email address:
[email protected] (M. Kashfi), [email protected] (M. Kashfi) *Corresponding author
To cite this article:
Mohammad Kashfi, Gholamhossein Majzoobi, Nicola Bonora, Gianluca Iannitti, Andrew Ruggiero, Ehsan Khademi. A New Damage Model to Predict Orthotropic Nonlinear Behavior of Woven Glass-Epoxy Composite. Engineering and Applied Sciences.
Vol. 2, No. 6, 2017, pp. 107-112. doi: 10.11648/j.eas.20170206.13
Received: June 8, 2017; Accepted: August 8, 2017; Published: January 12, 2018
Abstract:
In the present work a new damage model based on continuum damage mechanic was proposed to predict the nonlinear behavior of woven glass fiber composite under tensile test. The composite specimens were fabricated by hand lay-up method and they were put into a temperature and pressure controlled curing chamber. In order to perform the tensile test a universal Instron machine was used with the DIC method to measure the strain field during the tensile test. All orthotropic mechanical properties such as elasticity modulus, Poisson`s ratio and failure strain were calculated from experiment. After tensile test it was observed that the material behavior was brittle elastic however the stress-strain curve was exhibited a nonlinear fashion. The reason of nonlinearity assumed as irreversible damage effect during the test for instance initial void, fiber breakage, matrix cracking, delamination and fibers debonding. A new damage model with four physical meaning constants was proposed to predict the nonlinear behavior of the material. The model was implemented by a user subroutine in MSC MARC finite element software. Additionally the material damage constants were obtained from iterative numerical simulations. Moreover the damage parameters were optimized by Genetic Algorithm. In conclusion the damage model can predict the nonlinear behavior of composite in both warp and weft direction with reasonable agreement in comparing with experiment.Keywords:
Continuum Damage Mechanics, Woven Fiber Glass, Finite Element, Iterative Simulation, Orthotropic Behavior1. Introduction
The utilization of composites has grown over the years due to the superior physical and mechanical properties. Composite structures have a high strength-to-weight and stiffness-to-weight ratio, good fatigue and corrosive properties [1]. Damage is maybe the main mechanical phenomenon in composite materials. Therefore it has given rise to many studies. The classical theory of isotropic damage is not sufficient to deal with composite materials because for such materials damage is generally of a highly complex nature. For example. fibrous composite laminates are prone to a wide range of damage which may significantly reduce
that the damage modes in the fiber and shear directions were decoupled [5]. Mi et al. described a progressive failure criterion for the mixed-mode delamination of fiber reinforced composites, based on the cohesive interface element in conjunction with softening relationships between stresses and relative displacements. Fracture mechanics is indirectly introduced by relating the areas under the stress-relative displacement curves to the critical fracture energies [5].
In this paper, the CDM method has been employed to introduce a model to estimate the progressive failure of a composite laminate and predict the nonlinear behavior in tensile test. This method can predict the initiation, propagation, and final failure of composite structures effectively. Iterative numerical simulation was used to obtain the optimized value of damage parameters.
2. Material Fabrication
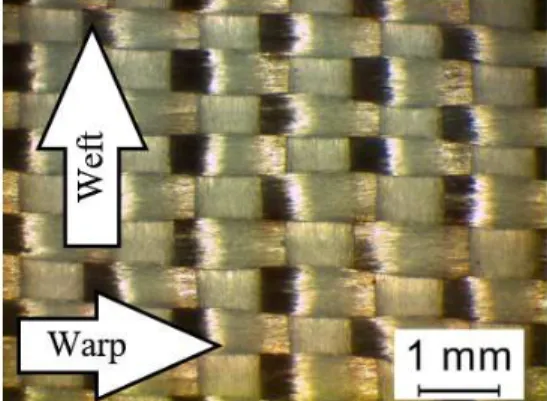
The materials used to fabricate the composite specimens were woven glass fiber (E-glass, 200 g/cm2) and epoxy resin (made by Huntsman Company). The woven form of E-glass
fiber is illustrated in Figure 1. Araldite LY 5052 and Aradur 5052 were used as the resin epoxy and the hardener, respectively. This type of epoxy resin is used in aerospace and industrial composites, tooling and aircraft repair. The epoxy enjoys many excellent properties such as low viscosity, high temperature resistance and excellent mechanical and dynamic properties after ambient cure [6].
Figure 1. Woven form of E-glass fiber.
Figure 2. Stress versus longitudinal and transverse strain in (a) 00 direction, (b) 90° direction.
Composite specimens were fabricated by hand lay-up method. Fabricated specimens were placed in a mold designed to press the layers together under a controlled pressure. The specimens were then moved to a curing chamber for heat treatment. The curing temperature and the time were 80°C and 8 hours, respectively as suggested by the epoxy manufacturer. The pressure level plays important role to decrease the voids and to remove the redundant resin.
3. Tensile Test on Glass Fiber Composite
The stress-strain curves of glass fiber composite layer were obtained in longitudinal and transverse directions. Figure 2
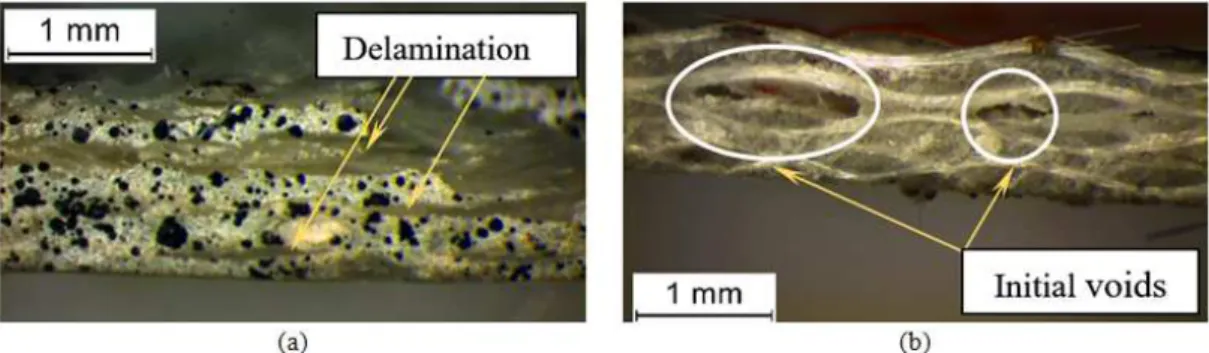
shows the results of five tensile tests on glass fiber composite in 0° and 90° directions. It is reasonable to assume a linear elastic model for the fiber as the composite material. Part of the damages occur due to delamination between each layer of composite, matrix failure and matrix and fiber debonding. Typical delamination of sub layer of composite layer during tensile test and some initial voids in matrix are illustrated in Figure 3.
direction can be explained by damage evolution during a tensile test [7]. Table 1 shows the summery of orthotropic properties of the glass fiber composite layer. E11 and E22 are the elasticity modulus in warp (longitudinal) and weft (lateral) directions of woven glass used to produce the glass fiber composite layer. The difference between the properties
along warp and weft directions which is the case in most of composites with woven fibers has been reported in the literature. DIC method was used to measure the true strain in the gauge length. Figure 4 shows the principals strains of the composite during tensile test.
Figure 3. (a) Delamination of each sub layer during tensile test (b) voids in composite layer.
Table 1. The orthotropic properties of glass fiber composite layer.
Mean Value STD DV
E11 GPa 13.47 1.20
E22 GPa 10.69 0.816
12
υ - 0.1017 0.0627
G12 GPa 1.83 0.13
Figure 4. Several snap shots of principal strains field in weft direction of composite layer.
4. Damage Model for Composite Layer
The behavior of the composite material was considered linear elastic as suggested by experimental stress-strain curve of the composite. Most of the damage models have been proposed only for 2D composite laminates. However, the few investigations of the damage evolution behavior in the 3D fiber reinforced composites, are accompanied by some limitations. Typical limitations are, (1) most of the adopted classical criteria were unable to accurately and effectively predict the initial damage; (2) the damage and failure modes were usually not described adequately [8]. The damage is defined as follows:
(
1)
0E= −D E (1)
Where E0, D and E are initial elasticity modulus, damage
parameter and the current elasticity modulus of the composite, respectively. The Hook law is given by:
0
E
σ = ε (2)
th cr f th D D β ε ε ε ε − = −
(3)
Where Dcr is the critical damage,
ε
th is the thresholdstrain,
ε
f is the failure strain andβ
is the damage exponentand can be obtained by experiment.
5. Finite Element Simulation
The numerical simulations were performed using the commercial finite element code, MSC MARC. Because of the symmetry condition, only 1/8 of the model was simulated. The numerical model consisted of 1935 elements for composite layer. This number of elements proved to be adequate to achieve convergence in the simulations. To implement the proposed damage model with optimized constants the user subroutine unlcdm was used.
By assuming the power law model defined by equation (3) for damage evolution and using an optimization technique to find the material constants of the model, two sets of damage parameters were obtained. For optimization the average of five experimental force-displacement curves was used as the target value and RMS (Root Mean Square) of the difference between the experimental and finite element model was adopted as the error. Genetic algorithm was used to minimize the error and the material constants were computed. For simulation of the assumed damage model for composite the power model (Eq. (3)) was incorporated in a subroutine called unlcdm. The subroutine was used to predict the stiffness variation during loading.
In the Bonora damage model, the damage of material is characterized only by reduction of Young modulus (DE).
The user subroutine, unlcdm, provides users with a mechanism to extending the Bonora damage model by defining two parameters instead of one. The unlcdm user subroutine is used in conjunction with the DAMAGE model definition option. The stress and elasticity in damaged material are defined by [9]:
(
)
(
)
( )(
)
, , 1
1
D p p
y y s
D
E
T D
E E T D
σ =σ ε ε −
= −
ɺ
(4)
Where
σ
Dy is the damage affected yield stress, σy is theinitial yield stress, Ds is the damage parameter controlling
the yield stress, ED is the damage affected Young modulus, E is the initial Young modulus and DE is the damage parameter
controlling the Young modulus during loading and unloading. In subroutine unlcdm, the damage can be characterized by reduction of the yield stress using Ds. Therefore, users have
option to combine the effect of damage on Young modulus and yield stress. It is also possible for users to enforce the effect of loading mode (compressive or tension) on material degradation. For example, in case of compression, the Young modulus of the material can be restored to its initial level as damage doesn’t grow by compression. It is obvious that the accumulated damage variable has to be calculated and stored using a user-defined or state variable [10].
6. Result and Discussion
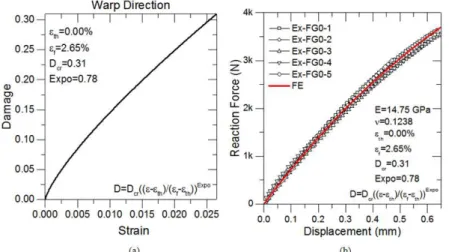
Figure 5(b) shows a comparison between FE and five experimental results in warp direction. The FE curve was obtained for the optimums of damage parameter identified by Genetic algorithm. Damage evolution for warp direction is shown in Figure 5(a). As the figure suggests, damage begins evoluting exactly at the onset of loading. This implies that some voids or damages pre-exist in the composite layer.
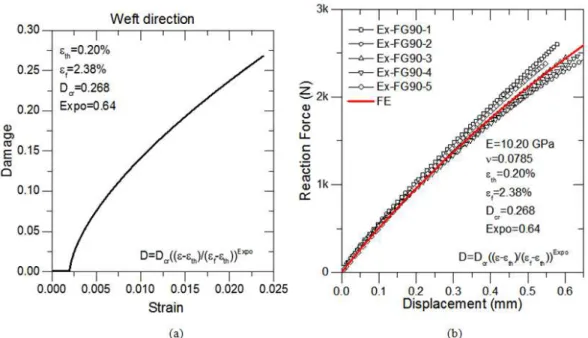
Figure 6 illustrates the experimental force-displacement curve, the FE numerical results and damage evolution in weft direction. As Figure 6(b) indicates, damage evolution in weft direction starts at the threshold strain of 0.2%. The difference between the onset of damage evolution in warp and weft directions is due to configuration of warp and weft yarn in texture of glass fiber layer. In warp direction yarns have wavy shape as they cross the top and the beneath surfaces of the weft alternatively. Another important point is that the fiber fractions in the two directions of weft and warp are different. These differences bring about the difference between the elasticity modulus in each direction.
Figure 6. (a) Damage vs. strain in weft direction (b) Comparison between FE and five experimental results in weft direction.
Damage evolution in warp and weft directions are shown in Figure 7. As the figure indicates, except for small strains, the two curves nearly coincide. Therefore, for simplicity, the average of damage evolution in weft and warp directions was considered in the simulations. The damage parameters for each direction and their averages are listed in Table 2.
Figure 7. Damage vs. strain for warp, weft and mean of warp and weft.
Table 2. Damage parameter for warp, weft and AVG.
Warp Weft AVG
th
ε 0.000 0.002 0.001
f
ε 0.0265 0.0238 0.02515
Dcr 0.31 0.268 0.289
β 0.78 0.64 0.71
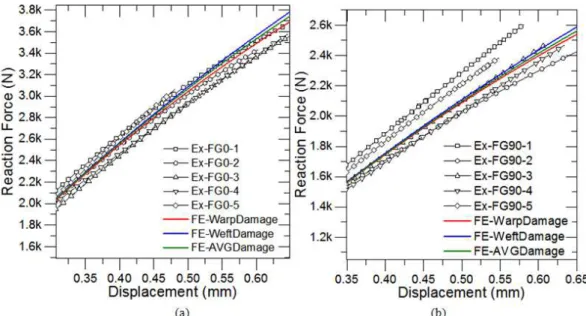
Figure 8 shows the numerical and experimental force-displacement curves in warp and weft directions. The numerical curves were obtained by considering three sets of
damage parameters given in Table 2. As the figure indicates, the difference between the curves for warp, weft directions and the average of damage is negligible. Therefore, only the average of damage was considered in the simulations. This implies that although the composite layer has orthotropic behavior in reality, the damage evolution is assumed isotropic in the layer
7. Conclusion
The behavior of woven glass fiber composite was investigated by numerical simulation and experiment in this study. The constants of the relation were calculated by optimization. In order to find the Elasticity modulus and the Poison’s ratio of the metal layer as accurate as possible virtual clip gauge and DIC technique were used to obtain the strain distribution in both longitudinal and lateral directions.
The composite layer was tested in three directions to obtain its orthotropic properties such as elasticity, shear modulus and Poison’s ratio. Damage parameters were determined for warp and weft direction and were updated later using high and low fiber fraction specimens cut out from the FML specimens. Based on the observations made in this work, the following conclusions may be derived:
a. Based on the experimental results, woven glass fibers do not exhibit linear elastic behavior until the failure strain of the fibers. The reason is that the warp and weft of specimens can be tightened during the process of tensile test. This behavior can increase the chance of delamination.
Figure 8. Reaction force vs. displacement of FE (by considering warp, weft and AVG damage parameters) and experimental result in (a) warp and (b) weft directions.
References
[1] Edlund U, Volgers P. A composite ply failure model based on continuum damage mechanics. Composite Structures. 2004; 65 (3–4): 347-55.
[2] Allix O, Ladevèze P, Gilletta D, Ohayon R. A damage prediction method for composite structures. International Journal for Numerical Methods in Engineering. 1989; 27 (2): 271-83.
[3] Sevkat E, Liaw B, Delale F, Raju BB. Drop-weight impact of plain-woven hybrid glass–graphite/toughened epoxy composites. Composites Part A: Applied Science and Manufacturing. 2009; 40 (8): 1090-110.
[4] Bouvet C, Castanié B, Bizeul M, Barrau J-J. Low velocity impact modelling in laminate composite panels with discrete interface elements. International Journal of Solids and Structures. 2009; 46 (14): 2809-21.
[5] Mi Y, Crisfield M, Davies G, Hellweg H. Progressive delamination using interface elements. Journal of composite materials. 1998; 32 (14): 1246-72.
[6] Araldite LY 5052 + Aradur 5052.
http://www.nedform.com/magento/en/araldite-ly-5052-aradur-5052.html.
[7] Lemaitre J, Desmorat R. Engineering damage mechanics: ductile, creep, fatigue and brittle failures: Springer Science & Business Media; 2005.
[8] Zhong S, Guo L, liu G, Lu H, Zeng T. A continuum damage model for three-dimensional woven composites and finite element implementation. Composite Structures. 2015;128:1-9. [9] Bonora N. A nonlinear CDM model for ductile failure.
Engineering Fracture Mechanics. 1997; 58 (1–2): 11-28. [10] User Subroutines and Special Routines. In: Corporation MS,