Lucrări ştiinţifice Zootehnie şi Biotehnologii, vol. 42(1) (2009), Timişoara
CONFIDENCE LEVELS AND/VS. STATISTICAL
HYPOTHESIS TESTING IN STATISTICAL ANALYSIS. CASE
STUDY.
INTERVALELE DE ÎNCREDERE
Ş
I/VS. TESTAREA
IPOTEZELOR STATISTICE ÎN ANALIZA STATISTIC
Ă
.
STUDIU DE CAZ.
ILEANA BRUDIU
USAMVB Timisoara, Department of Exact Sciences, România, [email protected]
Estimated parameters with confidence intervals and testing statistical assumptions used in statistical analysis to obtain conclusions on research from a sample extracted from the population. Paper to the case study presented aims to highlight the importance of volume of sample taken in the study and how this reflects on the results obtained when using confidence intervals and testing for pregnant. If statistical testing hypotheses not only give an answer "yes" or "no" to some questions of statistical estimation using statistical confidence intervals provides more information than a test statistic, show high degree of uncertainty arising from small samples and findings build in the "marginally significant" or "almost significant (p very close to 0.05).
Keywords: confidence interval, significance testing, the sample volume.
Introduction
Estimate parameters and testing hypotheses is the two sides of inferential statistics. Both allow the use of information obtained from a sample chosen at random to obtain conclusions on the values of the parameters that characterize the population. Estimate shows the most likely position of the parameter.
Point
estimate as a result gives us a single point which is most likely
representative of the parameter, and estimating the range offers a range that
is likely to take calculated.
Most often used in the estimation of confidence intervals because they are associated with a probability that indicates how much of their value is correct. A condition of a correct estimate is low variability between samples, called variant minimum.methods assume that the sample has been properly selected. If statistical significance testing is essential to clarify the power test. It consists in determining how extensive should be a sample to detect a difference of some magnitude.
When we use the confidence and when testing statistical significance in a statistical study - or which one it is more useful and more indicative of the presentation of research findings of the research.
Materials and Methods
In the proposed research were taken in the study five samples "large", the feature being tracked quantitative variable measured on the scale interval/report is the average temperature at the ground in five consecutive years (2003-2007), in the same area.
Following descriptive statistical calculations is a large variability observed data, but taking into account the central limit theorem and the fact that samples are "high", the standard error of the mean allows a calculation to estimate the average temperature within a relatively limited.
Table 1 Values for descriptive statistics
T ° C average air
2003 2004 2005 2006 2007
Mean 11.041 11.129 10.492 11.196 12.448 Standard Error 0.539 0.455 0.489 0.474 0.444 Standard Deviation 10.295 8.698 9.335 9.061 8.487
Count 365 366 365 365 365
Confidence Level(95.0%) 1.0597 0.8941 0.9609 0.9327 0.8736
The values obtained for the upper and lower limits of confidence intervals are presented in Table 2 and the graphical representation of these intervals in Fig.1
Table 2 Values for upper and lower limits the confidence intervals
T ° C average air
2003 2004 2005 2006 2007
Lower limit 9.98 10.24 9.53 10.26 11.57 Media 11.04 11.13 10.49 11.20 12.45 Upper limit. 12.10 12.02 11.45 12.13 13.32
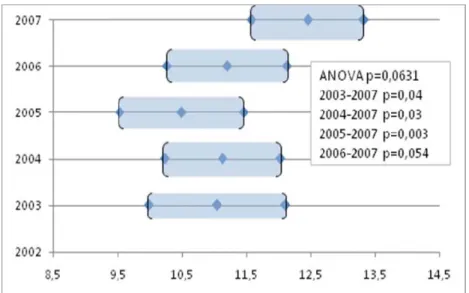
Fig 1. N = 365 observations, confidence intervals for the average levels of significance obtained
Was also conducted testing of significance between each of the five samples, achieving p values for the threshold of significance. They are presented in Table. 3
Table No.3 Probabilities obtained for
test of significance
p 2004 2005 2006 2007
2003 0.901 0.450 0.829 0.044
2004 0.340 0.919 0.038
2005 0.301 0.003
2006 0.054
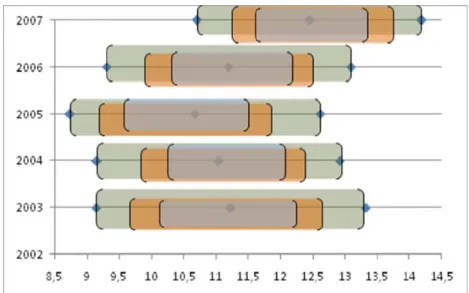
Fig 2. N = 183 observations, confidence intervals for the average significance levels obtained
Fig 3. N = 93 observations. Confidence intervals for the average significance levels obtained
overlap, and the average values of samples 2003, 2004, 2005 and 2006 fall within the confidence of the sample 2007. These conclusions can be drawn when the samples are "high".
The situation is different in that these samples are 1/2 or 1/4 of the original. In these cases, the graphical representations of confidence intervals for the parameter average are larger than those initial (Fig.4).
Fig. 4. Graphical representation of confidence intervals for the mean sample size depending on
By applying the tests of significance not obtain significant differences between samples from 2003, 2004, 2005, 2006 and in 2007 (ANOVA - p = 0.323, p = 0.747). In the situation when the sample is 1 / 4 of the initial tests of significance leads to the conclusion that there are significant differences between samples.
Application of significance tests only give us the answer "yes" or "no" on the case issued.
In this situation the question which of the two: confidence intervals and testing statistical assumptions better capture the reality.
It is enough computing confidence intervals, if the graphical representation of them, to draw conclusions about differences between the average temperatures during the period studied?
As a first step note that confidence intervals are very sensitive to sample variability, the sample is higher, even if there is a large variability of data, they can be quite restricted.
with higher or lower limits of trust can be regarded as summarizing several statistical tests.
The third and probably the most important explanation is related to the study purpose. Common objective consists in estimating a value of the population and not the testing of hypotheses on a parameter. In this sense, the use of confidence intervals provides more valuable relationship than hypothesis testing.
Conclusions
It prefers the calculation of confidence intervals, as they clearly explain the role of sample size.
If a study conducted on a sample extended even insignificant difference will acquire significance from a statistical viewpoint, although the clinical significance of the difference could be very low, confidence intervals clearly illustrates the difference.
If the negative results of a study (not significant from a statistical viewpoint), the results will have a greater impact by using confidence intervals than hypothesis testing, because the confidence intervals indicate high degree of uncertainty resulting from limited samples, while testing assumptions provides a statistical result inconclusive.
Confidence intervals avoid also express a conclusion when testing the hypothesis is not significant at 0.05, but becomes significant at 0.06.
References
1. Rateau, Patrick, 2004, Metodele şi statisticile experimentale în ştiinţele umane, editura Polirom
2. Marian Popa Statistica pentru psihologie. Teorie şi aplicatii SPSS, 20008 editura Polirom |
3. Traian Rotariu, Irina Culic, Gabriel Badescu, Elemer Mezei, Cornelia Muresan, 2006, Metode statistice aplicate în stiintele sociale, editura Polirom