Padmapriya Nammalwar
1, Venkateswaran Narasimhan
2, Toshita Kannan
2and SindhuMadhuri Morapakala
21Department of Mathematics, SSN College of Engineering, Kalavakkam, India
2 Department of Electronics and Communication Engineering, SSN College of Engineering, Kalavakkam, India
Non-invasive Glaucoma Screening
Using Ocular Thermal Image
Classification
Ocular thermography is an important, emerging mo-dality in the diagnosis and management of diseases re-lated to eye. It is a non-invasive procedure to evaluate the presence of eye diseases and monitor the response to treatments. In this paper, we propose and evaluate a system designed using infrared thermal image pro-cessing that detects glaucoma. Euclidean distance based segmentation technique is used to threshold the IR image to obtain the region of interest, where the manifestation of glaucoma is predominant. Features are extracted using statistical moments from the tem-perature mapped IR image and Gray Level Co-Oc-currence Matrix of the IR image. Two significant at-tributes, namely the homogeneity and area of region of interest are the inputs to a Support Vector Machine classifier to classify a given input ocular thermal im-age as a normal or diseased imim-age. In our simulation study, one hundred ocular thermal images with even number of normal and diseased subjects were analy-sed. The classifier has achieved a maximum accuracy of 96% when homogeneity and area of region of in-terest are used as attributes, indicating the potential use of proposed method for screening patients even at early stages of glaucoma.
ACM CCS (2012) Classification: Computing method-ologies → Artificial Intelligence → Computer vision → Computer vision problems → Image segmentation Theory of computation → Theory and algorithms for application domains → Machine learning theory → Kernel methods → Support vector machines
Computing methodologies → Machine Learning → Learning paradigms → Supervised learning → Su-pervised learning by classification
Keywords: thermal imaging, glaucoma, support vector machine, temperature mapping, gray level co-occur-rence matrices
1. Introduction
Ocular thermography, which is a relatively new field in medical imaging, has so far been used to detect dry eye syndrome and certain inflam-matory and non-inflaminflam-matory eye diseases [1]. Glaucoma is a disease that is known as a silent stealer of vision. It involves increase in eye pressure and results in damage of the optic nerve, thereby affecting vision. Increased cor-neal temperature is also an indication of glau-coma. The average value of corneal tempera-ture ranges between 32ºC to 35ºC for a healthy individual. Glaucoma is usually detected using various tests as listed briefly in Table 1. How-ever, these methods generally require examina-tion by a proper ophthalmologist. In this paper, we propose infrared thermography as one of the potential alternate methods for glaucoma detec-tion. Thermal imaging records the temperature distribution of the body and thus can provide insight in dysfunction associated with inflam-mation, abnormality or with pain. In addition, thermal imaging involves no ionizing radiation; the test is comfortable and analogous to the simple taking of a photograph [2]. Other mo-dality of imaging does not reveal such abnor-malities in a non-invasive manner that is shown by thermal imaging.
electro-magnetic radiation. Infrared thermography or thermal imaging involves detection of infrared energy emitted from an object and conversion of this energy into a temperature distribution. It can be viewed as a visualization technique to observe the invisible effects of change in temperature in a body and its surroundings. A special kind of camera known as IR camera (or thermal camera) is used in IR thermography to quantitatively measure the surface tempera-tures of objects. This camera detects radiation in the long-infrared range which accounts to the
wavelengths of 9 ‒ 14 μm.
In the 1950s, thermography was an imaging technique used in defence research to observe any movement by the enemy at night. This ap-proach had been incorporated into medical im-aging in 1957 by Dr. R. Lawson who discovered that patients suffering from breast cancer had a higher skin temperature over the cancerous tis-sue than a normal tistis-sue. Since then, thermog-raphy has been utilised as a tool of prognos-tic significance to assess the pathology of the breast and from the 1970s, thermography has been extended to medical applications in the detection of infections, inflammations at nerve endings and other tumors. It is the tendency of the human body to ensure homeostasis, i.e., to maintain equilibrium in the regulation of the different organ systems [3]. This is based on internal and external conditions. The internal conditions which affect homeostasis include the blood flow, the hormone levels, muscular activity and food intake. The room temperature and the humidity levels constitute the external conditions. In a healthy individual, the temper-ature of the human body is symmetrical. Any abnormalities are detected by an increase in temperature.
Digital image processing involves the manipu-lation of digital images to improve their qual-ity and to extract useful information. The fun-damental steps of an image processing system are image acquisition, filtering and enhance-ment, compression, morphological processing
and segmentation etc., [4]. Thermal images are
pseudo-colour images, that is, they possess false colour and therefore need different processing techniques compared to natural digital images. The colour depicts the temperature distribution in the image and the colour coding representa-tion is based on its corresponding temperature variations.
Since the advent of medical thermography, var-ious researchers have extensively worked on conditions like tumors, breast cancer, fractures, etc. Amir et al., [5] presented a fully automatic high accuracy technique for classification of suspicious areas in thermogram images with the aim of assisting physicians in early detection of breast cancer. The proposed algorithm consists of four main steps: pre-processing and seg-mentation, feature extraction, feature selection and classification. Statistical, morphological, frequency domain, histogram and Gray Level Co-occurrence Matrix (GLCM) based features are extracted and the methods proved to be ef-ficient.
GLCM texture features emphasise spatial rela-tionship between pixels, rather than one single pixel intensities [6]. GLCM texture analyses of medical images are relatively computationally efficient and the GLCM features provide fairly straightforward interpretations [7]. Maria et al. [8], performed novel thermal imaging analysis technique for detecting inflammation in thyroid eye disease. Maria and Robert [9] proposed au-tomatic eye corners detection and tracking
al-In conclusion, there has been extensive re-search done on thermal imaging in medical applications using various segmentation op-erations such as thresholding, morphological operations, etc., to extract features and thereby detect diseases like tumors and other conditions manifested through change in relative surface temperature.
The objective of this paper is to develop an in-frared thermal image processing system to de-tect glaucoma, thereby initiating another way for non-invasive glaucoma detection. Initial work on glaucoma can be referred in [16], [17]. The remainder of the paper has been organised as follows: Section 2 explains the proposed methodology. Section 3 illustrates the classifi-cation results based on our simulation. The
con-clusion is provided in Section 4.
2. Proposed Methodology
The overall idea is to process the thermal im-ages, extract features from the images and use these features to build a classifier that classifies an image into ''Normal'' or ''Diseased''. On vi-sual inspection, the thermal images of diseased eyes seemed to possess higher temperature in the eyelid region than that of normal eyes. This led to the conclusion that glaucoma manifests itself in the eyelids in thermal images and hence the area of the ''Region of Interest (ROI)'', in terms of number of pixels which is the portion of the eyelid with relatively high temperature, is taken to be the first attribute while construct-ing a classifier. Two methodologies have been proposed for obtaining the second feature for the classifier; the first based on GLCM feature extraction and the second based on temperature mapping. The hallmark of glaucomatous pro-gression is cupping of the optic nerve head. The optic nerve is located in the back of the eye, which transmits images to the brain. The dam-age will in turn increase the pressure of the eye, which is called the intra ocular pressure. Hence in the initial stage of using thermal imaging one can find the pressure difference which is man-ifested by large increase in temperature, which in turn can be extracted using GLCM features. GLCM features capture such variations in the eye. The temperature mapping method catches the changes in the eye in terms of temperature difference. The classifiers that have been built gorithm in sequence of thermal medical images.
Wiecek et al. [1], have reported the use of ther-mal imaging for medical applications while introducing pre-processing concepts such as contrast enhancement using histogram modifi-cation, median filtering and threshold segmen-tation. They explored image processing tools for conversion of thermal and visual images by evaluating area and distance based on statistical differencing. Duartea et al. [10], have outlined three techniques for segmentation in thermal image, namely thresholding, edge detection segmentation and region based segmentation in order to identify the region of interest. Rajendra Acharya et al. [11], has computed the average corneal temperature and temperature deviation along cornea among different age groups of hu-mans by analysing the thermal images of indi-vidual's eye. This helps in making a tempera-ture mapping based on the colour intensities of the pixels of the thermal image.
Morgan et al. [12], has discussed potential ap-plications of ocular thermography. The dry eye syndrome and its diagnosis using thermal im-aging are detailed. Also, the relationship be-tween eye temperatures and ocular parameters has been examined. It has been demonstrated that unilateral inflammatory disease causes a statistically significant eye temperature of the affected eye. N. Selvarasu et al. [13], compute Euclidean Distances between pixels to segment a pseudocolour thermal image and detect ab-normalities such as arthritis, fractures, etc. The Euclidean distances between a pixel and the av-erage pixel of the ''disease hotspot'' is calculated and a suitable threshold is used to segment the images, thereby identifying fractures. The same principle has been applied to segment the oc-ular thermal images and extract the region of interest. Ravudu et al. [14], have extensively
listed detection algorithms for the ocular dis-eases such as glaucoma, diabetic retinopathy and age related macular degeneration. In par-ticular, glaucoma detection techniques involved manual determination of the optic disc size and the usage of Hough transform. Abràmoff et al., [15] presented a brief overview of the most prevalent causes of blindness in the industri-alized world that includes age-related macular degeneration, diabetic retinopathy, and glau-coma. The review is devoted to retinal imaging and image analysis methods and their clinical implications.
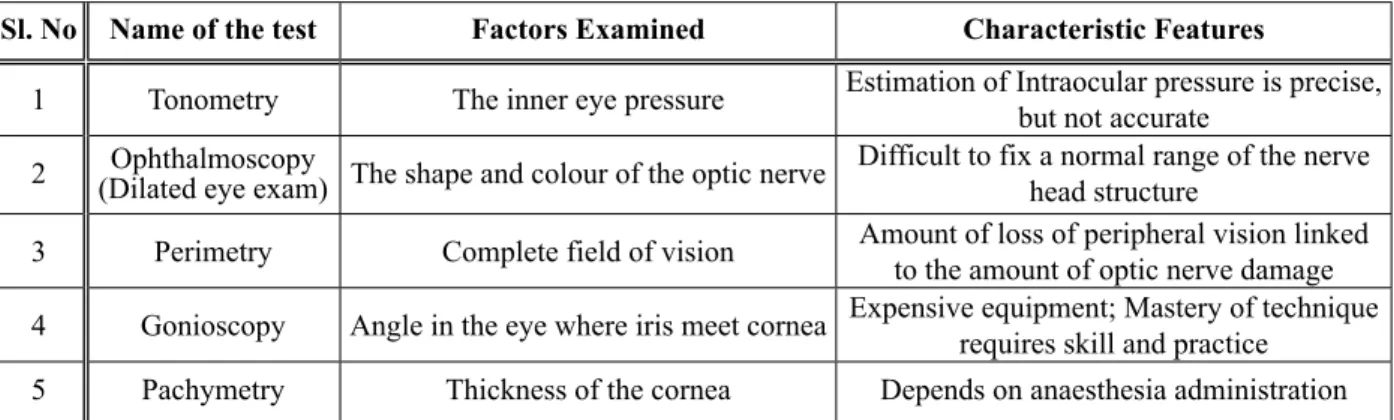
Table 1. Factor examined for clinical analysis of glaucoma.
Sl. No Name of the test Factors Examined Characteristic Features
1 Tonometry The inner eye pressure Estimation of Intraocular pressure is precise, but not accurate
2 (Dilated eye exam) The shape and colour of the optic nerveOphthalmoscopy Difficult to fix a normal range of the nerve head structure
3 Perimetry Complete field of vision Amount of loss of peripheral vision linked to the amount of optic nerve damage
magnetic radiation. Infrared thermography or thermal imaging involves detection of infrared energy emitted from an object and conversion of this energy into a temperature distribution. It can be viewed as a visualization technique to observe the invisible effects of change in temperature in a body and its surroundings. A special kind of camera known as IR camera (or thermal camera) is used in IR thermography to quantitatively measure the surface tempera-tures of objects. This camera detects radiation in the long-infrared range which accounts to the
wavelengths of 9 ‒ 14 μm.
In the 1950s, thermography was an imaging technique used in defence research to observe any movement by the enemy at night. This ap-proach had been incorporated into medical im-aging in 1957 by Dr. R. Lawson who discovered that patients suffering from breast cancer had a higher skin temperature over the cancerous tis-sue than a normal tistis-sue. Since then, thermog-raphy has been utilised as a tool of prognos-tic significance to assess the pathology of the breast and from the 1970s, thermography has been extended to medical applications in the detection of infections, inflammations at nerve endings and other tumors. It is the tendency of the human body to ensure homeostasis, i.e., to maintain equilibrium in the regulation of the different organ systems [3]. This is based on internal and external conditions. The internal conditions which affect homeostasis include the blood flow, the hormone levels, muscular activity and food intake. The room temperature and the humidity levels constitute the external conditions. In a healthy individual, the temper-ature of the human body is symmetrical. Any abnormalities are detected by an increase in temperature.
Digital image processing involves the manipu-lation of digital images to improve their qual-ity and to extract useful information. The fun-damental steps of an image processing system are image acquisition, filtering and enhance-ment, compression, morphological processing
and segmentation etc., [4]. Thermal images are
pseudo-colour images, that is, they possess false colour and therefore need different processing techniques compared to natural digital images. The colour depicts the temperature distribution in the image and the colour coding representa-tion is based on its corresponding temperature variations.
Since the advent of medical thermography, var-ious researchers have extensively worked on conditions like tumors, breast cancer, fractures, etc. Amir et al., [5] presented a fully automatic high accuracy technique for classification of suspicious areas in thermogram images with the aim of assisting physicians in early detection of breast cancer. The proposed algorithm consists of four main steps: pre-processing and seg-mentation, feature extraction, feature selection and classification. Statistical, morphological, frequency domain, histogram and Gray Level Co-occurrence Matrix (GLCM) based features are extracted and the methods proved to be ef-ficient.
GLCM texture features emphasise spatial rela-tionship between pixels, rather than one single pixel intensities [6]. GLCM texture analyses of medical images are relatively computationally efficient and the GLCM features provide fairly straightforward interpretations [7]. Maria et al. [8], performed novel thermal imaging analysis technique for detecting inflammation in thyroid eye disease. Maria and Robert [9] proposed au-tomatic eye corners detection and tracking
al-In conclusion, there has been extensive re-search done on thermal imaging in medical applications using various segmentation op-erations such as thresholding, morphological operations, etc., to extract features and thereby detect diseases like tumors and other conditions manifested through change in relative surface temperature.
The objective of this paper is to develop an in-frared thermal image processing system to de-tect glaucoma, thereby initiating another way for non-invasive glaucoma detection. Initial work on glaucoma can be referred in [16], [17]. The remainder of the paper has been organised as follows: Section 2 explains the proposed methodology. Section 3 illustrates the classifi-cation results based on our simulation. The
con-clusion is provided in Section 4.
2. Proposed Methodology
The overall idea is to process the thermal im-ages, extract features from the images and use these features to build a classifier that classifies an image into ''Normal'' or ''Diseased''. On vi-sual inspection, the thermal images of diseased eyes seemed to possess higher temperature in the eyelid region than that of normal eyes. This led to the conclusion that glaucoma manifests itself in the eyelids in thermal images and hence the area of the ''Region of Interest (ROI)'', in terms of number of pixels which is the portion of the eyelid with relatively high temperature, is taken to be the first attribute while construct-ing a classifier. Two methodologies have been proposed for obtaining the second feature for the classifier; the first based on GLCM feature extraction and the second based on temperature mapping. The hallmark of glaucomatous pro-gression is cupping of the optic nerve head. The optic nerve is located in the back of the eye, which transmits images to the brain. The dam-age will in turn increase the pressure of the eye, which is called the intra ocular pressure. Hence in the initial stage of using thermal imaging one can find the pressure difference which is man-ifested by large increase in temperature, which in turn can be extracted using GLCM features. GLCM features capture such variations in the eye. The temperature mapping method catches the changes in the eye in terms of temperature difference. The classifiers that have been built gorithm in sequence of thermal medical images.
Wiecek et al. [1], have reported the use of ther-mal imaging for medical applications while introducing pre-processing concepts such as contrast enhancement using histogram modifi-cation, median filtering and threshold segmen-tation. They explored image processing tools for conversion of thermal and visual images by evaluating area and distance based on statistical differencing. Duartea et al. [10], have outlined three techniques for segmentation in thermal image, namely thresholding, edge detection segmentation and region based segmentation in order to identify the region of interest. Rajendra Acharya et al. [11], has computed the average corneal temperature and temperature deviation along cornea among different age groups of hu-mans by analysing the thermal images of indi-vidual's eye. This helps in making a tempera-ture mapping based on the colour intensities of the pixels of the thermal image.
Morgan et al. [12], has discussed potential ap-plications of ocular thermography. The dry eye syndrome and its diagnosis using thermal im-aging are detailed. Also, the relationship be-tween eye temperatures and ocular parameters has been examined. It has been demonstrated that unilateral inflammatory disease causes a statistically significant eye temperature of the affected eye. N. Selvarasu et al. [13], compute Euclidean Distances between pixels to segment a pseudocolour thermal image and detect ab-normalities such as arthritis, fractures, etc. The Euclidean distances between a pixel and the av-erage pixel of the ''disease hotspot'' is calculated and a suitable threshold is used to segment the images, thereby identifying fractures. The same principle has been applied to segment the oc-ular thermal images and extract the region of interest. Ravudu et al. [14], have extensively
listed detection algorithms for the ocular dis-eases such as glaucoma, diabetic retinopathy and age related macular degeneration. In par-ticular, glaucoma detection techniques involved manual determination of the optic disc size and the usage of Hough transform. Abràmoff et al., [15] presented a brief overview of the most prevalent causes of blindness in the industri-alized world that includes age-related macular degeneration, diabetic retinopathy, and glau-coma. The review is devoted to retinal imaging and image analysis methods and their clinical implications.
Table 1. Factor examined for clinical analysis of glaucoma.
Sl. No Name of the test Factors Examined Characteristic Features
1 Tonometry The inner eye pressure Estimation of Intraocular pressure is precise, but not accurate
2 (Dilated eye exam) The shape and colour of the optic nerveOphthalmoscopy Difficult to fix a normal range of the nerve head structure
3 Perimetry Complete field of vision Amount of loss of peripheral vision linked to the amount of optic nerve damage
and inspected have only two input attributes in order to avoid the curse of dimensionality by using too many features for classification. Fig-ure 1 shows the basic block diagram that illus-trates the above discussed methodology.
2.1. Euclidean Distance Based Segmentation of ROI
As the image data with thermal images has de-tails of the whole eye with eye lids and lashes which are not necessary in the identification of glaucoma, hence the region of interest is considered before initiating any processing. Glaucoma affects the optic nerve and hence the region inside the eye is necessary for our inves-tigation.
Euclidean distance is used to obtain the first at-tribute of the classifier. The Euclidean distance between every pixel, z and the average pixel, a has been computed individually for the image and also for the individual Red, Green and Blue components using the equation
( )
(
) (
2) (
2)
2R R G G B B
, z
D z a = z −a + z −a + z −a
where D(z,a) is the Euclidean distance and the subscripts of z and a represent Red, Green and Blue components.
Any image pixel z is said to be similar to a if the Euclidean distance between them is less than a specified threshold D0 [13].
Threshold-ing is then carried out to extract the high in-tensity pixels alone and a binary image is thus generated. The white pixels in the binary image represent the ROI. The area is then computed in terms of the number of white pixels. The block diagram for this method is shown in Figure 2.
The thresholded Blue component of the normal and diseased images showed maximum differ-ence and hdiffer-ence the area of the ROI obtained in terms of the number of pixels for the thresh-olded Blue component has been used as an at-tribute for classification.
2.2. GLCM Feature Based Classification The Gray-Level Co-occurrence Matrix is the representation of different combinations of the pixel intensities in an image. Since the re-lationship between two pixels is analysed in a GLCM, it provides second order statistical in-formation [18]. Features generated by this tech-nique are also known as Haralick features [19]. The images are pre-processed to extract GLCM features as shown in Figure 3. Firstly, the RGB images are converted into grayscale images.
Then, image filtering is carried out using me-dian filters. This is followed by image enhance-ment using histogram equalization which helps in enhancing the contrast of the image. After pre-processing, the Gray Level Co-occurrence Matrix is computed for all the images. Consider the image data shown below on the left. If we use the position operator ''1 pixel to the right and 1 pixel down'' then we get the gray-level co-occurrence matrix, where an entry cij is a
count of the number of times that F(x,y) = i and F(x+1,y+1) = j. For example, the first
en-try comes from the fact that 4 times a 0 appears
below and to the right of another 0. 0 0 0 1 2
1 1 0 1 1 2 2 1 0 0 1 1 0 2 0 0 0 1 0 1
4 2 1
1 2 3 2 16
0 2 0 C
=
The factor 1/16 is because there are 16 pairs en-tering into this matrix, so this normalizes the matrix entries to be estimates of the co-occur-rence probabilities [20].
Twenty two features are extracted from this GLCM. Four out of these 22 features are
se-lected using Correlation feature selection algo-rithm [21] for attribute selection using the CFS-Subset Eval tool in a machine learning software called WEKA [22]. These are Homogeneity, Sum Variance, Sum Entropy and Information Measure of Correlation-2 (IMC 2). The features are computed using the formula shown in Table 2. In this, p(i,j) is the (i,j)-th entry in a nor-malized gray-tone spatial dependence matrix px
(i) is the i-th entry in the marginal probability matrix obtained by summing the rows of p(i,j), py(i) is the ith entry in the marginal
probabil-ity matrix obtained by summing the columns of p(i,j) and Ng = number of distinct gray levels in
the quantized image.
Support vector machines are constructed with each of these four features as the second attrib-ute; the first being the area of ROI in terms of pixel count.
2.3. Temperature Mapping Based Classification
In this method, temperature mapping is per-formed on the pseudo-coloured thermal images. The second attribute for the classifier is ob-tained by computing the statistical moments for the equivalent temperature mapping. Two
sam-Determination on of the average pixel
Segmentation of ROI using thresholdD0
Calculation of Euclidean DistanceD z a( , )
Figure 2. Block diagram for segmentation of ROI.
Ocular thermal image
RGB to Gray scale conversion
Median filtering
Histogram Equalization
GLCM feature extraction and feature selection
Four 2-attribuite SVM
Classification output
Area of ROI
Figure 3. GLCM feature based classification.
Ocular thermal image
Classified Output Normal/ Diseased
eye SVM
cassifier ROI area
Extraction
1. GLCM features 2. Temperature
mapped features
Figure 1. Basic block diagram.
Table 1. Factor examined for clinical analysis of glaucoma.
Sl. No GLCM features Formula
1 Homogeneity 1 ( )2 ( )
1 ,
1
i j
f p i j
i j
=
+ − ∑ ∑
2 Sum Variance
( ) ( )
2
2
2 3
2
g
N
x y i
f i f p+ i
=
= ∑ −
where
( ) 2 2 ( )
1 1 , ,
g g
N N x y
i j
p+ k p i j
= =
= ∑ ∑
i j k+ = =2,3,...,2Ng
3 Sum Entropy 3 2 ( )
{
( )}
2 log
g
N
x y x y
i
f p+ i p+ i
=
= −∑
4 Information Measure of Correlation2 (IMC 2)
( )
(
)
124 1 exp 2.0 2
f = − − HXY −HXY
where
( ), log
(
( ),)
i j
HXY = −∑ ∑ p i j p i j
and
( ) ( )
{
( ) ( )}
2 i j x y log x y
HXY = −∑ ∑ p i p j p i p j
ples of ocular thermal image with temperature
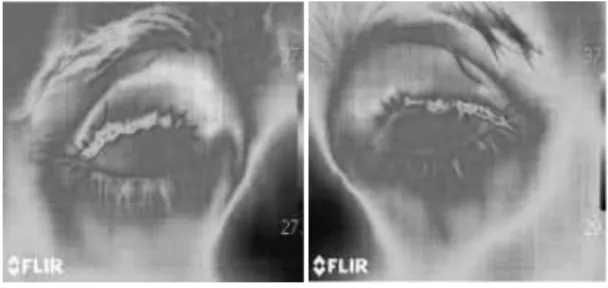
scale are shown in Figure 4. Figure 5 shows a
block diagram for the method based on temper-ature mapping based classification. A thermal camera usually gives the provision to save the recorded thermal image as temperature data or in an image format such as JPEG. Temperature data enables the use of actual temperature data for analysis. However, the thermal images that have been procured for this project are in JPEG format and lack the actual temperature data pos-sessing only a color coding scheme. The white
areas shown in Figure 4 indicate the highest rel -ative temperature regions, followed by red and then yellow, while blue corresponds to the low-est relative temperature regions in the image. To extract the features, temperature mapping is done, assigning temperature ranges from 20ºC
to 45ºC for 0 to 255 pixel intensities. For a pixel
value f(x,y), the equivalent temperature T [23], is given by
( )
, f x y( ) (
255, 45 20)
20T x y = × − +
A histogram of the image is used to select the high temperature values (> 33°C) from the tem-perature matrix obtained and then, the mean, variance, standard deviation, skewness and
kurtosis [24] are computed for each image. Of
these features, the mean has been found to be more distinguishable between normal and dis-eased images and hence is selected as one of
the classifier attributes. An SVM is then con-structed and its performance is evaluated.
2.4. Support Vector Machine Classification Support Vector Machines (SVM) are supervised learning models based on the idea of an opti-mal hyperplane for linearly separable patterns. They can be extended to non-linearly separa-ble patterns with the help of functions known as kernels. These hyperplanes are constructed after identifying ''Support Vectors'' which are the data points that lie closest to the decision surface and are the most difficult to classify. SVMs aim at maximizing the margin around the separating hyperplane.
Five SVMs have been constructed with two at-tributes each. The first attribute is the area and the second is one of the four selected GLCM features. These SVMs have a linear kernel. The fifth SVM has been constructed with the mean temperature and the area of ROI as its two at-tributes and the uses a quadratic kernel. The choice of non-linear kernel is to ensure better data fitting. The performance of a binary classi-fication test is evaluated by calculating statisti-cal measures such as sensitivity, specificity, ac-curacy, and by plotting the Receiver Operating Characteristics curves (ROC) [25]. These are given by the following expressions:
where TP = Number of True Positives, TN = Number of True Negatives, FP = Number of False Positives and FN = Number of False Neg-atives.
3. Results and Discussion
One hundred ocular thermal images have been captured using a FLIR thermal camera and the protocol for thermal image acquisition was fol-lowed while capturing the images [26]. Fifty of these images correspond to normal eyes and fifty correspond to eyes of glaucoma patients. Each category has 25 left and 25 right eye im-ages. Samples of images obtained are shown in Figure 6. The images are in JPEG format
and their sizes are reduced to 168 × 224 using
a standard window so as to eliminate the un-necessary portions of the images. A uniform temperature scale for the color coding in the images is considered as a fair assumption. The proposed two methods have been implemented using MATLAB R2013a.
Features have been extracted as discussed in Section 2. Table 3 shows a sample of training data set after feature extraction and feature se-lection. The area of ROI is combined with each
of the five other features to construct five 2-at-tribute SVMs. Eighty-four images have been used to train the system, out of which forty-two are images of normal eyes and forty-two are images of the eyes of glaucoma patients. Each of the classifier's ability to interpolate has been examined by using this very same training data-set for cross validation. In addition, sixteen mu-tually exclusive images with known labels, i.e. images that have not been used for training are used for testing each of the classifiers and ex-amining their ability to extrapolate.
The performance of each classifier has been evaluated in terms of accuracy, true positive rate, false positive rate, true negative rate, false negative rate and error. These statistics have
been listed out in Table 4. The SVMs have been shown in Figure 7(a) ‒ Figure 7(e). The SVM
in Figure 7(a) uses a quadratic kernel for better data fitting. The ''0'' in the legend is to be in-terpreted as normal and ''1'' as diseased. Out of the sixteen images tested, one is falsely classi-fied as positive for glaucoma and three diseased images were wrongly classified as normal. The linear SVM in Figure 7(b) has been constructed using Area and Homogeneity (GLCM Feature) as the input attributes. Here, out of the 16 im-ages that were tested, 15 are correctly classified and only one diseased image was incorrectly
Table 3. Features of sample training data set.
S. No Normal/Diseased (pixel count)Area Temperature Homogeneity Mean VarianceSum Entropy IMC 2Sum
1 Normal 181 36.1 0.91 63.15 2.52 0.97
2 Normal 551 36.12 0.90 62.27 2.54 0.97
3 Normal 147 36.24 0.90 62.59 2.54 0.97
4 Diseased 2335 37.11 0.87 61.95 2.55 0.96
5 Diseased 1661 36.90 0.87 61.86 2.55 0.96
6 Diseased 1920 37.08 0.87 61.81 2.58 0.96
Ocular thermal image
Temperature Mapping
Statistical moments based
features
Features Selection
SVM Classifier
Classification output
Area of ROI
Figure 5. Temperature mapping based classification. Figure 4. Thermal images with temperature scale.
Figure 6. Sample thermal images: (a) and (b) normal eyes, (c) and (d) diseased eyes. (a) (b) (c) (d)
Sensitivity Specificity Fall out Accuracy
Error 1 Accuracy TN TP FN
TN FP TN FP FP TN
TP TN TP TN FP FN
= + =
+ =
+
+ =
+ + +
ples of ocular thermal image with temperature
scale are shown in Figure 4. Figure 5 shows a
block diagram for the method based on temper-ature mapping based classification. A thermal camera usually gives the provision to save the recorded thermal image as temperature data or in an image format such as JPEG. Temperature data enables the use of actual temperature data for analysis. However, the thermal images that have been procured for this project are in JPEG format and lack the actual temperature data pos-sessing only a color coding scheme. The white
areas shown in Figure 4 indicate the highest rel -ative temperature regions, followed by red and then yellow, while blue corresponds to the low-est relative temperature regions in the image. To extract the features, temperature mapping is done, assigning temperature ranges from 20ºC
to 45ºC for 0 to 255 pixel intensities. For a pixel
value f(x,y), the equivalent temperature T [23], is given by
( )
, f x y( ) (
255, 45 20)
20T x y = × − +
A histogram of the image is used to select the high temperature values (> 33°C) from the tem-perature matrix obtained and then, the mean, variance, standard deviation, skewness and
kurtosis [24] are computed for each image. Of
these features, the mean has been found to be more distinguishable between normal and dis-eased images and hence is selected as one of
the classifier attributes. An SVM is then con-structed and its performance is evaluated.
2.4. Support Vector Machine Classification Support Vector Machines (SVM) are supervised learning models based on the idea of an opti-mal hyperplane for linearly separable patterns. They can be extended to non-linearly separa-ble patterns with the help of functions known as kernels. These hyperplanes are constructed after identifying ''Support Vectors'' which are the data points that lie closest to the decision surface and are the most difficult to classify. SVMs aim at maximizing the margin around the separating hyperplane.
Five SVMs have been constructed with two at-tributes each. The first attribute is the area and the second is one of the four selected GLCM features. These SVMs have a linear kernel. The fifth SVM has been constructed with the mean temperature and the area of ROI as its two at-tributes and the uses a quadratic kernel. The choice of non-linear kernel is to ensure better data fitting. The performance of a binary classi-fication test is evaluated by calculating statisti-cal measures such as sensitivity, specificity, ac-curacy, and by plotting the Receiver Operating Characteristics curves (ROC) [25]. These are given by the following expressions:
where TP = Number of True Positives, TN = Number of True Negatives, FP = Number of False Positives and FN = Number of False Neg-atives.
3. Results and Discussion
One hundred ocular thermal images have been captured using a FLIR thermal camera and the protocol for thermal image acquisition was fol-lowed while capturing the images [26]. Fifty of these images correspond to normal eyes and fifty correspond to eyes of glaucoma patients. Each category has 25 left and 25 right eye im-ages. Samples of images obtained are shown in Figure 6. The images are in JPEG format
and their sizes are reduced to 168 × 224 using
a standard window so as to eliminate the un-necessary portions of the images. A uniform temperature scale for the color coding in the images is considered as a fair assumption. The proposed two methods have been implemented using MATLAB R2013a.
Features have been extracted as discussed in Section 2. Table 3 shows a sample of training data set after feature extraction and feature se-lection. The area of ROI is combined with each
of the five other features to construct five 2-at-tribute SVMs. Eighty-four images have been used to train the system, out of which forty-two are images of normal eyes and forty-two are images of the eyes of glaucoma patients. Each of the classifier's ability to interpolate has been examined by using this very same training data-set for cross validation. In addition, sixteen mu-tually exclusive images with known labels, i.e. images that have not been used for training are used for testing each of the classifiers and ex-amining their ability to extrapolate.
The performance of each classifier has been evaluated in terms of accuracy, true positive rate, false positive rate, true negative rate, false negative rate and error. These statistics have
been listed out in Table 4. The SVMs have been shown in Figure 7(a) ‒ Figure 7(e). The SVM
in Figure 7(a) uses a quadratic kernel for better data fitting. The ''0'' in the legend is to be in-terpreted as normal and ''1'' as diseased. Out of the sixteen images tested, one is falsely classi-fied as positive for glaucoma and three diseased images were wrongly classified as normal. The linear SVM in Figure 7(b) has been constructed using Area and Homogeneity (GLCM Feature) as the input attributes. Here, out of the 16 im-ages that were tested, 15 are correctly classified and only one diseased image was incorrectly
Table 3. Features of sample training data set.
S. No Normal/Diseased (pixel count)Area Temperature Homogeneity Mean VarianceSum Entropy IMC 2Sum
1 Normal 181 36.1 0.91 63.15 2.52 0.97
2 Normal 551 36.12 0.90 62.27 2.54 0.97
3 Normal 147 36.24 0.90 62.59 2.54 0.97
4 Diseased 2335 37.11 0.87 61.95 2.55 0.96
5 Diseased 1661 36.90 0.87 61.86 2.55 0.96
6 Diseased 1920 37.08 0.87 61.81 2.58 0.96
Ocular thermal image
Temperature Mapping
Statistical moments based
features
Features Selection
SVM Classifier
Classification output
Area of ROI
Figure 5. Temperature mapping based classification. Figure 4. Thermal images with temperature scale.
Figure 6. Sample thermal images: (a) and (b) normal eyes, (c) and (d) diseased eyes. (a) (b) (c) (d)
Sensitivity Specificity Fall out Accuracy
Error 1 Accuracy TN TP FN
TN FP TN FP FP TN
TP TN TP TN FP FN
= + =
+ =
+
+ =
+ + +
classified as normal. Similarly, Figures 7(c)
‒7(e) depict linear SVMs with good interpola -tion and extrapola-tion capabilities.
4. Conclusion
In this paper, we have presented a non-invasive procedure to evaluate the presence of glau-coma, the eye disease. Two methods have been proposed for the detection of glaucoma using ocular thermal images analyzed in fifty normal and fifty abnormal subjects. The performance of the proposed methods using SVM classifiers with features obtained from Gray Level Co-oc-currence Matrix and the temperature mapping has been evaluated. The simulation results in-dicate that the classifier in the detection of glaucoma performs well and provides accu-racy, sensitivity and specificity of around 96%.
However, extensive clinical trials may further be needed to establish the practical acceptance of our method by medical community.
5. Acknowledgement
The authors would like to thank IGCAR, India for the thermal images. Furthermore, the au-thors would like to thank the management of Sri Sivasubramania Nadar College of Engineer-ing, Kalavakkam, for providing the facilities to carry out this work.
References
[1] Wiecek et al., ''Advanced Thermal Image Pro-cessing for Medical and Biological Applica-tions'', in Proceedings of the 23rd Annual Inter-national Conference of the IEEE, vol. 3, 2001, pp. 2805–2807.
http://dx.doi.org/ 10.1109/IEMBS.2001.1017368 [2] M. Frize et al., ''Processing Thermal Images to
Detect Breast Cancer and Assess Pain'', 4th In-ternational IEEE EMBS Information Technology Applications in Biomedicine, 2003.
http://dx.doi.org/ 10.1109/ITAB.2003.1222520 [3] M. Vollmer and K. Möllmann, ''Infrared thermal
imaging'', Weinheim: Wiley-VCH, 2010.
[4] R. C. Gonzalez and R. E Woods, ''Digital image processing'', Adison Wesley, 2002.
[5] A. E. Lashkari et al., "Full Intelligent Cancer Classification of Thermal Breast Images to As-sist Physician in Clinical Diagnostic Applica-tions", Journal of Med Signals Sens, vol. 6, no. 1,
pp. 12–24, 2016.
[6] T. Torhem et al., ''Classification of Dynamic Con-trast Enhanced MR Images of Cervical Cancers Using Texture Analysis an Support Vector Ma-chines'', IEEE Trans on Medical Imaging, vol.
33, no. 8, 2014.
http://dx.doi.org/ 10.1109/TMI.2014.2321024
[7] G. Castelliano et al., ''Texture Analysis of Medi-cal Images'', Clinical Radiology, vol. 59, no. 12,
2004, pp. 1061–1069.
http://dx.doi.org/10.1016/j.crad.2004.07.008
[8] C. Di Maria et al., ''Novel Thermal Imaging Analysis Technique for Detecting Inflamma-tion in Thyroid Eye Disease'', Journal of Clini-cal Endocrinology Metabolism, vol. 99, no. 12,
pp. 4600–4606, 2014.
https://doi.org/10.1210/jc.2014-1957
[9] M. Strakowska and R. Strakowski, ''Automatic Eye Corners Detection and Tracking Algorithm in Sequence of Thermal Medical Images'', Mea-surement Automation Monitoring, vol. 61, no. 6, 2015.
[10] L. Duartea et al., ''Segmentation Algorithms for Thermal Images'', International Conference on Health and Social Care Information Systems and Technologies Science Direct, Procedia Technol-ogy, pp. 1560–1569, 2014.
[11] U. Rajendra Acharya et al., ''Analysis of Normal Human Eye with Different Age Groups using In-frared Images'', Springer Science Original, Jour-nal of Medical Systems, vol. 33, pp. 207–213, 2009.
[12] P. B. Morgan et al., ''Potential Applications of Ocular Thermography'', Optometry & Vision Sci-ence, pp. 568–576, 1993.
[13] N. Selvarasu et. al., ''Euclidean Distance Based Color Image Segmentation of Abnormality De-tection from Pseudo Color Thermographs'', Inter-national Journal of Computer Theory and Engi-neering, pp. 514–516, 2010.
http://dx.doi.org/ 10.7763/IJCTE.2010.V2.194 [14] M. Ravudu et al., ''Review of Image Processing
Techniques for Automatic Detection of Eye Dis-eases'', Sensing Technology (ICST), 2012 Sixth International Conference, pp. 320‒325.
http://dx.doi.org/ 10.1109/ICSensT.2012.6461695 Figure 7 (a). SVM with area and mean temperature as
attributes.
Figure 7 (b). SVM with area and homogeneity as attributes.
Figure 7 (c). SVM with area and sum entropy as attributes.
Figure 7 (d). SVM with area and IMC 2 as attributes.
Figure 7 (e). SVM with area and sum variance as attributes.
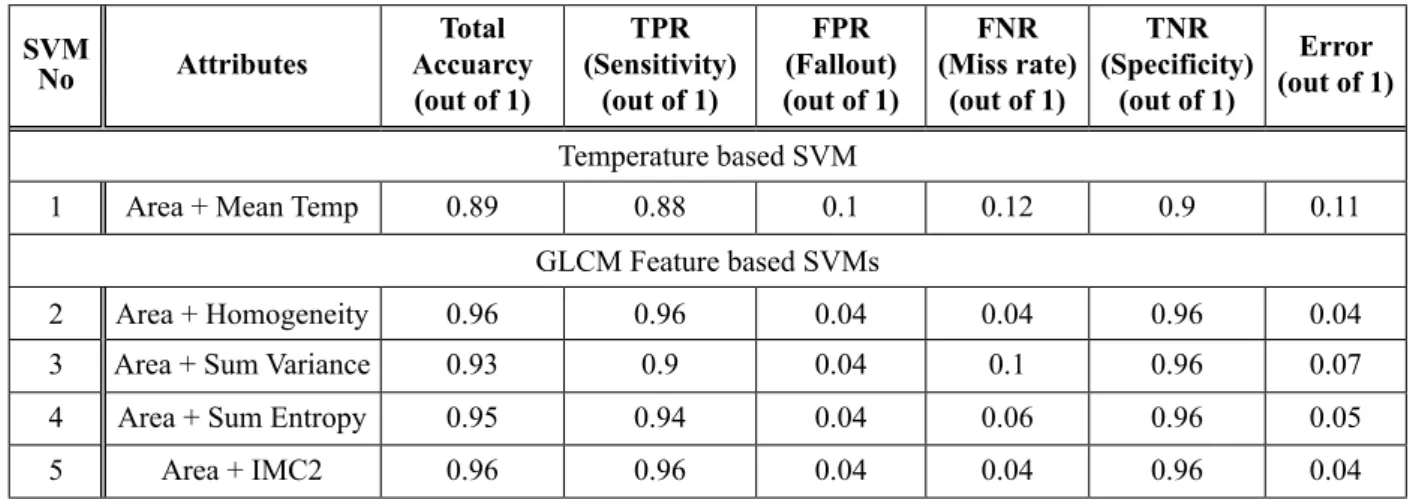
Table 4. Performance measures of the classifier.
SVM
No Attributes
Total Accuarcy
(out of 1)
TPR (Sensitivity)
(out of 1)
FPR (Fallout) (out of 1)
FNR (Miss rate)
(out of 1)
TNR (Specificity)
(out of 1)
Error (out of 1)
Temperature based SVM
1 Area + Mean Temp 0.89 0.88 0.1 0.12 0.9 0.11
GLCM Feature based SVMs
2 Area + Homogeneity 0.96 0.96 0.04 0.04 0.96 0.04
3 Area + Sum Variance 0.93 0.9 0.04 0.1 0.96 0.07
4 Area + Sum Entropy 0.95 0.94 0.04 0.06 0.96 0.05
classified as normal. Similarly, Figures 7(c)
‒7(e) depict linear SVMs with good interpola -tion and extrapola-tion capabilities.
4. Conclusion
In this paper, we have presented a non-invasive procedure to evaluate the presence of glau-coma, the eye disease. Two methods have been proposed for the detection of glaucoma using ocular thermal images analyzed in fifty normal and fifty abnormal subjects. The performance of the proposed methods using SVM classifiers with features obtained from Gray Level Co-oc-currence Matrix and the temperature mapping has been evaluated. The simulation results in-dicate that the classifier in the detection of glaucoma performs well and provides accu-racy, sensitivity and specificity of around 96%.
However, extensive clinical trials may further be needed to establish the practical acceptance of our method by medical community.
5. Acknowledgement
The authors would like to thank IGCAR, India for the thermal images. Furthermore, the au-thors would like to thank the management of Sri Sivasubramania Nadar College of Engineer-ing, Kalavakkam, for providing the facilities to carry out this work.
References
[1] Wiecek et al., ''Advanced Thermal Image Pro-cessing for Medical and Biological Applica-tions'', in Proceedings of the 23rd Annual Inter-national Conference of the IEEE, vol. 3, 2001, pp. 2805–2807.
http://dx.doi.org/ 10.1109/IEMBS.2001.1017368 [2] M. Frize et al., ''Processing Thermal Images to
Detect Breast Cancer and Assess Pain'', 4th In-ternational IEEE EMBS Information Technology Applications in Biomedicine, 2003.
http://dx.doi.org/ 10.1109/ITAB.2003.1222520 [3] M. Vollmer and K. Möllmann, ''Infrared thermal
imaging'', Weinheim: Wiley-VCH, 2010.
[4] R. C. Gonzalez and R. E Woods, ''Digital image processing'', Adison Wesley, 2002.
[5] A. E. Lashkari et al., "Full Intelligent Cancer Classification of Thermal Breast Images to As-sist Physician in Clinical Diagnostic Applica-tions", Journal of Med Signals Sens, vol. 6, no. 1,
pp. 12–24, 2016.
[6] T. Torhem et al., ''Classification of Dynamic Con-trast Enhanced MR Images of Cervical Cancers Using Texture Analysis an Support Vector Ma-chines'', IEEE Trans on Medical Imaging, vol.
33, no. 8, 2014.
http://dx.doi.org/ 10.1109/TMI.2014.2321024
[7] G. Castelliano et al., ''Texture Analysis of Medi-cal Images'', Clinical Radiology, vol. 59, no. 12,
2004, pp. 1061–1069.
http://dx.doi.org/10.1016/j.crad.2004.07.008
[8] C. Di Maria et al., ''Novel Thermal Imaging Analysis Technique for Detecting Inflamma-tion in Thyroid Eye Disease'', Journal of Clini-cal Endocrinology Metabolism, vol. 99, no. 12,
pp. 4600–4606, 2014.
https://doi.org/10.1210/jc.2014-1957
[9] M. Strakowska and R. Strakowski, ''Automatic Eye Corners Detection and Tracking Algorithm in Sequence of Thermal Medical Images'', Mea-surement Automation Monitoring, vol. 61, no. 6, 2015.
[10] L. Duartea et al., ''Segmentation Algorithms for Thermal Images'', International Conference on Health and Social Care Information Systems and Technologies Science Direct, Procedia Technol-ogy, pp. 1560–1569, 2014.
[11] U. Rajendra Acharya et al., ''Analysis of Normal Human Eye with Different Age Groups using In-frared Images'', Springer Science Original, Jour-nal of Medical Systems, vol. 33, pp. 207–213, 2009.
[12] P. B. Morgan et al., ''Potential Applications of Ocular Thermography'', Optometry & Vision Sci-ence, pp. 568–576, 1993.
[13] N. Selvarasu et. al., ''Euclidean Distance Based Color Image Segmentation of Abnormality De-tection from Pseudo Color Thermographs'', Inter-national Journal of Computer Theory and Engi-neering, pp. 514–516, 2010.
http://dx.doi.org/ 10.7763/IJCTE.2010.V2.194 [14] M. Ravudu et al., ''Review of Image Processing
Techniques for Automatic Detection of Eye Dis-eases'', Sensing Technology (ICST), 2012 Sixth International Conference, pp. 320‒325.
http://dx.doi.org/ 10.1109/ICSensT.2012.6461695 Figure 7 (a). SVM with area and mean temperature as
attributes.
Figure 7 (b). SVM with area and homogeneity as attributes.
Figure 7 (c). SVM with area and sum entropy as attributes.
Figure 7 (d). SVM with area and IMC 2 as attributes.
Figure 7 (e). SVM with area and sum variance as attributes.
Table 4. Performance measures of the classifier.
SVM
No Attributes
Total Accuarcy
(out of 1)
TPR (Sensitivity)
(out of 1)
FPR (Fallout) (out of 1)
FNR (Miss rate)
(out of 1)
TNR (Specificity)
(out of 1)
Error (out of 1)
Temperature based SVM
1 Area + Mean Temp 0.89 0.88 0.1 0.12 0.9 0.11
GLCM Feature based SVMs
2 Area + Homogeneity 0.96 0.96 0.04 0.04 0.96 0.04
3 Area + Sum Variance 0.93 0.9 0.04 0.1 0.96 0.07
4 Area + Sum Entropy 0.95 0.94 0.04 0.06 0.96 0.05
[15] D. Michael et al., ''Retinal Imaging and Image Analysis'', IEEE Trans on Medical Imaging,
2010, pp. 169‒208.
http://dx.doi.org/ 10.1109/RBME.2010.2084567
[16] G. Harshavardhan et al., ''Assessment of Glau-coma with Ocular Thermal Images using GLCM Techniques and Logistic Regression Classifier'', International Conference on Wireless Commu-nications, Signal Processing and Networking (WISPNET), 2016.
http://dx.doi.org/ 10.1109/WiSPNET.2016.7566393 [17] N. Padmapriya et al., ''Assessment of Glaucoma
with Ocular Thermal Images Using GLCM Tech-niques'', 12th International Conference on Quan-titative Infrared Thermography, 2015.
http://dx.doi.org/ 10.21611/qirt.2015.0098 [18] J. R. Ferguson, "Using the Grey-level
Co-occur-rence Matrix to Segment and Classify Radar Im-agery", Ph.D thesis, ProQuest, 2007.
[19] R. Haralick et al., ''Textural Features for Image Classification'', IEEE Transactions on Systems, Man and Cybernetics, 1973, pp. 610–621.
http://dx.doi.org/ 10.1109/TSMC.1973.4309314
[20] www.code.ucsd.edu/pcosman/glcm.pdf
[21] M. A. Hall, ''Correlation-based Feature Selection for Machine Learning'', Ph.D thesis, 1999. [22] Weka 3 ‒ Data Mining with Open Source Ma
-chine Learning Software in Java, Cs.waikato. ac.nz, 2016.
http://www.cs.waikato.ac.nz/ml/weka/
[23] J.-H. Tan et al., ''Automated Study of Ocular Ther-mal Images: Comprehensive Analysis of Corneal Health with Different Age Group Subjects and Validation'', Elsevier, Digital Signal Processing, 2010, pp. 1579–1591.
http://dx.doi.org/ 10.1016/j.dsp.2010.03.014 [24] W. Press et al., ''Numerical recipes in C'', Chapter
14, Cambridge: Cambridge Univ. Press, 1997.
[25] R. A. Maxian and R. R. Roberts, "Proper Use of ROC Curves in Intrusion/Anomaly Detection'', 2006.
[26] W. Cockburn, ''Common Errors in Medical Ther-mal Imaging'', Proceedings of Information, vol. 7, pp. 165–177, 2006.
Received: September 2016
Revised: May 2017
Accepted: June 2017
Contact addresses: Padmapriya Nammalwar Department of Mathematics SSN College of Engineering Kalavakkam, TamilNadu India e-mail: [email protected]
Venkateswaran Narasimhan Department of Electronics and Communication Engineering SSN College of Engineering Kalavakkam, TamilNadu India e-mail: [email protected]
Toshitha Kannan Department of Electronics and Communication Engineering SSN College of Engineering Kalavakkam, TamilNadu India e-mail: [email protected]
SindhuMadhuri Morapakala Department of Electronics and Communication Engineering SSN College of Engineering Kalavakkam, TamilNadu India e-mail: [email protected]
PadmaPriya Nammalwaris an assistant Professor in the Department
of Mathematics, SSN College of Engineering, India. She received her PhD from Dublin City University Dublin, Ireland. Dr. Nammalwar won the outstanding paper award at the Literati Network Award for Ex-cellence 2011 from Emerald Publishers for the paper titled ''A generic framework for colour texture image segmentation''. She was a member of Vision Systems Group, Centre for Image Processing and Analysis, School of Electronic Engineering, Dublin City University, Ireland. She has to her credit 27 peer reviewed research papers in reputed interna-tional journals and in conference proceedings. Her current research in-terest includes image segmentation (texture analysis, colour analysis), medical imaging, graph theory and big data analytics.
VeNkateswaraN NarasimhaNreceived his PhD from Anna University,
India in Signal and Image Processing. He received his M.Tech degree in Communication Systems from Pondicherry Engineering College, Pondicherry University in 1995. Currently, Dr. N. Venkateswaran is professor in the Department of Electronics and Communication Engi-neering at SSN college of EngiEngi-neering, India. Prior to June 2010, he had been Professor at Sri Venkateswara College of Engineering, India. He has more than 25 years of teaching, research and industry expe-rience. Dr. N. Venkateswaran has published more than 70 technical papers in various journals and conferences proceedings. His research interest includes signal and image processing, sparse signal representa-tion, wireless communications and its applications. He is senior mem-ber of IEEE and Fellow of IETE (India).
toshitha kaNNaNis an undergraduate student at SSN College of
Engi-neering, Kalavakkam, TamilNadu, India.
siNdhumadhuri moraPakalais an undergraduate student at SSN