VOLUME 17 ISSUE 1 (2019), Page 116 – 127
POTENTIAL UTILISATION MAPPING OF STATE-OWNED ASSETS IN THE FORM OF LAND AND BUILDING LEASE IN
PALANGKARAYA CITY
Helvita Dorojatun¹ & Edi Purwanto²
1,2The Directorate General of State Asset Management
MINISTRY OF FINANCE OF THE REPUBLIC OF INDONESIA
Abstract
This paper discusses on how the Directorate General of State Assets Management (DGSAM), as the state-owned asset manager, under the Ministry of Finance of the Republic of Indonesia, analyses the best suited strategy to map public assets. The tremendous amount of assets to be managed are scattered all over Indonesian archipelago. As one of the revenue centres for the nation, DGSAM needs to have more information about the feasibility of those assets. This study addresses the mapping of potential state-owned assets and measures the potential revenue to find out how much that can be generated from them. Asset mapping was done using geographical information system analysis, while the potential value of the appraised assets is calculated using artificial neural network. The study takes place in Palangkaraya, the largest city in this country, which might be the promising capital city of Indonesia in the near future. Based on the findings, it is clear that the government assets which can be exploited in Palangkaraya alone are about 14,302 m2 of land with the potential revenue of USD 86,040/year, and 141 rooms which are predicted to generate around USD 106,342/year, with appropriate occupancy rate in the market.
INTRODUCTION
The more assets utilised, the higher the revenue will be. Indonesian government is trying to increase non-tax revenue from its assets. The Ministry of Finance of the Republic of Indonesia (MoF) has assigned Directorate General of State Assets Management (DGSAM) to be one of the revenue centres, managing state-owned assets all over the archipelago. This study focuses on the mapping of those potential assets by collecting and analysing the information database of the assets to come up with the most effective in accordance to generate revenue. The performance depends on how much revenue can be obtained and the measurement of the revenue is the key factor. As a manager, DGSAM needs to employ a device which is able to measure how many total assets to be managed and how large the potential value they have.
One of the ways to manage state assets in order to generate revenue is by utilising those assets. In Indonesia, DGSAM issued the Government Regulation Number 6 in 2006 regarding the management of state -owned assets. The use of assets by DGSAM has been expanding rapidly since then. However, the institution has to complete the appraisal in one particular region first, before moving to other places. This situation is quite reasonable because Indonesian government has remarkable number of assets with various forms, scattered all over the country and they are highly dependent on the asset users’ proposals.
According to the regulation of the Minister of Finance, number: 57/PMK.06/2016, assets can be leased through a proposal from any ministries as the asset users. Then the proposal is examined and approved by DGSAM, which decides the lease by engaging the appraisers. The rates presented by a single valuer, is fair value over the rent through individual valuation. Unfortunately, due to the astounding number of the government assets, it takes a long time to produce the fair value. ‘Pricing a product is one of the most important decisions an organization can make’ (Lipovetsky, Magnan, & Polzi, 2011, p. 1). If the price of a product is too low, it is less likely to generate profit, but if it is too high, the potential customer might walk away.
There are two major challenges to address by DGSAM in this situation; how to determine assets that can be utilized and how to determine the value of the assets effectively. DGSAM should adopt knowledge discovery in database system to support efficient decision-making process in optimizing the assets. This motivates us to develop an integrated data mining techniques that can support the policy maker in making decision. By integrating the asset data in this research, it is possible for the government to find out how much the potential revenue that can be generated for each of the assets.
only 400,000 people in an area of 2,100 km2. Its economic growth is above the
national growth, which is around 7.4%-7.9% in 2017 with the inflation rate of less than 3.76% (Bank of Indonesia 2017). The Central Government assets of lands and buildings are the objects of the research. The utilisation of lands and buildings of public assets in this model is limited to business activities that generate income for the tenants.
Overview of Asset Use in Indonesia
Based on the regulation of the Minister of Finance, the use of land and building at lease are for three goals. Firstly, to optimise the utilisation of the idle land; next is to obtain additional supporting facilities on site of any public service, and lastly, to prevent the illegal ownership of the land and building. During the term of the lease, the government forbids tenants to rent back the premise and the process is done without disrupting the government duties and functions. Optimization of the idle land is appropriate with the use of land for retail locations such as stores and kiosks. Shops and kiosks are built on land with semi-permanent constructions so they are very flexible to be lifted after the period ends if the government needs to use the premise again.
BMN leased land and building in Indonesia might be used for many purposes, such as for ATM gallery, retail location, rental room, even for the base of the telecommunication tower. It suits the statement from Fanning (2005) who says that a specific location can have various possibilities of use in accordance with the highest occupancy rate and best use. To ensure that the legal element, which is one of the highest and best use (HBU) of the terms is met, we employed the land designation maps city of Palangkaraya as one way to select a state-owned land which can be leased. HBU is the reasonable calculation methods and it is likely to reach the highest value of the land after considering all possibilities which are allowed legally, physically and economically (Fisher & Martin, 1994). In this study, we limit the use of land and building only on lease for store, kiosk, and room. Simply because the demand on those choices is quite high and favourable in many locations. Based on the lease vacant proposal submission data at DGSAM branch office in Palangkaraya, state-owned land which can be leased has some characteristics: unoccupied, which is located on the side of the road; or land/building at government institutions, which gives service administration, and in health or education facilities. These characteristics are used in GIS analysis to select the location of the state-owned assets which can be utilized.
In 2017, it was noted that in Palangkaraya there were 37 government’s land sites which were rented to be constructed as kiosks or shops.
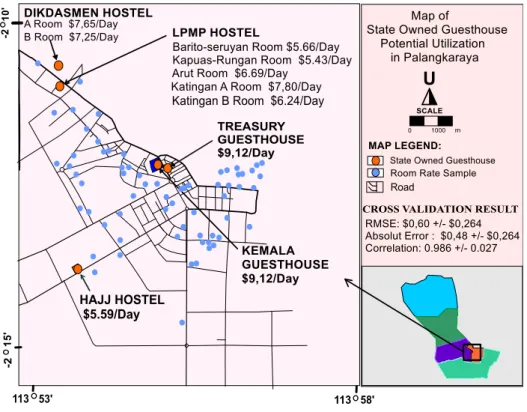
The primary aim of Indonesian government in building guesthouse is to provide a temporary residence for employees, facility for educational institution, or public facility for Hajj service. Based on the results of the revaluation of all the state-owned assets, there are 141 available rooms owned by Indonesian government in Palangkaraya which can be utilized. Yet, today’s proposal for guesthouse rent is only 48 rooms. The use of GIS in our model is to measure the attributes of the location and the accessibility of data training and the locations of the guesthouse.
Geographical Information System and Artificial Neural Network
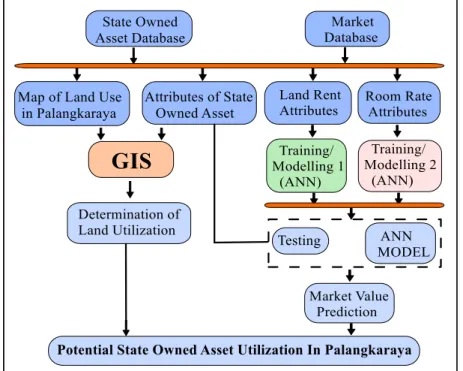
The number of data and information which have to be calculated in many places in the vast area requires us to use the accurate and fast technique of analysis. The one that we have chosen is the integration between geographical information system (GIS) and artificial neural network (ANN). GIS has advantages in displaying large number of data, where the visual display can facilitate the valuer to identify the outlier data (Linné & Cirincione 2010).
GIS in this study is employed to display on map the data of the land as well as the locations of the government buildings that can be rented through the selection of legal aspects which bind each state-owned land. It is also implemented to determine how the land can be used. Spatial analysis is useful to understand data through visualisation, to measure dimensions, to build a good rapport, to determine the best locations, to detect and quantify patterns in the data, and to make predictions (ESRI, n.d.) as well as to place information (Podor & Nyiri, 2010). GIS information integration into the process of mass modelling might allow the complete visualization of the valuation process (Linné & Cirincione 2010).
ANN can show better results than multi-variation analysis in non-linear network and it can even count the subjective information such as the characteristics of a zone that is hard to be analysed by existing mathematical approach (Chiarazzo, Caggiani, Marinelli, & Ottomanelli, 2014). ANN is unique because the sensible structure and algorithm model can emulate the comparative approach (Sarip, n.d.). ANN is used to predict rents because it has a reliable approach capability against nonlinearity on some variable, determining the value of the lease. By assuming a black box which contents are unknown, ANN will find the pattern of the relationship between input and output through a phase of training (learning). ANN analysis is determined by three things, namely; 1) architectural network 2) training and learning methods, and 3) activational functions.
database can help good seller or buyer to understand the influence of supply and sale indicated by the property which is available or has been bought.
ANN is a form of computation that has characteristic like the workings of the neural network in living things with the concept of neuron to process input/output. ANN has characteristic of human brain neural like remembering, counting, generalising, adapting, and being efficient.
METHODOLOGY
We have collected the data on the government assets through the programme of country's asset revaluation at the end of the year 2017. The programme required all fixed assets to be identified, mapped, and reassessed to update the national balance sheet of the Indonesian government. The data that were taken for this analysis were the asset geographical coordinates, surface area and the room in the government building which can be offered for rent.
The external data for GIS analysis was zoning plan and urban development of Palangkaraya, given by the local government. This map includes detailed spatial plan of urban areas until year 2035. We used this map to indicate that the utilisation of state-owned land was not conflicted with the legal aspects of current city planning. GIS was used to find public assets through the following stages:
i. We separated the state-owned land that was legally and economically cannot be used for the purpose of lease: military offices and some offices that were occupied by users less than 20 people per day.
ii. From those process results, we then also separated assets in the form of unoccupied land which were not on the zone of trade and services through an overlay between the state-owned land with the spatial city map of Palangkaraya.
iii. The location of those assets that can be utilized were shown by the results of the process of separation and overlaying while the land area that can be rented out, retrieved based on rule of thumb of state-owned assets which can be leased. They were 80m2 for 1 location of education, 56m2
for 1 parcel land of administration, health service, and vacant land. The relationship between the land and building becomes very close because of the competition in the market which will encourage optimal combination.
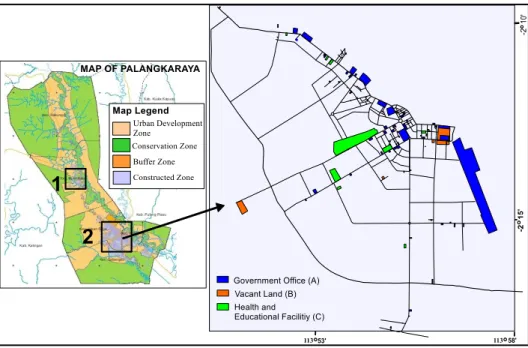
Figure 1: Research location
Market data was used as learning data to predict the reasonable value of the land for lease and rooms for rent. ANN analysis was used to describe the relationship between each independent variable (attribute), which influences rent value in a certain point and the most important variable of rent value was the location. Location analysis relates to the placement of spatial attribute and how this attribute is associated with a particular function (Fanning, 2005). The comparability of location may depend on the proximity to transport nodal point (Syace, Smith, Cooper, & Rowland, 2006).
The government land for rent, calculated with ANN, was based on the sales comparison approach. One of the techniques of data analysis suggested the sales comparison approach by Appraisal Institute (2008) is the analysis of the statistics. Sales comparison technique is the most common technique used in the valuation (Fisher & Martin, 1994) and applicable for all investment property (Sayce et al., 2006). This valuation technique focuses on the similarities and differences that affect the value (Appraisal Institute, 2008). Furthermore, it is used on active markets with a sufficient number of comparable information (Fisher & Martin, 1994).
Figure 2: Research framework
The data conversion process was conducted to generate data on the same form. Land and building rental information, for example, must be changed first into land rental rates by removing the portions of the building. Some valuation techniques that can be used to perform the separation is the residual land, allocation and extraction (see Fisher & Martin, 1994; Appraisal Institute, 2008). In this study, the value portion of land lease and building lease are considered to be equal to the portion of the value of the land and the value of the building. Some of the things that we saw in separating the portion of building are: 1) Data were taken by similar use that was commercial, 2) Data which were taken, were in large quantities, 3) Data were taken from the same zone, 4) Data property was estimated to be on the same timeframe because it greatly affected this separation technique.
Altogether, 121 land lease data and 90 room data were obtained. The attributes of land for rent and room rate are described in the Figure 3.
Figure 3: Land rent and room rate attributes in ANN scheme
RESULTS AND DISCUSSION
Through data processing, it is known that there are 2.15 km2 of land area of
state-owned assets in the city of Palangkaraya. Based on the overlaying analysis for the location of the assets, the state-owned properties, and the unfamiliar land using map in Palangkaraya, the information has shown that there is a vast land which is 14,302m2 that can be used for rent. The location of the lease land is
Figure 4: Map of state owned land potential utilisation in Palangkaraya Source: Primary data processing
We obtained the best results for the ANN model with parameter: hidden layer: Single layer, training cycle / Epoch: 1000, learning rate: 0.2, and momentum: 0.2. We set up the training cycle at 1000 to avoid over fitting phenomena where the formed network indicates less error in the training process but points out high errors in the validation. The Root Mean Square Error for land rent model is $0,776 +/- $0,161. The state revenues from land lease is shown in Table 2.
Table 2. The estimation revenue of state owned land utilisation Total area
(m2)
Land rent ($/m/Year)
Revenue
($/Year) Explanation
Office (A1 - A7) 392 2.23 – 9.79 1,627.92 7 locations
Vacant Land (B1-B12) 12,950 2.24 – 9.40 80,771.54
231 parcels in 12 locations Educational & Health
Facilities (C1 - C12) 960 3.02 – 4.54 3,640.67 12 locations
The State revenue from the land lease was calculated by multiplying the land rent value with surface area. In this calculation we took the assumption that the occupancy of land rent is 100%. As a result, a total revenue of land lease is $86,040.13/year
The buildings are available in four different sites, which have 141 rooms with various types. Based on the analysis of artificial neural network, the information of room rate value was retrieved. The Root Mean for room rate model is $0.60 +/- $0.264. Market value of room rate prediction based on ANN Model and cross validation result is shown in Figure 6.
Figure 5: Map of state owned guesthouse potential utilisation in Palangkaraya Source: Primary Data Processing
Table 3. The potential revenue of state owned guesthouse utilisation
Room Number of
room
Room rate ($/day)
Annual revenue with occupancy 31.55%
($/year) LPMP Hostel
Barito-Seruyan Room 16 5.66 10,436.77 Kapuas-Rungan Room 16 5.43 10,002.90
Arut Room 4 6.69 3,088.60
Katingan A Room 4 7.80 3,594.80 Katingan B Room 4 6.24 2,874.30 Dikdasmen Hostel
A Room 20 7.65 17,619.78
B Room 19 7.25 15,862.23
Treasury Guesthouse 4 9.12 4,198.72
Kemala Guesthouse 4 9.12 4,198.72
Hajj Hostel 50 5.99 34,470.34
TOTAL 106,342.55
CONCLUSION
Data mining can indicate the location and the magnitude of the potential value of the lease on the location of the area of study. The total effective of non-tax revenue from land for rent and guesthouse for rent in Palangkaraya is $192,382.68/year. We recommend that the DGSAM should take action to optimise land and building utilisation guided by this research. We hope DGSAM will develop this method in different cities and on different types of utilisation. We believe that the implementation of this method can accelerate DGSAM to become a revenue centre.
ACKNOWLEDGEMENT
We would like to thank the Directorate General of State Asset Management, Ministry of Finance of Indonesia, Mr. Joko Prihanto, the Head of DGSAM Regional Office in South and Central Kalimantan and Mr. Agus Sugiarto, the Head of DGSAM local office in Palangkaraya.
REFERENCES
Appraisal Institute (2008). The appraisal of real estate (13th Edition). Chicago: Author. Bank of Indonesia (2017). Kajian ekonomi dan keuangan regional provinsi Kalimantan
Tengah. Bank of Indonesia Regional Office of Central Kalimantan.
Badan Pusat Statistik [BPS]. (2018). Berita resmi statistik (No. 09/2/62/Th. XI, 1 February 2018).
environmental quality of property location. 17th Meeting of the Euro Working
Group on Transportation. July 2-4, 2014, Sevilla, Spain.
ESRI (n.d.). Analytics. Retrieved from http://www.esri.com/products/arcgis-capabilities/spatial-analysis
Fanning, F. S. (2005). Market analysis for real estate: concepts and application in valuation and highest and best use. Chicago, IL: Appraisal Institute.
Fayyad, U., Shapiro, G. P., & Smyth, P. (1996). From data mining to knowledge discovery in databases. AI Magazine,17(3), 37-54.
Fisher, J. D., & Martin, R. S. (1994). Income property valuation. Chicago, IL: Dearborn Real Estate Education.
Linne, M., & Cirincione, J. (2010). Integrating geographic information and valuation modelling for real estate. The Appraisal Journal, Fall 2010, 370 -378. Lipovetsky, S., Magnan, S., & Polzi, A. Z. (2011). Pricing models in marketing research.
Intelligent Information Management, 3, 167-174.
Podor, A., & Nyiri, J. (2010) GIS application in real estate investment. Scientific Journal of Riga Technical University - Economics and Business. Economy: Theory and Practice, 20, 94-99.
Sarip, A. G. (n.d.) Integrating artificial neural networks and GIS for single-property
valuation. Retrieved from
http://prres.net/Papers/Sarip_Integrating_Artificial_Neural_Networks _And.Pdf.
Sayce, S., Smith, J., Cooper, R., & Rowland, P. V. (2006) Real estate appraisal from value to worth. (n.p.): Blackwell Publishing Ltd