VOLUME 16 ISSUE 3 (2018) Page 197 – 207
THE DEMAND OF RECREATIONAL FACILITIES IN NEIGHBOURHOOD PARKS: VISITORS’ PERSPECTIVES
Ahmad Nazrin Aris Anuar1 & Nur Hafidzah Muhamadan2
Faculty of Architecture, Planning and Surveying UNIVERSITI TEKNOLOGI MARA, MALAYSIA
Abstract
The role of neighbourhood parks is becoming more significant to visitors as a recreational place. However, some recreational facilities are far from being preferred, thus become idle and unutilised. This study determines the demands for recreational facilities from the standpoint of the visitors. Hence, the objective of this study is to evaluate the demand for recreational facilities in a neighbourhood park. This study applied quantitative approach by using questionnaire survey to obtain data from visitors at five neighbourhood parks in the Petaling District. The findings showed that most respondents preferred “slightly agree” to “agree” and “slightly satisfied” to “satisfied” in regard to the demands of active and passive recreational facilities in neighbourhood parks. It is hoped that the findings of this study offer viable information for policymakers and planners in providing recreational facilities that are conducive in neighbourhood parks.
INTRODUCTION
The development policy of open space and recreation has been applied in the public parks by the relevant national authority. However, this planning and development policy has been interpreted in a different way, causing inconsistent execution at the state and local authority levels. This has created queries concerning the development of public parks, including the provision of a public park. The provision of a public park is still at a low standard and insufficient to cater to the demand of visitors due to its inappropriate placement. To resolve this predicament, the planning guidelines for open space and recreation need to be enhanced so as to ensure that the development of open space is more organised and meets the principles of urban planning and development. According to the Department of Town and Country Planning (2013), the scope of this guideline is more detailed on the aspects of the design principles, while the general guidelines are meant for the provision of open space and recreational areas. The provision of open space, including areas allowed to be used in all public parks, is under the supervision of local authorities. However, these guidelines are not specific to the recreational facilities mainly in the neighbourhood park, hence the question related to the demand for recreational facilities. This topic has been probed by several researchers, such as Cohen et al. (2007), Sakip, Akhir, and Omar (2015), as well as Anuar, Ahmad, Nasir, and Zainuddin (2016).
A number of neighbourhood parks are abandoned due to the lack of facilities desired by visitors. Lindberg and Shipperijn (2015) found that several facilities failed to match the needs of the users. This is because the facilities provided do not meet the visitors’ expectations (Anuar & Muhaidar, 2018). Those who participate in outdoor recreation activities expect to achieve specific outcomes, and subsequently evaluate if their recreation experiences are met (Oliver & DeSarbo, 1988; Graefe & Burns, 2013). Visitors typically favour specific park location, along with supporting facilities that best provide their preferred activities (Wolf, Wohlfart, Brown, & Lasa, 2015). These show that facilities in the park are a motivation to visit the park. Thus, studies on demand are essential to bridge the gap of knowledge pertaining to recreational facilities, particularly in neighbourhood park. Hence, the objective of this study is to evaluate the demand for recreational facilities in neighbourhood park.
LITERATURE REVIEW
national parks, district parks, urban parks, local parks, and neighbourhood parks (Department of Town and Country Planning, 2013). The public park development needs to consider various factors of planning and management based on safety, comfort, and accessibility aspects (Anuar et al., 2016). The park management needs to ensure the cleanliness of the surrounding area and to control environmental pollution. Public parks should also be placed in accessible areas to facilitate the users. Besides, a public park must be functional as a buffer or separator zone from natural disasters. At the same time, the planning principles also advocate the need to create green environment in urban areas, as well as to create harmonious society by encouraging social interaction among the people. All these criteria should be incorporated in developing a neighbourhood park. Although the neighbourhood park is smaller than other public parks, the function remains the same; for the visitors to perform leisure and physical activities, as desired by the visitors and based on the facilities made available.
A neighbourhood park is an attraction for visitors to undertake physical activities and relieve stress after a hard day's work. Several researchers agreed that parks contribute not only to physical activities, but also in terms of the social well-being of their community, enhance property value, and improve public health (Kaczynski & Henderson, 2008; Sakip et al., 2015). Apart from that, parks give valuable significance to the image of the city, wherein urban green spaces create and strengthen the positive image of the community and the entire city (Jerke, Porter, & Lassar, 2008; Schwab, 2009; Balch, 2011; Chan, Peters, & Marafa, 2015). The importance of neighbourhood parks to visitors is always related to improving the aspect of social interaction amongst the community. Sakip et al., (2015) claimed that accessible parks can improve social cohesion and interaction as more people patronise them. Therefore, the recreational facilities in neighbourhood parks must meet visitors’ expectations, as it is also a focal point for leisure and social bonding. There is a requirement of a neighbourhood park to always supply recreational facilities in line with visitors’ requirements. According to Wolf et al., (2015), parks need to supply experiences and facilities consistent with the demand to satisfy visitors’ expectations and to protect natural resources from oversupply. Park facilities must meet the visitors’ demand to utilise the space sufficiently. In order to avoid a park from being abandoned, the public park planning must be sensitive and adhere to the visitors’ demands. Therefore, it is essential to provide preferable facilities to maximise space utilisation.
RESEARCH METHOD
Study Area
of local authorities of Shah Alam City Council, Petaling Jaya City Council, and Subang Jaya Municipal Council, were identified as the sample (Table 1).
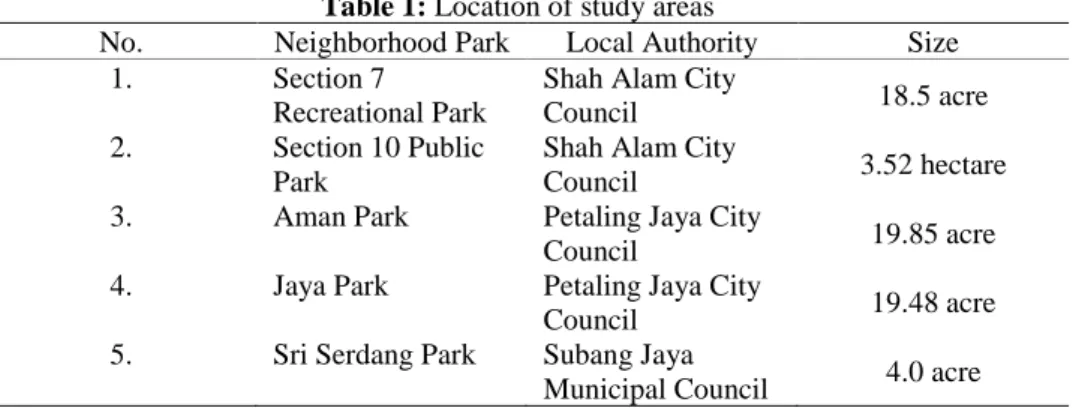
Table 1: Location of study areas
No. Neighborhood Park Local Authority Size
1. Section 7
Recreational Park
Shah Alam City
Council 18.5 acre
2. Section 10 Public
Park
Shah Alam City
Council 3.52 hectare
3. Aman Park Petaling Jaya City
Council 19.85 acre
4. Jaya Park Petaling Jaya City
Council 19.48 acre
5. Sri Serdang Park Subang Jaya
Municipal Council 4.0 acre
Questionnaire Survey and Sampling of Respondents
The quantitative approach was used to evaluate the demand for recreational facilities in the selected neighbourhood park from the standpoint of the visitors. This approach was selected based on the retrieved data. Therefore, a purposive sampling technique under non-probability sampling had been used in this research. A total of 250 visitors from the five neighbourhood parks in Petaling District were chosen as respondents in this study.
Method of Analysis
The data from the quantitative survey were analysed using SPSS version 20.0. The ordinal and nominal data were scrutinised to obtain results in terms of frequency, percentage, and mean score, so as to meet the outlined objectives.
RESULTS AND FINDINGS
Demand of Recreational Facilities in Neighbourhood Park.
The types of recreational facilities were evaluated based on active and passive activities. The highest mean represents the preferable facilities provided to the visitors. However, the list of recreational facilities provided in the neighbourhood park differed between each neighbourhood park. The results without mean score signified the absence of facilities in the studied neighbourhood parks.
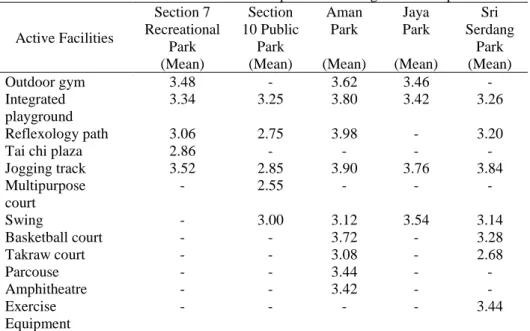
Active Recreational Facilities
This result shows the awareness towards healthy living among the community in Petaling District. However, the integrated playground was the highest active recreational facility that met the demand of visitors in Section 10 Public Park with a mean score of 3.25. Aman Park, equipped with a reflexology path, had the highest active recreational facilities that met the demands of the visitors with a mean score of 3.98. Most of the visitors agreed with the active recreational facilities provided by the local authority ranging from “slightly agree” to “agree”. These mostly motivated the visitors to spend time at the neighbourhood park.
Table 2: Active recreational facilities provided in neighbourhood park
Active Facilities
Section 7 Recreational
Park (Mean)
Section 10 Public
Park (Mean)
Aman Park
(Mean)
Jaya Park
(Mean)
Sri Serdang
Park (Mean)
Outdoor gym 3.48 - 3.62 3.46 -
Integrated playground
3.34 3.25 3.80 3.42 3.26
Reflexology path 3.06 2.75 3.98 - 3.20
Tai chi plaza 2.86 - - - -
Jogging track 3.52 2.85 3.90 3.76 3.84
Multipurpose court
- 2.55 - - -
Swing - 3.00 3.12 3.54 3.14
Basketball court - - 3.72 - 3.28
Takraw court - - 3.08 - 2.68
Parcouse - - 3.44 - -
Amphitheatre - - 3.42 - -
Exercise Equipment
- - - - 3.44
Note: (-) means not available in that particular neighbourhood park
Passive Recreational Facilities Provided in Neighbourhood Park
Table 3: Passive recreational facilities provided in neighbourhood park Passive Facilities Section 7 Recreational Park (Mean) Section 10 Public Park (Mean) Aman Park (Mean) Jaya Park (Mean) Sri Serdang Park (Mean)
Gazebo 3.26 3.65 3.48 3.72 3.18
Picnic table 3.06 - - 3.88 3.60
Benches 3.16 3.40 3.62 3.90 3.72
(-) means not available in that particular neighbourhood park
The Condition of Recreational Facilities Provided in Neighbourhood Park Table 4 shows the condition of active recreational facilities provided in the neighbourhood park. The condition of the outdoor gym obtained the highest mean score of 3.40 at Section 7 Recreational Park. However, the integrated playgrounds in Section 10 Public Park and Jaya Park were in a satisfying condition with mean scores of 3.20 and 3.70. The Aman and Sri Serdang Parks, which had jogging tracks, had the highest mean scores of 4.02 and 3.92. The condition of the facilities was “slightly satisfied” and “satisfied” for the neighbourhood parks, respectively.
Table 4: The condition of active recreational facilities provided in neighbourhood park
Active facilities Section 7 Recreational Park (Mean) Section 10 Public Park (Mean) Aman Park (Mean) Jaya Park (Mean) Sri Serdang Park (Mean)
Outdoor gym 3.40 - 3.64 3.42 -
Integrated playground
3.30 3.20 3.66 3.70 3.30
Reflexology path 3.04 2.80 3.96 - 2.84
Tai chi plaza 2.72 - - - -
Jogging track 2.98 2.85 4.02 3.46 3.92
Multipurpose court
- 3.05 - - -
Swing - 2.95 3.38 3.54 3.16
Basketball court - - 3.40 - 2.94
Takraw court - - 3.60 - 2.66
Parcouse - - 3.64 - -
Amphitheatre - - 3.42 - -
Exercise Equipment
- - - - 2.90
Note: (-) means not available in that particular neighbourhood park
Section 10 Public Park, Aman Park, and Jaya Park, most of the visitors were slightly satisfied with the condition of benches with the highest mean scores of 3.40, 3.76, and 3.98. The visitors were indeed satisfied with the facilities provided in these neighbourhood parks, either “slightly satisfied” or “satisfied”. Based on the observations made, the condition of the facilities, sometimes, appeared challenging to maintain due to vandalism and constricted budget from the local authorities.
Table 5: The condition of passive recreational facilities provided in neighbourhood park
Passive Facilities
Section 7 Recreational
Park (Mean)
Section 10 Public
Park (Mean)
Aman Park
(Mean)
Jaya Park
(Mean)
Sri Serdang Park
(Mean)
Gazebo 3.20 3.30 3.56 3.78 3.44
Picnic table 3.08 - - 3.72 3.22
Benches 3.04 3.40 3.76 3.98 3.38
(-) means not available in that particular neighbourhood park
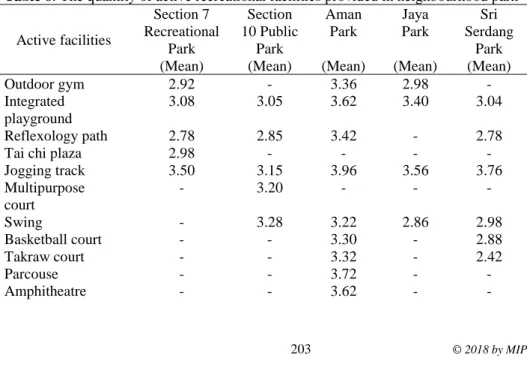
The Quantity of Recreational Facilities Provided in Neighbourhood Park Table 6 shows the quantity of active recreational facilities provided in the neighbourhood parks. The quantity of the jogging tracks in Section 7 Recreational Park, Aman Park, Jaya Park, and Sri Serdang Park is reasonable and adequate with mean scores of 3.50, 3.96, 3.58, and 3.76. Most of the visitors “slightly agreed” and “agreed” with the quantity of jogging tracks provided as they were sufficient, adequate, and fulfilled the demands of the visitors.
Table 6: The quantity of active recreational facilities provided in neighbourhood park
Active facilities
Section 7 Recreational
Park (Mean)
Section 10 Public
Park (Mean)
Aman Park
(Mean)
Jaya Park
(Mean)
Sri Serdang
Park (Mean)
Outdoor gym 2.92 - 3.36 2.98 -
Integrated playground
3.08 3.05 3.62 3.40 3.04
Reflexology path 2.78 2.85 3.42 - 2.78
Tai chi plaza 2.98 - - - -
Jogging track 3.50 3.15 3.96 3.56 3.76
Multipurpose court
- 3.20 - - -
Swing - 3.28 3.22 2.86 2.98
Basketball court - - 3.30 - 2.88
Takraw court - - 3.32 - 2.42
Parcouse - - 3.72 - -
Exercise Equipment
- - - - 3.10
Note: (-) means not available in that particular neighbourhood park
Table 7 illustrates the quantity of passive recreational facilities provided in the neighbourhood parks. Section 7 Recreational Park had picnic tables, thus was awarded with the highest mean score of 2.90 due to its quantity. Next, Section 10 Public Park and Jaya Park had most of the visitors to slightly agree with the gazebos made available with the highest mean scores of 3.25 and 3.86. In Aman and Sri Serdang Parks, most of the visitors slightly agreed with the number of benches provided with mean scores of 3.68 and 3.82. Therefore, most of the visitors appeared to “slightly agree” and “agree” with the number of passive facilities, except in Section 7 Recreational Park, as they felt that the number of passive facilities should be added based on their preferred activities.
Table 7: The quantity of passive recreational facilities provided in neighbourhood park
Passive Facilities
Section 7 Recreational
Park (Mean)
Section 10 Public
Park (Mean)
Aman Park
(Mean)
Jaya Park
(Mean)
Sri Serdang
Park (Mean)
Gazebo 2.88 3.25 3.54 3.86 3.38
Picnic table 2.90 - - 3.64 3.24
Benches 2.78 3.15 3.68 3.80 3.82
Note: (-) means not available in that particular neighbourhood park
The Placement Recreational Facilities Provided in Neighbourhood Park Table 8 presents the placement of active recreational facilities provided in the neighbourhood parks. Most of the visitors favoured the placement of jogging tracks with the highest mean score for all types of neighbourhood parks in Petaling District. This shows that most visitors “slightly agreed” and “agreed” with the placement of active recreational facilities provided by the local authority. In Table 8, most of the visitors “did not agree” with the placement of sports facilities, such as reflexology path, tai chi plaza, multipurpose court, and takraw court. They felt that these sports facilities are inappropriately placed and unused.
Table 8: The placement of active recreational facilities provided in neighbourhood park
Active facilities
Section 7 Recreational
Park (Mean)
Section 10 Public
Park (Mean)
Aman Park
(Mean)
Jaya Park
(Mean)
Sri Serdang
Park (Mean)
Outdoor gym 3.28 - 3.78 3.68 -
Integrated playground
3.28 3.05 3.86 3.66 3.04
Tai chi plaza 2.96 - - - -
Jogging track 3.38 3.25 4.24 3.70 3.86
Multipurpose court
- 2.95 - - -
Swing - 3.56 3.60 3.56
Basketball court - - 3.40 - 3.22
Takraw court - - 3.70 - 2.64
Parcouse - - 3.68 - -
Amphitheatre - - 3.70 - -
Exercise Equipment
- - - - 3.28
(-) means not available in that particular neighbourhood park
Table 9 illustrates the placement of passive recreational facilities provided in the neighbourhood parks. These passive facilities are an option for visitors to relax and appreciate nature. Thus, it is a priority to place these facilities in an appropriate and accessible area. Therefore, Section 7 Recreational Park revealed the highest mean score of 3.58 for its placement of picnic tables. Meanwhile, in Section 10 Public Park, Jaya Park, and Sri Serdang Park, most visitors selected the benches placement with the highest mean scores of 3.40, 4.02, and 3.80, respectively. The results in Aman Park showed that a majority of the visitors agreed with the placement of the gazebos with a mean score of 3.94. This showed that most of the visitors “slightly agreed” and “agreed” with the placement of passive recreational facilities in the five studied neighbourhood parks.
Table 9: The placement of passive recreational facilities provided in neighbourhood park
Passive Facilities
Section 7 Recreational
Park (Mean)
Section 10 Public
Park (Mean)
Aman Park
(Mean)
Jaya Park
(Mean)
Sri Serdang
Park (Mean)
Gazebo 3.06 3.20 3.94 3.84 3.36
Picnic table 3.58 - - 3.50 3.56
Benches 2.86 3.40 3.58 4.02 3.80
Note: (-) means not available in that particular neighbourhood park
SUMMARY AND CONCLUDING REMARKS
neighbourhood park should suit the area and support the activities frequented by its visitors to meet their recreational demands. The respondents defined recreational facilities based on active and passive activities. The findings for Section 7 Recreational Park showed that the respondents demanded more active recreational facilities. As for the Section 10 Public Park, the respondents preferred passive recreational facilities, such as a rest area, to release stress. The findings in Aman Park were more towards active recreational facilities with reflexology path and a jogging track, which appeared to be the highest demands from the visitors. The results for Jaya Park showed that the respondents preferred passive recreational facilities as the highest demand, while the Sri Serdang Park visitors were happy with active recreational facilities as the highest demand. The results are further supported by the following statement provided by the respondents:
“At section 7, most of the residents are young people. They like jogging most of the time when visiting the neighbourhood park” (25 years old, Malay).
“Supposedly, more facilities in this park can be used by all age groups. It will offer a variety of games in the public park” (34 years old, Malay).
Therefore, the type of recreational facilities differs depending on the needs of the visitors. The availability of the recreational facilities, such as condition, quantity, and placement, is related to the park use and park visitation. Overall, this study contributes in extending the knowledge and practice in the field of park and facility management.
REFERENCES
Anuar, A. N. A., & Muhaidar, F. S. (2018). The procurement method used for maintenance in public park: Local authority perspectives. Journal of Engineering and Applied Sciences, 13(6), 1451-1461.
Anuar, A. N. A., Ahmad, C. B., Nasir, R. A., & Zainuddin, Z. N. M. (2016). The development of friendly public park benchmarking: A qualitative study. The Social Sciences, 11(20), 4970-4976.
Balch, C. (2011). Great cities don’t just happen: they are made! In B. M. Evans, F. McDonald, & D. Rudlin, (Eds.), Urban Identity. Abingdon, Oxon: Routledge. Chan, C. S., Peters, M., & Marafa, L. M. (2015). Public parks in city branding:
Perceptions of visitors vis-à-vis residents in Hong Kong. Urban Forestry & Urban Greening, 14(4), 1157-1165.
Department of Town and Country Planning (2013). Garis panduan perancangan tanah lapang dan rekreasi. Kuala Lumpur: Kementerian Perumahan dan Kerajaan Tempatan.
Graefe, A. R., & Burns, R. C. (2013). Testing a mediation model of customer service and satisfaction in outdoor recreation. Journal of Outdoor Recreation and Tourism, 3, 36-46.
Jerke, D., Porter, D. R., & Lassar, T. J. (2008). Urban design and the bottom line: Optimizing the return on perception. Washington DC: Urban Land Institute. Kaczynski, A. T., & Henderson, K. A. (2008). Parks and recreation settings and active
living: A review of associations with physical activity function and intensity. Journal of Physical Activity & Health, 5(4), 619-632.
Lindberg, M., & Schipperijn, J. (2015). Active use of urban park facilities - Expectations versus reality. Urban Forestry & Urban Greening, 14(4), 909-918.
Oliver, R., & De Sarbo, W. S. (1988). Response determinants in satisfaction judgments. Journal of Consumer Research, 14(4), 495-507.
Sakip, S. R., Akhir, N. M., & Omar, S. S. (2015). Determinant factors of successful public parks in Malaysia. Procedia-Social and Behavioral Sciences, 170, 422-432. Schwab, J. (2009). Planning the urban forest: Ecology, Economy and Community
Development. Chicago, IL: American Planning Association.
Wolf, I. D., Wohlfart, T., Brown, G., & Lasa, A. B. (2015). The use of public participation GIS (PPGIS) for parks visitor management: A case study of mountain biking.