Motorproblems and Laterality in a Childpsychiatric Population and the Relation with Language-, and Math Performance.
Alexandra Voorthuis Universiteit Leiden
Developmental Psychopathology in Education and Child Studies Clinical Practice and Research Master
Supervised by Mw. Prof. Dr. J.T. Swaab-Barneveld Second reader: Dr. K.B. van der Heijden
Objective: In this study we addressed the questions (1) whether there is a relation between the specialization of the brain and psychopathology, and (2) if there is a relationship between the specialization of the brain and performance on different academic measures. Method: We used the Finger Tapping Task (FTT) to assess maturation of the brain as measured by fine motor speed, and lateralization of the brain as measured by the difference in speed between both hands. Both maturation and lateralization are used as a measure of specialization of the brain. The participants were children in the age of 5 to 18 years old and were assigned to five distinct diagnostic groups: Mood problems (n=178), Behavior problems (n=82), Autism spectrum Disorders (n=106), Attention Deficit Hyperactivity Disorder (n=190) and Learning problems (n=44). The diagnostic groups differ with regard to age and gender. Results: We found that children with an autism spectrum disorder show delayed fine motor lateralization. We were also able to determine that the differences in fine motor speed between the different diagnostic groups get larger with age indicating that delayed maturation gets more evident while children get older. Looking at the academic measures, we found that a more matured brain, as measured with fine motor speed, is associated with better academic performance, even when controlled for age. Conclusion: Autism spectrum disorders can be differentiated from other disorders when looking at lateralization of the brain. A more matured brain is associated with a significant higher level of academic performance for math, reading and writing.
In the developing brain, there are several spurts in anatomical growth, like in infancy, at the age of 7-10 years and a final important spurt during early adolescence (Anderson, Northam, Hendy, & Wrennall, 2005). In concordance with this anatomical growth, the
cognitive development also shows a stage-like development that is roughly consistent with the cerebral development (Anderson, Northam, Hendy, & Wrennall, 2005). An important aspect of this development is the specialization of the brain (Anderson, Northam, Hendy, &
Wrennall, 2005). Specialization of the brain is achieved by roughly four growth mechanisms, first the development of cell bodies; second, the selective cell death; third dendritic and axon growth and fourth the formation of synaptic connections (Anderson, Northam, Hendy, & Wrennall, 2005). Building up to a specific network architecture to support behavior, one aspect of specialization is the difference between the left and right hemisphere in both
anatomy and in function (Kolb, & Whishaw, 2009). The specialization of the hemispheres can be referred to as lateralization. More specific, lateralization of function refers to qualitative differences between the hemispheres in the nature of processing information and controlling different behavior (Bradshaw & Nettleton, 1983; Kolb, & Whishaw, 2009). The distinction between the left and right hemisphere is characterized by the left hemisphere being
predominantly involved in language processing and performing analytic and sequential actions, and the right hemisphere being dominant in a more “holistic” processing style when performing mental tasks entailing spatial and synthetic acts (Kolb, & Whishaw, 2009; Anderson, Northam, Hendy, & Wrennall, 2005; Bradshaw & Nettleton, 1983). The lateralization process is a developmental process in which the specialization of the brain increases with age (Anderson, Northam, Hendy, & Wrennall, 2005). This specialization of the brain results in more efficiency in processing and is one of the factors that supports coping with developmental tasks. Lateralization is therefore an important way to determine the quality of the development of the brain of children.
hypothesis is one of many ways to explain this phenomenon by implying that when a hemisphere assumes additional functions, some of its normal functions will be adversely affected.
Developmental Dyslexia is an example of a developmental disorder that is known to have abnormalities in lateralization (Njiokiktjien, 2004; Wijers, Been, & Romkes, 2005; Penolazzi, Spironelli, & Angrilli. 2008; van Herten, Pasman, Leeuwen, Been, van der Leij, Zwarts, & Maassen. 2008). Other examples of developmental disorders that have problems in lateralization are Schizophrenia, Autism and Attention Deficit Hyperactivity Disorder
(ADHD). Schizophrenia, for example, is referred to as a disorder with cerebral lateralization abnormality (Dane, Yildirim, Ozan, Aydin, Oral, Ustaoglu, et al., 2008); schizotypical traits are thought to be characterized by abnormal brain lateralization (Bleich-Cohen, Hendler, Kotler, Strous, 2009; Asai, Sugimori, & Tanno, 2009; Somers, Sommer, Boks, & Kahn, 2009) and Crow et al (1996) demonstrated that children who later develop a schizophrenic illness showed increased ambidexterity at age seven and less strong right-handedness at age eleven, indicating an relation with handedness (Crow, Done, & Sacker, 1996). These results suggest that this might be a possible early indicator of disoptimal brain development. There are also several indications for abnormal functional hemispheric asymmetry in the brain of people with autism (Lazarev, Pontes, Mitrofanov & deAzevedo, 2010; Anderson et al, 2005; Stroganova, Nygren, Tsetlin, Posikera, Gillberg, Elam, et al., 2007). In high-functioning autistic people with disordered early language development, significantly reduced rates of established left or right hand preference were found (Escalante-Mead, Minshew, & Sweeney., 2003). Research focusing on attention deficit hyperactivity disorder (ADHD) also revealed structural and functional lateralization abnormalities (Roessner, Banaschewski, Uebel, Becker, & Rothenberger. 2004).
Summarizing the above, the developing brain gets more specialized with age and when abnormalities in the specialization process are found, there might be a correlation with a higher risk for psychopathology.
A way to explore lateralization is to use the Finger Tapping Test (FTT) which is an indicator of processing speed and can be used as an indicator of lateralized function
result of brain impairment (Prigatano, & Borgaro, 2003) and a large difference between both hands indicates brain damage contralateral to the lowered hand (Prigatano & Wong, 1997). The most important difference between the impairments in lateralization in TBI and developmental disorders is the fact that the TBI patients had a normal development of the brain and the problems in lateralization occurred after a trauma, while in developmental disorders, the development of the brain shows abnormalities. When looking at typical developing children, the fine motor speed as measured by the FTT increases with age (Rosselli, Ardila, Bateman, & Guzman, 2001) and can thereby be used as an indicator of development of the brain. Next to differences in age, earlier studies found significant differences in fine motor speed in gender, with males outperforming females in adulthood (Bornstein, 1987). Rosselli also found this difference in children in the age of 6 to 11 years, with boys outperforming girls with the nonpreferred hand (Rosselli et at., 2001).
The findings with regard to age indicate that a more specialized brain will be reflected by increased maturation, as measured by fine motor speed, and increased
lateralization that, in turn, is reflected by a larger difference in fine motor speed between both hands. In the present study the focus is on whether children with developmental disorders show abnormal brain development, as reflected in maturation and fine motor lateralization. Assuming that maturation and lateralization of the brain is reflected in cognitive development, we also look at how the measures of maturation and fine motor lateralization are related to academic achievement. The first question is whether children with different psychiatric disorders can be differentiated based on brain maturation and functional lateralization. Several studies have found abnormalities in motor-asymmetries and lateralization in developmental disorders, that are supposed to involve brain maturation problems, such as dyslexia and autism, and since no study was found reporting these lateralization problems in other psychiatric disorders such as mood disorders or behavioral problems, the hypothesis is that children with a developmental disorder show less maturation of the brain as seen in reduced fine motor speed, and less lateralized fine motor skills than children with other psychiatric disorders such as mood disorders or behavior problems. Because research on developmental dyslexia suggests a relation between abnormal maturation of the brain that might be reflected in abnormal lateralization and language problems, and earlier research on autism and
(1989) found that the neuropsychological status, as measured with the Luria-Nebraska Neuropsychological Battery (LNNB) that includes tappingmeasures, predicts not only a percentage of variance in reading, but also a percentage of variance in math (Tramontana, Hooper, Curley, & Nardolillo, 1989). So we also wanted to know whether there is a relation between brain maturation and fine motor lateralization, and achievement on mathematical tasks. Since several studies have reported relationships of performance on academic tasks and motor development and lateralization, it is expected that there will be a relation between maturation- and lateralization of the brain and achievement on linguistic and math tasks.
Previous studies have examined differences in maturation- and lateralization of the brain for different populations but have not studied children with different psychiatric
diagnoses and the relationship with language and math problems. In this study tapping scores of the FTT are analyzed as measures of brain maturation and lateralization, to be able to look at the level of maturation and lateralization and its relation to psychopathology and academic achievement. This way, this study will provide information about different child psychiatric disorders and the maturation of the brain, partly reflected in lateralization, as measured with a performance task. It will also give some insight in how these measures of maturation and lateralization are related to the performance in academic linguistic tasks and math tasks.
Method Participants
Participants were selected out of a sample of 1190 children who were referred between 1991 and 2008 to Curium, Child and Adolescent Psychiatric Clinic in the Netherlands. To these children, aged between 5 and 18 years, the Finger Tapping Test (FTT) was
administered. Since the FTT is not administered to all referred children, the participants were only a small part of all referrals. Up until 2002, the FFT is part of the standard psychological screening, so all children that needed psychological examination also were administered the FTT. After 2002 psychological examination including the FTT, was only done when problems in the area of ADHD, ASD or learning problems were expected.
learning problems were selected (n=914). After exclusion of the children with missing IQ data and children with an IQ lower than 70, the group consisted of 634 children. Gender,
diagnoses, age, IQ and handedness are given in table 1.
Diagnostic groups. Participants are assigned to one of five distinct diagnostic groups. To be able to identify five groups, we looked at the DSM classification of the child. Children with an autism spectrum disorder were selected first and taken together in the ASD-group. Next, children with ADHD were selected for the ADHD-group. After this, the children with a primary diagnose of a learning disability were selected as part of the LP group, children with a primary diagnoses of behavior disorder were selected as part of the BP group and children with a primary diagnoses of a mood disorder were selected as part of the MP group.
The data of the psychological assessment was collected in a data-base together with primary diagnoses, date of birth, date of the assessment and gender of the child.
Procedure
The assessment included: an interview with the parents; the developmental history; the Dutch version of the Anxiety Disorders Interview Schedule DSM-IV (ADIS-C) (Siebelink, & Treffers, 2001) with parents and children; the Strengths and Difficulties Questionnaire (SDQ) (Treffers, Van Widenfelt, & Goodman, 2005) filled in by parents and teachers; the Groninger Gedragslijst Schoolsituatie (Kalverboer, 1988); and an interview/observation of the child by the child psychiatrist. The ADIS was only used after 2001, and the SDQ was used since 2005. If needed, children were subjected to further psychological examination. The psychological examination was done by trained and experienced child psychologists. The psychological examination that included neuropsychological examination has a duration of 4 hours to 6 hours and is spread over two days with one day for the IQ test and the other day for neuropsychological examination. Some children were also subjected to didactical
examination. Classification according to the Diagnostic Statistic Manual with the DSM-III-TR, DSM-IV and DSM-IV-TR (American Psychiatric Association, 1987; American Psychiatric Association, 1994; American Psychiatric Association, 2000) was based on psychiatric examination that included the development history of the child, an interview with the parents, an interview with the child and an observation of the child.
Independent Measures
WISC-III (Kort, Schittekatte, Bosmans, Compaan, Dekker, Vermeir, & Verhaege, 2005), the WPPSI (Vander Steene, & Bos, 1997), and the RAKIT (Bleichrodt, Drenth, Zaal, & Resing, 1984) are used. For three children it is unknown if they were assessed by the WISC, the WPPSI or the RAKIT and they are classified as unknown. For all IQ tests, the Total IQ score is used in the analyses. Preliminary analyses showed that the TIQ of the Wechsler’s scales, the Rakit and the scores on “other” are not significantly different, so the TIQ of the all IQ tests is used in the analyses without specification for sort of IQ-test.
Academic measures. The didactic age (DL) is the amount of months a child has had education. The didactic age equivalent (DLE) is the level of a certain test or the level of working material, expressed in the amount of months of education needed for each level (Struikstra, Van der Leij, & Vierijra, 1995). The “learning efficiency” [leerrendement] (LR) is the relation of DL with DLE (DLE/ (DL/100)) and is expressed in percentages (Struikstra, Van der Leij, & Vierijra, 1995). A LR of 100% means that the DLE and the DL are equal and the child is exactly on schedule. A LR of 50% means that the child has a DLE that is half his DL, meaning his performance is 50% less than may be expected at his age. A LR above the 100% means that the child is better than can be expected by his didactic age (Struikstra, Van der Leij, & Vierijra, 1995).
The “AVI” test (Visser, Van Laarhoven, & Ter Beek, 1994) is used as a measure of language abilities, more specific the technical reading skills of a text (Evers, Van Vliet-Mulder, & Groot, 2000). The didactic age range is 5 to 30 months, and the test has an A- and B-version, each with cards for the nine reading levels (Evers, Van Vliet-Mulder, & Groot, 2000). The test score is determined by the speed of reading and the mistakes, and is recoded into DLE scores. The reliability of the test is average (Evers, Van Vliet-Mulder, Resing, Starren, van Alphen de Veer, Van Boxtel, 2002).
The “PI-dictee” (Geelhoed, Bos, & Kappers, 1994) is also a measure of language abilities, more specific for writing skills. The writing of separate words is the central focus and the didactic age range is 0 to 60 months (Evers, Van Vliet-Mulder, & Groot, 2000). The PI-dictee is a Dutch test that contains two parallel tests, form A and B. The words are presented in a sentence, and the participant has to write the word down. The number of right written words is the raw score, and with use of tables, these scores are recoded into DLE scores (Evers, Van Vliet-Mulder, & Groot, 2000). The reliability of this test is average (Evers., et al, 2002).
answers is added and with the use of tables these scores are recoded into a DLE score. (Evers., et al, 2002).
Hand preference and handdominance. Hand preference was assessed by a questionnaire titled “Questionnaire Lateral Preference” [Vragenlijst laterale
voorkeur](Academisch Ziekenhuis Groningen, 1984). This is a Dutch questionnaire with 10 items asking participants about their hand preference, 4 items about their feet preference, 4 items about their ear preference and 4 items about their eye preference. For this study only the part for obtaining hand preference is used to determine whether a person is either left-handed, right-handed or ambidextrous. The participants were asked which hand they use for certain tasks such as brushing their teeth. In addition to handpreference assessed by a questionnaire, handdominance was based on the Finger Tapping Test. The hand with the highest mean speed was coded as the dominant hand.
Dependent Measures
as part of the Korean Computerized neurobehavioral tests (KCNT) was evaluated and proved to be highly reliable (nondominant hand; r= .89, dominant hand; r= .85) (Sakong, Kang, Kim, Hwang, Jeon, Park, Lee, Won, et al. 2007). The tapping test of the KCNT measures the amount of taps in ten seconds and is in that regard comparable with the FTT of the Fepsy. As for the effect of age, it is reported that before the age of six, the hand preference is unstable and depending on the situation (Bryden, Pryde, & Roy. 2000) and between the 5th and the 7th year, the speed keeps increasing but the relative difference between the hands is stable (Nijokitijen, Kurgansky, Vildavsky, e.a. 1997).
Difference score. The difference score between both hands was used as a measure of lateralization. The “raw” difference score was calculated by extracting the mean from the nondominant hand of the mean of the dominant hand. To be able to compare the difference scores of the children as a dependent measure of the achievement with both hands, the
“corrected” difference score was calculated by dividing the “raw” difference score by the sum of the mean of the nondominant and the mean of the dominant hand. Both the “raw”
difference score and the “corrected” difference score are used in the analyses.
Fine Motor Speed. Fine motor speed was used as a measure of maturation. Because the FTT has five trials for each hand, we were able to look at how consistent the tappingscore of one hand was over five trials and if this was the same for all diagnostic groups. If there is no difference for the different diagnostic groups, we can use the mean tappingscore as a measure of fine motor speed.
Statistical Analyses
Several analyses were done to be able to determine if there were differences in
diagnostic groups with regard to the demographic variables (gender, handdominance, age and IQ). To be able to look at whether al diagnostic groups have the same proportions with regard to gender, nonparametric Chi-square tests are done. In order to find out if the diagnostic groups differ with regard to age and IQ, several one-way ANOVA’s were done. A Crostab is made to look if the hand reported as preferred hand, as measured by the questionnaire, is also the dominant hand as measured with the FTT. For all further analyses, the dominant hand based on the tapping is used and not the preferred hand based on the questionnaire.
Preliminary analyses were done in order to decide which variables need to be taken into account in the main analyses. Because the analyses were done with the mean
analysis is repeated with diagnosis as between-subject factor to be able to look if the difference between the five trials is the same for the different diagnostic groups. If no significant difference between the diagnostic groups is found, the mean tapping score can be used as a representative measure of speed. To be able to determine whether age has an influence, a repeated measure analysis with age as covariate and mean of dominant hand and mean of nondominant hand as dependent variables is done. Looking at whether all diagnostic groups have the same proportions with regard to handdominance, nonparametric Chi-square tests are done. An independent t-test is done to be able to determine whether there is a difference in tappingscores for the left/right-handers and a correlation between IQ and tappingscore is calculated to be able to determine whether IQ is an influential variable.
To answer the research question, repeated measure analyses of variance are done with the influencing variables, as determined after the preliminary analyses, as between-subject factor and the mean of the dominant hand and the mean of the nondominant hand as repeated measures, to be able to look at the difference between both hands. Next, the repeated measure analysis of variance with age as covariate is also done with Diagnosis as between-subject factor. When one of the influencing variables show a between-subject effect, the analysis with Diagnosis is repeated with inclusion of that specific variable to be able to determine whether this variable explains possible differences between Diagnostic groups.
Next several analyses of Covariance (ANCOVA) with age as covariate are used to look at whether there is a difference in mean tapping score for the influencing variables as found in the preliminary analyses. To be able to look at the differences in mean tapping score for the different diagnostic groups, an ANCOVA with age as covariate is done. If one of the influencing variables shows a significant difference with regard to the mean tapping score, the ANCOVA with Diagnosis is repeated with that specific variable to be able to determine whether that variable explains the possible differences between diagnostic groups. These analyses were done for both the dominant hand and the nondominant hand.
was used to explore the relationship between the mean tappingscore of the dominant hand and the DLE score of the three academic measures while controlling for age. The analyses were done separately for the DLE of the AVI, the DLE of the PI and the DLE of the CITO-R for both the dominant hand and the nondominant hand.
Results
Since there were 4 children whose handedness was ambidexter based on an equal mean tapping score of both hands, only the data of the children who were left-handed or right-handed were used in this study. The total group consisted of 630 children composed out of 484 boys and 146 girls (Figure 1).
Data-inspection was done by checking for normality and for outliers with respect to the tapping task. The data of the mean tappingscore of the dominant hand and the mean tapping score of the nondominant hand showed 30 outliers with a score of more than 2sd above or below average. Because these cases did not differ with regard to gender, age, diagnosis, handdominance and hand preference, it was not considered to be a specific group and they were excluded for further analyses.
Descriptives
Characteristics of the sample. Table 1 shows the main characteristics of the different diagnostic groups. There is a significant difference between the diagnostic groups with regard to age (F(4,595)=8.372, p<.001) with the MP-group being significant older than the group with ADHD and ASD. There is also a significant difference between the groups with regard to IQ (F(4,595)=3.579, p<.01) with the LP-group scoring significant lower than the MP-group and BP-group. Preliminary analyses were done to determine whether these variables should be taken into account in the main analyses.
When looking at gender, analyses show that gender is not equally distributed among the diagnostic groups (χ2(4, n =600)=66,405, p<.001). The ASD-group has a significant higher proportion of males than all the other groups, and the BP-group and ADHD-group have a significant higher proportion of males than the MP and LP group. The variable gender will be taken into account as covariate.
preference for right, of these 499 participants, 92,4% also had a dominant right hand as measured with the tapping test. However, of the participants that reported to have a left hand preference, a large group appeared to have a right dominant hand. As measured with the questionnaire, 18,3% had a left hand preference and of these 97 participants only 72,2% had a dominant left hand in the tapping test. Meaning that 27,8% of the participants that reported in the questionnaire to be left handed, were faster with their right hand in the tapping test. Four participants reported to be ambidexter, two of them had a dominant left hand and two had a dominant right hand. Ambidexter dominant handedness as measured with the tappingtest was excluded before analyses. In the following analyses the handdominance as measured with the tapping test is used as variable for right/left-handdominance.
Preliminary analyses
Consistency of tappingspeed of the dominant hand over five trials. We found differences in tappingspeed between the five trials of the dominant hand (F(4,595)=2.394,
p<.05), but because this difference was not influenced by diagnoses (F(16, 1806)=1.430,
p=.119), we were able to use the mean tapping score of the dominant hand as measure of fine
motor speed.
Consistency of tappingspeed of the nondominant hand over five trials. For the nondominant hand, no differences were found in tappingspeed for the five trials (F(4, 591)=.617, p=.651), neither are there differences between the diagnoses (F(16, 1806)=.784,
p=.706). So the mean of the five trials of the nondominant hand can be used as a measure of
fine motor speed.
Difference in tappingscore with age. Visual inspection of the data shows that the mean tappingscore of both the dominant hand and the nondominant hand increases with age (figure 2). To be able to determine whether the difference between the mean tappingscore of the dominant hand and the nondominant hand is increasing with age, the line of the difference score (mean dominant hand – mean nondominant hand) is also drawn. At 8 years of age, the line shows a breaking point, indicating that the difference between both hands is increasing until the age of 8 and gets more or less constant after the age of 8 years old.
Variables to take into account. Gender was considered to be an important variable, and as described above, age has an influence on the mean speed of the dominant hand, the mean speed of the nondominant and on the difference between both hands. So age is also an important variable that needs to be taken into account in all following analyses. However, age and gender are not the only variables that need to be considered influential. Characteristics of the sample show significant differences between diagnostic groups with regard to IQ and right/left-handdominance. Whether IQ and left/right-handdominance have an influence on tappingscores is not that clear. Because analyses showed that the tappingscore of the nondominant hand was different for the left- and right-handers (t(598)=1.989, p<.05), the right/left-handdominance is also considered an important variable to look at in the main analyses. The variable IQ, however, is not highly correlated with the tappingscores (r=.13 and
r=.13), so the variable IQ is not used in further analyses.
Main analyses
Difference between the nondominant hand and the dominant hand. To be able to determine whether there is a significant difference between the mean of the dominant hand and the mean of the nondominant hand, a repeated measure analysis of variance with age as covariate is done. This analysis shows that there is indeed a significant difference between the nondominant hand and the dominant hand (F(1,598)=44.739, p<.001) (Dominant hand; M=47.40, sd=7.55, Nondominant hand; M=41.43, sd=6.90), and an interaction effect of age with the difference of the dominant and nondominant hand (F(1,598)=6.448, p<.05) is found. There was also a main effect of age (F(1,598)=369.279, p<.001). This means that there is a significant difference between the mean of both hands and that age influences that difference. Because age also has a main effect, it can be said that the mean score of the dominant hand and the mean score of the nondominant hand are different for the different ages.
tappingscore of both hands (F(1,597)=23.193, p<.001) is found (figure 4). Meaning that the difference between the mean tappingscores of the both hands is influenced by having either a left- or a right dominant hand. Figure 4 shows a larger difference between the dominant hand and the nondominant hand for right-handers when compared to lefthanders.
Next we will look at the diagnostic groups and the difference between the mean of both hands with age as a covariate. Figure 5 shows the difference between the mean score on the nondominant hand (1) and the dominant hand (2) for the different diagnostic groups. An interaction effect between diagnosis and the difference of the dominant and nondominant hand (F(4,594)=2.398, p<.05) is found. Indicating that the diagnosis has an influence on how the score differs between the dominant hand and the nondominant hand. Looking more specific at which diagnostic groups differ on the difference between the dominant and the nondominant hand, post hoc analyses for the different diagnostic groups are done. These analyses show that only when looking at the ASD-group combined with the BP-group, the diagnosis has an influence on the difference between the dominant and nondominant hand (F(1,185)=7.916, p<.01) with a larger difference between both hands for the BP-group when compared with the ASD-group. All other combinations of diagnostic groups show no interaction effect of diagnosis and difference of the dominant and nondominant hand.
When the repeated measures analyses with age as covariate and diagnosis is done for the separate groups of right/left-handdominance, there is no interaction effect of diagnosis and difference between tappingscores of both hands (F(4, 104)=.554, p=.704) for the left
dominant hand, but there is still an interaction effect of diagnosis and difference between tappingscores of both hands (F(4, 484)=2.549, p<.05) for the right dominant hand. For the right-handers, post hoc analyses for the different diagnostic groups are done. These analyses show that when looking at the ASD-group combined with the BP-group (F(1,155)=9.165,
p<.01), and when looking at the MP-group combined with the ASD-group (F(1,224)=4.863,
p<.05), the diagnosis has an influence on the difference between the dominant and
nondominant hand. The difference between both hands is smaller in the ASD-group when compared to the BP-group and the MB-group.
Using an ANCOVA with age as covariate, analyses were performed in order to find out whether there is a difference in mean tapping score of the different diagnostic groups. The analysis showed a significant difference for the mean of the dominant hand (F(1,594)=5.014,
p<.005). The LP-group shows a significant lower mean than the BP-group (F(1,123)=10.202,
p<.005) and the ADHD-group (F(1,231)=9.270, p<.005), and the MP-group shows a
significantly lower mean than the BP-group (F(1,257)=9.193, p<.005) and the ADHD-group (F(1,365)=8.666, p<.005). The ADHD-group also shows a significantly higher mean score than the ASD-group (F(1,147)=4.381, p<.05). Figure 6 shows how the diagnoses differ for the mean of the dominant hand over age. Next a two-way ANCOVA with age as covariate and the different diagnostic groups, and gender is done. For diagnosis, there is still a significant difference found (F(4,589)=2.923, p<.05), however for gender, there is no significant
difference anymore (F(1,589)=.974, p=.324). There is also no interaction effect of gender and diagnosis (F(4,589)=.093, p=.985). This means that the difference in mean tappingscore of the dominant hand between the different diagnoses cannot be explained by the difference in gender and when looking at the separate diagnoses, we find again that the LP-group differs significant from the BP-group (F(1,121)=6.604, p<.05) and the ADHD-group
(F(1,229)=5.558, p<.05), and the MP-group also differs significantly from the BP-group (F(1,255)=5.192, p<.05) and the ADHD-group (F(1,363)=3.997, p<.05).
The mean tapping score of the nondominant hand. Similar as with the dominant hand, there is a significant difference in tapping speed for gender (F(1,597)=13.013, p<.001), and not for at left/right-dominance (F(1,597)=3.597, p=.061) when looking at the
nondominant hand. When looking at the different diagnostic groups, there is a significant difference in speed between the different groups (F(4,594)=5.039, p<.005). However, when taking gender and diagnostic group into account together, there is no difference between males and females (F(1,589)=2.407, p=.121), no difference between the diagnostic groups (F(4,589)=2.287, p=.059), nor is there an interaction effect of gender and diagnostic groups (F(1,589)=.319, p=.865).
Academic measures
To be able to determine if there is a relationship between the tappingscores and the different academic measures, Zero-order correlations and Partial correlations are calculated.
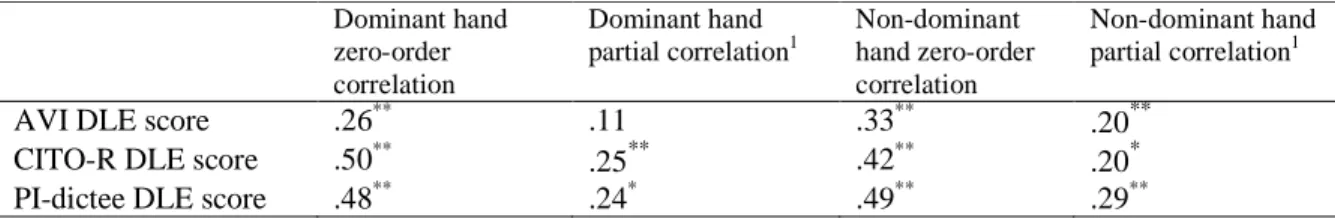
Academic measures and mean fine-motor speed. Table 3 shows the correlations of the dominant and the nondominant hand with the academic measures. All following analyses were done with age as covariate to be able to control for its influence.
Dominant hand. There is a small, positive correlation between the mean tapping score of the dominand hand and the DLE of the PI-dictee (r=.24, p<.005 with n=183) and the mean tapping score of the dominant hand and the DLE of the Cito-r (r=.25, p<.001 with
n=206). An inspection of the zero-order correlation (PI-dictee: r=.48 and Cito-r: r=.50)
suggests that controling for age did have an effect on the strength of the relationships between the variables. The zero-order correlation between the DLE of the AVI and the mean
tappingscore of the dominant hand was significant (r=.26, p<.001 with n=181), but when controlling for age, no significant correlation is found.
Nondominant hand. For the mean of the nondominant hand, there is a small, positive correlation with the DLE of the AVI (r=.20, p<.001 with n=181), with the DLE of the PI-dictee (r=.29, p<.001 with n=183) and with the DLE of the Cito-r (r=.20, p<.005 with n=206). An inspection of the zero-order correlation (AVI: r=.33, PI-dictee: r=.49 and Cito-r: r=.42) suggests that controling for age did have an effect on the strength of the relationships between the variables.
Conclusion and discussion
Maturation and fine motor lateralization. The first goal of this study was to find out whether there is a relation between the specialization of the brain and psychopathology in children. Five distinct diagnostic groups were compared to each other with respect to both the level of maturation of the brain, as measured with the fine motor speed, and the level of lateralization of the brain, as reflected by the level of lateralization of fine motor skills. We hypothesized that children with a developmental disorder would show a lower level of maturation- and lateralization of the brain when compared to children with other psychiatric disorders.
Looking at the maturation of the brain, we found that children with mood problems and children with learning problems show a less matured brain than children with ADHD or behavior problems as indicated by the fine motor speed. With respect to lateralization of the brain, our results indicate that children with an autistic spectrum disorder show less
the brain when looking at the different diagnostic groups, we were not able to determine that problems in maturation and lateralization were stronger or specific for all developmental disorders when compared to other psychiatric disorders since we did not find this difference for children with ADHD. However, the finding of lateralization abnormalities in the brain in children with ASD is in line with the expectation that children with ASD show less lateralized fine motor skills, and with earlier findings of Stroganova et al, who reported that they found abnormal lateralization of sensorimotor function (Stroganova et al., 2007). A possible explanation for the fact that we were not able to make a clear distinction between
developmental disorders and other psychiatric disorders using the tapping speed as measure of maturation of the brain, might be that fine motor speed as measured with the tapping test possibly also reflects involvement of nonmotor processes such as alertness, focus and maintaining attention and generating responses (Strauss, Sherman, Spreen, 2006), and that these nonmotor functions influenced the results. Although not hypothesized, it is also
interesting to mention that we found that the maturational differences in the brain between the different diagnostic groups increase with age, indicating that the problems of children with a less matured brain at a young age will be more visible as they get older. So despite the fact that other nonmotor functions can influence the outcome, the FTT has proven to be a good measure for maturation.
Relation of maturation and fine motor lateralization with academic performance. The second goal of this study was to look at whether there is a relationship between the specialization of the brain and different academic measures. The level of maturation of the brain, as measured with the fine motor speed, and the level of lateralization of the brain, as reflected by the level of lateralization of fine motor skills, were used as measures of specialization of the brain and were inspected in relation to math, reading and writing.
We found that a more matured brain is associated with a significant higher level of academic performance of reading, writing and math. Meaning that a more developed brain is reflected in a higher level of academic achievement. The fact that we found these relations while controlling for age, indicates that there are maturation differences in the brain as measured with fine motor speed above and beyond the maturation caused by age. However, when looking at lateralization of the brain, no relation with any domain of the academic performance is found. When looking at the hypotheses that stated that there would be a relation between the achievement on language and math tasks, and maturation and
between the maturation of the brain and the achievement on the academic tasks, however, there is no relation found for the level of lateralization. Tramontana et al, reported that
impaired neuropsychological performance on the Luria-Nebraska Neuropsychological Battery (LNNB) was related to poorer performance in reading and math but that lateralized
sensorimotor signs were not necessarily involved (Tramontana, Hooper, Curley, & Nardolillo, 1989). There are two different ways to compare their results with ours. First, we can say that the fact that we did not found a relation between the level of lateralization of the brain and academic performance is in line with their finding that lateralized sensorimotor signs were not necessarily involved. Second, we might be able to bring some nuances to these results as we looked more closely at the lateralized sensorimotor signs and were able to make a distinction between maturation and lateralization aspects. Because of this we were able to determine that these measures do not reflect the exact same construct and that the maturation of the brain did have a relation with academic performance and that lateralization of the brain did not. This indicates that the lateralized sensorimotor signs as measured by Tramontana et al (1989) might be not sensitive enough to detect the relation with academic performance (Tramontana, Hooper, Curley, & Nardolillo, 1989).
Handdominance and Handpreference. Next to the outcomes of the main analyses, we also found some interesting results when looking at handdominance and handpreference. We found that when looking at handpreference as measured with a questionnaire and
handdominance as measured with fine motor speed, our results are in line with earlier studies showing that questionnaire measures of handpreference are only moderately correlated with the handdominance as measured by performance tasks (Yelle, Schoger, & Bright, 2008). In our sample, the lefthanders showed more inconsistencies with regard to handpreference and handdominance. Meaning that while they reported to have a preference for the left hand, they were more skilled with their right hand.
Clinical implications. Because we were able to determine that maturation, as measured with fine motor speed using the FTT, is positively related to academic measures, the FTT can be used as a part of a neuropsychological test battery to detect possible maturational problems in children with poor academic performance. Our results also show that the maturational differences between diagnostic groups get larger with age, indicating that children with a relative less matured brain at a young age show less maturational growth over age and will be at risk for showing more maturational problems as they get older. More research is necessary, but these results imply that early maturational problems as measured with the FTT are a predictor of more severe maturational problems at an older age. Having knowledge about this developmental trajectory can be helpful in clinical practice, it can, for example, be a reason to apply for extra help in the beginning of school in order to minimize the delay in an early stage.
As expected, we found that fine motor speed and fine motor lateralization are strongly related but not measuring the exact same construct. So with these results we do not only underline the importance of looking at multiple performance measures, we also showed how these performance measures can be used to make a distinction between different diagnostic groups when looking at maturation and specialization of the brain and how they are related to academic achievement. Moreover, while there is still a lack of information about norms of the general Dutch population, this article provides some norms for Finger Tapping Test for Dutch children with psychiatric disorders.
Limitations and recommendations for further research. One important limitation of our study is that we did not use a normal control group to compare to our groups with psychopathology. Findeis and Weight (1994) developed meta-norms for children of 5 to 14 years of age (Findeis & Weigth, 1994). These norms are based on a series of articles published between 1969 and 1989 and are therefore outdated, moreover, different
take into account comorbidity. There is a high prevalence of comorbidity in children with psychiatric disorders, and children with comorbid disorders are likely to show more severe problems than children without comorbidity. In our sample, there were inconsistencies in the reporting of comorbid disorders and taking them into account would only reduce the
reliability instead of enhancing it. For this reason we decided to select our diagnostic groups based on the primary diagnoses as these were reported properly. Because of comorbidity, it is likely that our five diagnostic groups show overlap with each other and are not as distinct as we would like them to be. However, because of the relative large sample size in all diagnostic groups, we were able to interpret our results. Even more important, despite the fact that groups overlap due to comorbidity, we did find important differences between the groups indicating that when taking comorbidity into account these differences will get even larger underlining the importance of our findings.
A replication of this study including the comorbid disorders is recommended in future research. For future research it is also recommended to take into account the rate of
handedness to be able to look more closely to the relationship of handpreference, handdominance and diagnose.
Reference List
Academisch Ziekenhuis Groningen (1984). Motorische functies. Vragenlijst Laterale
Voorkeur. Groningen: Academisch Ziekenhuis Groningen. Afdeling Kinderoncologie
en Neuropsychologie AZG.
American Psychiatric Association (APA). (1987). Diagnostic and statistical manual of mental disorders (3rd revised ed.). Washington, DC: American Psychiatric Association.
American Psychiatric Association (APA). (1994). Diagnostic and statistical manual of mental disorders (4rd ed.). Washington, DC: American Psychiatric Association.
American Psychiatric Association (APA). (2000). Diagnostic and statistical manual of mental disorders (4rd revised ed.). Washington, DC: American Psychiatric Association.
Anderson, J.S., Lange, N., Frouhlich, A., DuBray, M.B., Druzgal, T.J., Froimowits, M.P, Alexander, A.L., Bigler, E.D., Lainhart, J.E. (2010). Decreased left posterior insular activity during auditory language in autism. AJNR American Journal of
Neuroradiology 31, 131-139.
Asai, T., Sugimori, E., & Tanno, Y. (2009). Schizotypal personality traits and atypical lateralization in motor and language functions. Brain and Cognition, 71, 26-37. Bleich-Cohen, M., Hendler, T., Kotler, M., & Strous, R.D. (2009). Reduced language
lateralization in first-episode schizophrenia: An fMRI index of functional asymmetry.
Neuroimaging, 171, 82-93.
Bleichrodt, N., Drenth, P.J.D., Zaal, J.N., & Resing, W.C.M. (1984). Revisie Amsterdamse
Kinder Intelligentie Test. Lisse: Swets & Zeitlinger.
Boles, D.B., Barth, J.M., & Merrill, E.C. (2008). Asymmetry and performance: Toward a neurodevelopmental theory. Brain and cognition, 66, 124-139.
Bornstein, R.A., Bakker, G.B., & Douglass, A.B. (1987). Short-Term Retest Reliability of the Halstead-Reitan Battery in a Normal Sample. The journal of nervous and mental
disease,175, 229-232.
Bradshaw, J.L., & Nettleton, N.C. (1983). Human cerebral asymmetry. Englewood Cliffs, NJ: Prentice-Hall.
Bryden, P.J., Pryde, K.M., & Roy, E.A. (2000). A Performance Measure of the Degree of Hand Preference. Brain and Cognition, 44, 402-414.
Dane, S., Yildirim, S., Ozan, E., Aydin, N., Oral, E., Ustaoglu, N. et al. (2008). Handedness, eyedness, and hand-eye crossed dominance in patients with schizophrenia: Sex-related lateralisation abnormalities. Laterality., 1-11.
De Haan, M, & Johnson, M.H. (2003). The Cognitive Neuroscience of Development. New York: Psychology Press
Escalante-Mead, P. R., Minshew, N. J., & Sweeney, J. A. (2003). Abnormal brain lateralization in high-functioning autism. Journal of Autism and Developmental
Disordorders, 33, 539-543.
Evers, A., Vliet-Mulder, J.C. van., & Groot, C.J. (2000). Documentatie van tests en
testresearch in Nederland. Assen: Van Gorcum.
Evers, A., Vliet-Mulder, van J.C., Resing, W.C.M., Starren, J.C.M.G., Alphen de Veer, R.J. van., & Boxtel, H. van. (2002). Cotan. Testboek voor het onderwijs. Almere: NDC-Boom.
FEPSY. The Iron Psyche: Manual. Heemstede, the Netherlands; Nederlands Instituut voor Epilepsiebestrijding;1995.
Findeis, M.K. & Weight, D.G. (1994). Meta-norms for Indiana-Reitan Neuropsychological
Test Battery and Halstead-reitan Neuropsychological Test Battery fo Children, ages
5-14. Unpublished Manuscript. In A. Strauss, A.M.S. Sherman, & O. Spreen (2006).
A Compendium od Neuropsychological Tests. Administration, norms, and commentary. Third edition. New York: Oxford Univesity Press Inc. Geelhoed, J.W., Bos, W., & Kappers, E.J. (1994). Handleiding PI-dictee.
Amsterdam/Duivendrecht: Paedologisch Instituut.
Gualtieri, C.T., & Johnson, L.G. (2006). Reliability and validity of a computerized
neurocognitive test battery, CNS Vital Signs. Archives of Clinical Neuropsychology,
21, 623-643.
Haassen, P.P. van, Bruyn E.E.J. de, Pijl, Y.J., Poortinga, Y.H., Spelberg, H.C., Steene, G. vander, Coetsier, P., Spoelders-Claes, R., & Stinissen, J. (1986). WISC-R, Wechsler
Intelligence Scale for Children-revised. Nederlandstalige uitgave. Lisse: Swets &
Zeitlinger.
Herten, M. Van., Pasman, J., Leeuwen, T.H., Been, P.H., Leij, A. Van der., Zwarts, F., & Maassen, B. (2008). Differences in AERP responses and atypical hemispheric
Janssen, J., Bokhove, J. & Kraemer, J.M. (1998). Rekenen-Wiskunde 1. Handleiding.
Opgaveboekjes, profielen en formulieren. Arnhem: Cito.
Kalverboer, A.F. (1988). Groninger Gedragslijst Schoolsitutatie. Groningen: Laboratorium voor Experimentele Klinische Psychologie, Rijksuniversiteit Groningen.
Kolb, B., & Whishaw, I.Q. (2009). Fundamentals of human neuropsychology. Sixth edition. New York: Worth Publishers. p. 276-300.
Kort, W., Schittekatte, M., Bosmans, M., Compaan, E.L., Dekker, P.H., Vermeir, G., & Verhaege, P. (2005). WISC-III-NL. Wechsler Intelligence Scale for Children-III.
Nederlandse bewerking. Amsterdam: Pearson Assessment and Information B.V.
Lazarev, V.V., Pontes, A., Mitrofanov, A.A., & deAzevedo (2010). Interhemispheric asymmetry in EEG photic driving coherence in childhood autism. Clinical
Neurophysiology, 121, 145-152.
Mitrushina, M.N., Boone, K.B., & D'Elia, L.F. (1999). Handbook of normative data for
neuropsychological assessment. New York: Oxford University Press.
Njiokiktjien, C. (2004). Gedragsneurologie van het kind. Amsterdam: Suyi Publicaties. O’Donnell, J.P., Kurtz, J., & Ramanaiah, N.V. (1983). Neuropsychological Test Findings for
Normal, Learning-Disabled, and Brain-Damaged Young Adults. Journal of Consulting
and Clinical Psychology, 51, 726-729.
Penolazzi, B., Spironelli, C., & Angrilli, A. (2008). Delta EEG activity as a marker of dysfunctional linguistic processing in developmental dyslexia. Psychophysiology, 45, 1025-1033.
Prigatano, G. P. & Wong, J. L. (1997). Speed of finger tapping and goal attainment after unilateral cerebral vascular accident. Archive of Physic and Medical Rehabilitation,
78, 847-852.
Prigatano, G.P., & Borgaro, S.R. (2003). Qualitative features of finger movement during the Halstead finger oscillation test following traumatic brain injury. Journal of the
International Neuropsychological Society, 9, 128-133.
Roessner, V., Banaschewski, T., Uebel, H., Becker, A., & Rothenberger, A. (2004). Neuronal network models of ADHD –lateralization with respect to interhemispheric connectivity reconsidered. European Child and Adolescent
Rosselli, M., Ardila, A., Bateman, J.R., & Guzman, M. (2001). Neuropsychological Test Scores, Academic Performance, and Developmental Disorders in Spanish-Speaking Children. Developmental Neuropsychology, 20, 355-373.
Sakong, J., Kang, P., Kim, C., Hwang, T., Jeon, M., Park, S., Lee, S., Won, K, et al. (2007). Evaluation of reliability of traditional and computerized neurobehavioral tests.
NeuroToxicology, 28, 235-239.
Siebelink, B.M., & Treffers, Ph.D.A. (2001). Anxiety Disorders Interview Schedule for
DSM-IV. Child Version. Nederlandse bewerking. Lisse: Sweits & Zeitlinger BV.
Somers, M., Sommer, L.E., & Kahn, R.S. (2009). Hand-preference and population schizotypy: A meta-analysis. Schizophrenia Research, 108, 25-32.
Strauss, A., Sherman, A.M.S., & Spreen, O. (2006). A Compendium od Neuropsychological
Tests. Administration, norms, and commentary. Third edition. New York: Oxford
Univesity Press Inc. (p. 1048).
Stroganova, T. A., Nygren, G., Tsetlin, M. M., Posikera, I. N., Gillberg, C., Elam, M. et al. (2007). Abnormal EEG lateralization in boys with autism. Clinical Neurophysiology,
118, 1842-1854.
Struiksma, A.J.C., Van der Leij, A., & Vieijra, J.P.M. (1995). Diagnostiek van technisch
lezen en aanvankelijk spellen. Amsterdam: VU uitgeverij.
Tonnessen, F.E., Lokken, A., Hoien, T., & Lundberg, I. (1993). Dyslexia, Left-handedness, and Immune Disorders. Archives of Neurology, 50, 411-416.
Treffers, Ph. D. A., van Widenfelt, B.M., & Goodman, R. (2005). Strength and Difficulties
Questionaire. Nederlandstalige versie. Leiden: LUMC, ACKJP Curium.
Tramontana, M.G., Hooper, S.R., Curley, A.D., & Nardolillo, E.M. (1989). Determinants of Academic Achievement in Children with Psychiatric Disorders. Journal of the
American Academy of Child and Adloescent Psychiatry., 29, 565-268.
Van Strien, J.W. (2001). Handvoorkeur en taaldominantie. Neuropraxis, 5(2), 10-15. Vandersteene, G., & Bos, A. (1997). WPPSI-R. Wechsler Preschool and Primary Scale of
Intelligence. Vlaamss-Nederlandse Aanpassing. Lisse: Swets & Zeitlinger.
Visser, H.I., Laarhoven, J.A. van, & Beek, A. ter (1994). Handleiding AVI-toetspakket. 's Hertogenhosch: KPC.
Voeller, K. K. (2004). Attention-deficit hyperactivity disorder (ADHD). Journal of Child
Neurology, 19, 798-814.
1190
302 888
Total
M F
1164
1162 2
248
914
715 199
267
647 13
634
484 146
26
M
M
F
F Age exclusion
>18
Diagn. missing
Exclusion diagnoses
TIQ missing
TIQ <70 exclusion
1382 192
Double cases
630 4
Table 1. Age, total IQ and hand dominance based on the tapping for both boys and girls with
different psychiatric disorders.
DSM (n) Age TIQ Gender
(% males)
Hand dominance (% Right-handers)* Mood
problems (178)
10.67 (2.63) 101.97 (13.71) 57.3% 79.8%
Learning problems (44)
9.84 (2.11) 95.16 (15.76) 65.9% 63.6% Behavior
problems (82)
10.02 (2.48) 102.66 (13.18) 81.7% 89.0% ADHD (190) 9.53 (2.34) 98.26 (13.71) 84.7% 85.3% ASD (106) 9.30 (2.25) 100.20 (15.69) 94.3% 80.2% Total (600) 9.95 (2.48) 100.08 (14.29) 76.5% 81.7% * percentage right-handers based on the dominant hand on the FTT.
Figure 2. A fitted Loess line (40%) for the mean speed of both hands and the difference score
Figure 3. Regression lines of the mean tapping speed of both hands for males and females.
Figure 4. The influence of whether the dominant hand is left or right on the estimated
marginal mean difference between the mean speed of the dominant hand and the nondominant hand.
Left Handers Right Handers
Mean Nondominant hand Mean Domiant hand 1
2
hand
Figure 5. The interaction effect of diagnosis and the estimated marginal mean difference in
tapping speed between both hands.
Figure 6. The regression lines of the mean speed of the dominant hand with age for the
separate diagnoses.
Mood Problems Learning Problems Behavior Problems ADHD
ASD Mood Problems Learning Problems Behavior Problems ADHD
ASD
Table 2. Correlation of the difference in mean tapping speed between both hands with the
academic measures.
Table 3. Correlation of the mean tapping speed with the academic measures.
1
Partial correlation controlling for the effect of age. **
Significant at .001 level *
Significant at .005 level
Difference score of the tapping test.
LR of the AVI -.11
LR of the CITO-R .04
LR of the PI-dictee -.08
Dominant hand zero-order correlation
Dominant hand
partial correlation1
Non-dominant hand zero-order correlation
Non-dominant hand
partial correlation1
AVI DLE score .26** .11 .33** .20**
CITO-R DLE score .50** .25** .42** .20*