Neurobiology of Disease
Decreased Axon Caliber Underlies Loss of Fiber Tract
Integrity, Disproportional Reductions in White Matter
Volume, and Microcephaly in Angelman Syndrome Model
Mice
Matthew C. Judson,
1,2Alain C. Burette,
1*
X
Courtney L. Thaxton,
1,2*
XAlaine L. Pribisko,
1Mark D. Shen,
2Ashley M. Rumple,
3Wilmer A. Del Cid,
1,4Beatriz Paniagua,
3XMartin Styner,
3X
Richard J. Weinberg,
1,5and
X
Benjamin D. Philpot
1,2,51Department of Cell Biology and Physiology,2Carolina Institute for Developmental Disabilities,3Department of Psychiatry,4Postbaccalaureate Research
Education Program, and5Neuroscience Center, University of North Carolina, Chapel Hill, North Carolina 27599
Angelman syndrome (AS) is a debilitating neurodevelopmental disorder caused by loss of function of the maternally inherited
UBE3A
allele. It is currently unclear how the consequences of this genetic insult unfold to impair neurodevelopment. We reasoned that by
elucidating the basis of microcephaly in AS, a highly penetrant syndromic feature with early postnatal onset, we would gain new insights
into the mechanisms by which maternal
UBE3A
loss derails neurotypical brain growth and function. Detailed anatomical analysis of both
male and female maternal
Ube3a
-null mice reveals that microcephaly in the AS mouse model is primarily driven by deficits in the growth
of white matter tracts, which by adulthood are characterized by densely packed axons of disproportionately small caliber. Our results
implicate impaired axon growth in the pathogenesis of AS and identify noninvasive structural neuroimaging as a potentially valuable tool
for gauging therapeutic efficacy in the disorder.
Key words:
Angelman; axon; E6-AP; microcephaly; UBE3A; white matter
Introduction
Maternally inherited deletions or mutations of
UBE3A
cause
An-gelman syndrome (AS), a severe neurodevelopmental disorder
(Kishino et al., 1997;
Matsuura et al., 1997;
Sutcliffe et al., 1997).
Individuals with AS suffer from profound developmental delay,
impaired motor function, absence of speech, and other highly
penetrant phenotypes including electroencephalographic
abnor-malities, epilepsy, and microcephaly (Mabb et al., 2011;
Margolis
et al., 2015). These features of AS begin to manifest during the
Received Jan. 5, 2017; revised May 24, 2017; accepted June 21, 2017.Author contributions: M.C.J., A.C.B., C.L.T., A.L.P., M.D.S., A.M.R., W.A.D.C., B.P., M.S., R.J.W., and B.D.P. de-signed research; M.C.J., A.C.B., C.L.T., A.L.P., M.D.S., A.M.R., W.A.D.C., and B.P. performed research; M.C.J., A.C.B., C.L.T., A.L.P., M.D.S., A.M.R., W.A.D.C., B.P., and M.S. analyzed data; M.C.J., A.C.B., C.L.T., A.L.P., M.D.S., R.J.W., and B.D.P. wrote the paper.
This work was supported by the National Institutes of Health (National Research Service Award Fellowship 5F32NS077686 to M.C.J.), the Angelman Syndrome Foundation (B.D.P.), National Institute of Neurological Disorders and Stroke–National Institutes of Health (NINDS Grant 5RO1NS039444 to R.J.W. and NINDS Grant 1RO1NS085093 to B.D.P.). Confocal imaging was supported by NINDS Center Grant P30 NS045892 and NICHD Center Grant P30 HD03110. We thank Ji Eun Han and Hyojin Kim for help genotyping and maintaining animal colonies and Kristen Phend for histological support.
The authors declare no competing financial interests. *A.C.B. and C.L.T. contributed equally to this work.
Correspondence should be addressed to Ben Philpot, Department of Cell Biology and Physiology, University of North Carolina, 115 Mason Farm Rd., Campus Box 7545, Chapel Hill, NC 27599. E-mail:[email protected].
DOI:10.1523/JNEUROSCI.0037-17.2017
Copyright © 2017 the authors 0270-6474/17/377347-15$15.00/0
Significance Statement
People who maternally inherit a deletion or nonfunctional copy of the
UBE3A
gene develop Angelman syndrome (AS), a severe
neurodevelopmental disorder. To better understand how loss of maternal
UBE3A
function derails brain development, we
ana-lyzed brain structure in a maternal
Ube3a
knock-out mouse model of AS. We report that the volume of white matter (WM) is
disproportionately reduced in AS mice, indicating that deficits in WM development are a major factor underlying impaired brain
growth and microcephaly in the disorder. Notably, we find that axons within the WM pathways of AS model mice are abnormally
small in caliber. This defect is associated with slowed nerve conduction, which could contribute to behavioral deficits in AS,
including motor dysfunction.
first year of life (Fryburg et al., 1991;
Dagli et al., 2012), indicating
an early deviation from the typical course of neurodevelopment.
Not all brain cells express
UBE3A
equally, lending traction to
efforts geared toward deciphering altered neurodevelopmental
trajectories in AS. Due to cell-type-specific epigenetic
mecha-nisms, neuronal expression of
UBE3A
from the paternal allele is
silenced during early phases of cellular differentiation and
matu-ration (Rougeulle et al., 1997;
Yamasaki et al., 2003), thereby
rendering neurons especially vulnerable to the maternal
UBE3A
loss that defines AS. In contrast, paternal
UBE3A
expression is
spared in neural stem cells and in glia, which biallelically express
the gene (Yamasaki et al., 2003;
Judson et al., 2014). Neurons are
therefore an obvious focal point for AS research, but due to the
spatiotemporal ubiquity of
UBE3A
expression throughout
devel-opment (Judson et al., 2014;
Burette et al., 2017), virtually any
neuron or neural circuit could contribute to AS pathogenesis
through a variety of primary deficits in neuronal physiology—a
daunting possibility.
UBE3A (also called E6-AP) is the founding member of the
HECT (homologous to the E6-AP C terminus) domain family of
E3 ubiquitin ligases, which can catalyze the polyubiquitination of
substrate proteins, targeting them for proteasomal degradation
(Mabb and Ehlers, 2010;
Mabb et al., 2011). UBE3A can also act
as a transcriptional coactivator (Nawaz et al., 1999;
Reid et al.,
2003;
El Hokayem and Nawaz, 2014), but mutations that inhibit
its ubiquitin ligase activity selectively are sufficient to cause AS
(Cooper et al., 2004), implying that improper substrate regulation
in neurons is the primary pathogenic basis of the disorder.
Candi-date UBE3A substrates and other UBE3A-interacting proteins in
neurons continue to be identified, but clear and direct links to
spe-cific phenotypes remain elusive (Sell and Margolis, 2015).
Here, we sought to elucidate the anatomical underpinnings of
microcephaly in AS, reasoning that better understanding the
causes of impaired brain growth in the disorder would yield new
insights into the neurodevelopmental consequences of maternal
UBE3A
loss in neurons. We brought the complementary
ap-proaches of structural neuroimaging, light and electron
mi-croscopy, and electrophysiology to bear in AS model mice. We
conclude that deficits in brain growth consequent to maternal
UBE3A
loss are likely the product of disproportionate reductions
in white matter (WM) volume, rooted in the failure of projection
neurons to develop axons of appropriate caliber.
Materials and Methods
Animals
We raised all mice on a 12:12 light:dark cycle withad libitumaccess to
food and water and performed all experiments in strict compliance with animal protocols approved by the Institutional Animal Care and Use Committees of the University of North Carolina at Chapel Hill (UNC). We used both male and female littermates at equivalent genotypic ratios,
with the exception of brain and body weight measures (seeFig. 1), for
which we analyzed only female mice at postnatal day 28 (P28), and P90, to control for the sexual dimorphism in body weight. Mice carrying the Ube3aknock-out allele were originally generated in the laboratory of A.
Beaudet (Jiang et al., 1998) and back-crossed to a congenic C57BL/6J
background (RRID:IMSR_JAX:016590). We generated maternalUbe3a
-deficient mice (Ube3am⫺/p⫹) by crossing congenic C57BL/6 wild-type
males to paternalUbe3a-deficient females (Ube3am⫹/p⫺), which them-selves are phenotypically normal (Jiang et al., 1998;Mulherkar and Jana, 2010). To generate mice for the analysis of cortical area patterning (see
below), we crossed Ube3am⫹/p⫺ females to male homozygous Ai9,
tdTomato Cre-reporter mice (Madisen et al., 2010), which were also
maintained on a congenic C57BL/6 background (RRID:IMSR_JAX: 007909).
Diffusion tensor imaging (DTI) and analysis
Tissue preparation.We deeply anesthetized P90 mice with sodium pen-tobarbital (60 mg/kg, i.p.) before transcardially perfusing them with hep-arinized saline (0.9% NaCl, 10 IU heparin/ml), immediately followed by phosphate-buffered 4% paraformaldehyde, pH 7.3, at a rate of 9 ml/min. After delivering 50 ml of fixative, we decapitated mice, postfixed their heads overnight at 4°C, and rinsed and stored them in PBS at 4°C before imaging.
Image acquisition and processing.We acquired diffusion-weighted
im-ages (24 directions; b-value⫽1600; FOV⫽200⫻256⫻128; voxel
resolution⫽0.12⫻0.12⫻0.12 mm3; TE⫽22.75 ms; TR⫽700 ms;
scan time⫽15 h) using a 9.4 T scanner at the UNC Small Animal
Imaging Facility (BioSpec 9.4/30 USR; Bruker Biospin). We processed images using an in-house pipeline developed by our laboratory at UNC,
which uses unbiased, atlas-based, regional segmentation (Budin et al.,
2013). First, we rigidly registered the images to the C57 Brookhaven atlas (Ma et al., 2005) to align them in a common space. We then skull-stripped the images and performed histogram matching and affine reg-istration, creating a population average image using AtlasWerks (Joshi et al., 2004). We diffeomorphically registered a parcellation of brain regions (based on the Brookhaven Atlas) to the population average image using
ANTS (Avants et al., 2008), allowing us to propagate the population
average segmentation to the individual case images and generate regional statistics. A single anatomical expert, blind to sex and genotype, checked each case visually for quality control.
Volumetric segmentation.We performed WM volumetric segmenta-tions on the RD image of each individual case in ITK-SNAP (RRID:
SCR_002010) (Yushkevich et al., 2006) according to the following
parameters: corpus callosum segmented in four contiguous sagittal slices at the midline (defined by the presence of the superior sagittal sinus; internal capsule segmented primarily in the coronal plane with an ante-rior boundary at the body of the anteante-rior commissure and a posteante-rior boundary at the ascending limb of the stria terminalis; anterior commis-sure segmented primarily in the horizontal plane with an anterior boundary for the anterior limbs at the genu of the corpus callosum and a posterior boundary at the optic chiasm; fimbria segmented in its entirety, primarily in the coronal plane; fornix segmented primarily in the coronal plane with the boundary for the precommissural fornix two slices ante-rior to the body of the anteante-rior commissure and the boundary for the postcommissural fornix three slices anterior to the mammillary bodies.
We segmented the cerebral cortex using the propagated atlas parcella-tion. Cortical segmentations were automatically eroded by one voxel to eliminate the partial voluming of voxels between the outer pial surface of cortex and the subarachnoid space. An anatomical expert blind to sex and genotype visually inspected each case and edited the cortical segmen-tation manually using ITK-Snap.
DTI data processing and tractography.We processed DTI data accord-ing to procedures that provide consistent parameterization between sub-jects (Goodlett et al., 2009), generating a final average tensor atlas of all Ube3am⫺/p⫹and littermate control brains. Working from this average atlas, we performed tractography for each tract of interest through seed label mapping in 3D Slicer (RRID:SCR_002579), with ITK-SNAP-generated segmentations serving as seed labels. We edited the resultant tractography-computed tracts in 3D Slicer and in FiberViewerLight, eliminating spurious and partial fibers before parameterization and the generation of subject-specific, tract-based statistics using DTIAtlasFiber-Analyzer (Verde et al., 2014). Finally, we performed a functional analysis of the tract-based statistics, or Functional Analysis of Diffusion Tensor Tracts Statistics (FADTTS) (Zhu et al., 2011), using the FADTTSter tool and controlling for imaging cohort as a covariate. All of the open-source tools constituting this DTI processing pipeline are available publically through the UNC-Utah NA-MIC DTI fiber tract analysis framework (www.nitrc.org/projects/namicdtifiber).
Electrophysiology
For nerve conduction recordings, we anesthetized mice with sodium pentobarbital (60 mg/kg) and decapitated them before acutely dissecting the tibial branch of the sciatic nerve. Following previously described methods (Pillai et al., 2009), we used a Ag/AgCl suction electrode in a
dual-compartmentex vivo recording chamber to deliver rectangular
wave pulses (10s in duration) to the proximal portion of the nerve,
adjusting the stimulus amplitude (10 –30 V) to ensure a near-maximal
response of the large-caliber A␣fiber component. We calculated
max-imum conduction velocity by dividing the distance between the stimu-lating and recording electrodes (20 mm) by the conduction latency (ms from stimulus artifact to A␣deflection).
Light microscopy and analysis
Tissue preparation.We anesthetized mice with sodium pentobarbital (60 mg/kg) before transcardial perfusion with PBS, immediately followed by phosphate-buffered 4% paraformaldehyde, pH 7.3. We removed per-fused brains from their skulls and postfixed them overnight at 4°C before sequential 12 h incubations in 10%, 20%, and 30% sucrose in PBS, pH 7.5, for cryoprotection. We then froze cryoprotected brains on dry
ice and cut them into 40-m-thick sections with a sliding microtome
(Thermo Fisher Scientific). We stored sections at⫺20°C in a cryopreser-vative solution (by volume: 45% PBS, 30% ethylene glycol, 25% glycerol) until performing free-floating immunohistochemistry.
Immunohistochemistry.We rinsed sections several times in PBS before blocking in PBS plus 5% normal goat serum and 0.2% Triton X-100 (NGST) for 1 h at room temperature. We subsequently incubated blocked tissue sections in primary antibodies diluted in NGST for 48 h at 4°C. We then rinsed them several times in PBS containing 0.2% Triton X-100 (PBST) before incubation in secondary antibodies (also diluted in NGST) for 1 h at room temperature. In most experiments, we also added
4⬘,6-diamidino-2-phenylindole (DAPI; Thermo Fisher Scientific,
cata-log #D1306) at a concentration of 700 ng/ml for nuclear counterstaining. Primary antibodies and dilutions used included 1:500 mouse anti-NeuN (Millipore catalog #MAB377, RRID:AB_10048713), 1:500 rabbit
anti-CUX1 (Santa Cruz Biotechnology catalog #sc-13024, RRID:AB_2261231), and 1:1000 CTIP2 (Abcam catalog #ab18465, RRID:AB_2064130). We used secondary antibodies (Thermo Fisher Scientific) at a 1:500 dilution,
in-cluding Alexa Fluor-647 goat anti-mouse IgG1(catalog #A21240, RRID:
AB_10565021), Alexa Fluor-488 goat anti-rabbit IgG (catalog #A11008, RRID:AB_10563748), and Alexa Fluor-568 goat anti-rat IgG (catalog #A11077, RRID:AB_10562719). We stained all brain sections for quan-titative analysis within the same experiment under identical conditions. Imaging.We acquired images of immunofluorescently labeled brain sections with a Zeiss LSM 710 confocal microscope equipped with ZEN imaging Software (Zeiss, RRID:SCR_013672). We collected images for quantitative comparison during the same imaging session using identical acquisition parameters.
Analysis of cortical area patterning.We generated sensory area maps for Scnn1a-Cre::Ai9::Ube3am⫺/p⫹and littermate control (Scnn1a-Cre::Ai9::
Ube3am⫹/p⫹) mice;Scnn1a-Creis expressed by L4 neurons within
pri-mary sensory areas of neocortex; theAi9allele harbors a floxed STOP
cassette preventing tdTomato expression from theGt(ROSA)26Sorlocus
before Cre-mediated recombination (Madisen et al., 2010). After
tran-scardial perfusion with 2% paraformaldehyde, pH 7.3, and removal of the hippocampus and subcortical structures, we flattened the cortical hemispheres from each mouse between weighted glass slides.
Subse-quently, we cut hemispheres to a thickness of 40m and imaged four to
six consecutive sections (15m optical thickness) per hemisphere to
capture the entirety of TdTomato fluorescence in L4 sensory cortex, the boundaries of which we traced and measured using ImageJ software
(RRID:SCR_003070) (Schneider et al., 2012).
Analysis of cortical laminar patterning.We measured the percentage of primary somatosensory cortical thickness stained for CUX1 (layers 1– 4;
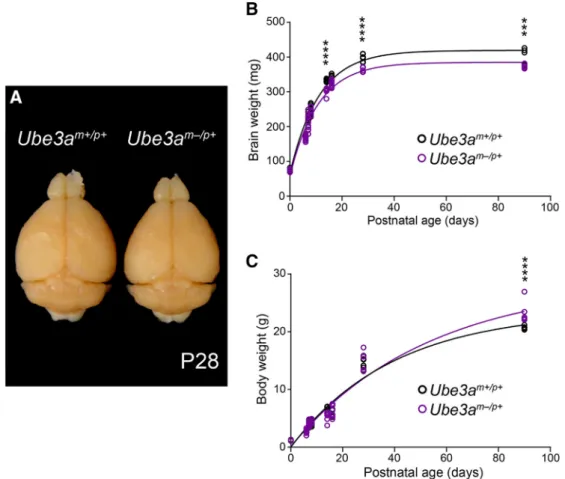
Figure 1. Ube3am⫺/p⫹mice exhibit microcephaly with postnatal onset.A, Representative image of P28Ube3am⫹/p⫹andUbe3am⫺/p⫹littermate brains after transcardial fixation and gross dissection.B, Cross-sectional analysis of postperfusion brain weights from littermateUbe3am⫹/p⫹andUbe3am⫺/p⫹mice.C, Cross-sectional analysis of premortem body weights from littermate Ube3am⫹/p⫹andUbe3am⫺/p⫹mice (P0:Ube3am⫹/p⫹n⫽7,Ube3am⫺/p⫹n⫽6; P6:Ube3am⫹/p⫹n⫽6,Ube3am⫺/p⫹n⫽13; P7:Ube3am⫹/p⫹n⫽8,Ube3am⫺/p⫹n⫽11; P8:Ube3am⫹/p⫹ n⫽10,Ube3am⫺/p⫹n⫽7; P14:Ube3am⫹/p⫹n⫽8,Ube3am⫺/p⫹n⫽6; P16:Ube3am⫹/p⫹n⫽7,Ube3am⫺/p⫹n⫽10; P28:Ube3am⫹/p⫹n⫽7,Ube3am⫺/p⫹n⫽5; P90:Ube3am⫹/p⫹n⫽ 5,Ube3am⫺/p⫹n⫽6). Each dataset was fit with a single exponential. Data represent mean⫾SEM, ***pⱕ0.001, ****pⱕ0.0001.
L1– 4) and CTIP2 (L5– 6) within 100-m-wide sampling strips. We
av-eraged the results from four strips per mouse, one⫹0.14 mm and one
⫺0.94 mm relative to bregma, for each hemisphere.
Analysis of cortical cell density.We acquired all images for cortical cell density analyses using thin (1.4-m-thick) optical sectioning. For each
animal, we sampled four 100-m-wide strips of primary somatosensory
cortex: one⫹0.14 mm and one⫺0.94 mm relative to bregma per
hemi-sphere. We averaged counts of both NEUN⫹/DAPI⫹(neurons) and
NEUN-/DAPI⫹(glia), which we made using the cell counter plug-in in
ImageJ. We used CUX1 and CTIP2 counterstaining to reliably subdivide L1– 4 and L5– 6 laminae within each strip.
Electron microscopy and analysis
Tissue preparation.We killed anesthetized mice (60 mg/kg sodium pen-tobarbital) by transcardial perfusion with 0.9% NaCl, followed immedi-ately by fixative consisting of 2% glutaraldehyde (Electron Microscopy Science), 2% depolymerized paraformaldehyde, and 0.2% picric acid in
0.1Mphosphate buffer, pH 6.8. We immediately removed the perfused
brains and dissected the sciatic nerves, postfixed them overnight at 4°C in the same fixative, and sectioned them the following day on a vibratome to a thickness of 50m. We postfixed sagittal brain sections and transverse
sections of sciatic nerve in 1% osmium tetroxide in 0.1Mphosphate
buffer for 1 h before incubation with 1% uranyl acetate in maleate buffer
Figure 2. Cortical patterning is normal in adultUbe3am⫺/p⫹mice.A, Images of DAPI-counterstained tangential cortical sections from⬃P90 wild-type (Scnn1a-Cre::Ai9::Ube3am⫹/p⫹) and Ube3am⫺/p⫹(Scnn1a-Cre::Ai9::Ube3am⫺/p⫹) littermate mice expressing tdTomato in sensory cortices under the control of a L4-specific Cre driver. Scale bar, 1.8 mm.B, Representative sensory maps fromUbe3am⫹/p⫹andUbe3am⫺/p⫹mice.C, Quantification of primary somatosensory (S1), visual (V1), and auditory (A1) cortical surface area as a percentage of total sensory cortical surface
area (Ube3am⫹/p⫹n⫽5 mice,Ube3am⫺/p⫹n⫽3 mice).D,E, Immunostaining for the L2– 4 marker CUX1 and the L5– 6 marker CTIP2 with DAPI nuclear counterstaining in primary somatosensory cortex of⬃P90Ube3am⫹/p⫹(D) andUbe3am⫺/p⫹(E) mice. Scale bar, 185m.F, Quantification of laminar contributions to cortical thickness (Ube3am⫹/p⫹n⫽3 mice,Ube3am⫺/p⫹n⫽3 mice). Data represent mean⫾SEM.
(0.1M, pH 6.0) for 1 h. After dehydration, we infiltrated the sections with
Spurr resin and flat-mounted them between sheets of ACLAR fluoropo-lymer within glass slides. We glued chips of corpus callosum or sciatic
nerve onto plastic blocks, sectioned them en face at⬃60 nm, collected
them on 300 mesh nickel grids coated with Coat-Quick G, and per-formed poststaining with uranyl acetate and Sato’s lead.
Callosal imaging and analysis.We performed electron microscopy on callosal material with a Tecnai 12 transmission electron microscope
(Philips) at 80 kV, acquiring images at 4400⫻magnification. We
mea-sured both unmyelinated and myelinated axon caliber (specifically the axoplasmic cross-sectional area, excluding the myelin sheath) and
total axon density from randomly sampled 120m2photomontages
(15–20 images, 400 –507 unmyelinated and 1899 –2939 myelinated axons analyzed per mouse). We extrapolated axon diameters from cross-sectional area measurements assuming a circular fit. To ensure
that axons in wild-type andUbe3am⫺/p⫹mice were equivalently
cir-cular, we analyzed the “round” and “circularity” shape descriptor
Figure 3. Corpus callosum and internal capsule volumes are disproportionately reduced in adultUbe3am⫺/p⫹mice.A,B, Representative 3D volumetric renderings of cerebral cortex (magenta), corpus callosum (green), and internal capsule (cyan) fromUbe3am⫹/p⫹(A) andUbe3am⫺/p⫹(B) mice. Insets illustrate color-coded segmentation labels in register with (left to right) horizontal, coronal, and sagittal RD image slices, which reflect the plane of view for corresponding 3D renderings (indicated by arrows).C, MRI-based quantification of total cerebral cortical volume, excluding underlying WM.D,E, Quantification of corpus callosum (D) and internal capsule (E) volume as a ratio of total cerebral cortical volume (Ube3am⫹/p⫹n⫽7 mice,Ube3am⫺/p⫹n⫽5 mice). Data represent mean⫾SEM, *pⱕ0.05, **pⱕ0.01.
Table 1. Group comparisons of WM volume (mm3)
Ube3am⫹/p⫹ Ube3am⫺/p⫹
% Difference
MANCOVAa
EMM SEM EMM SEM F p-value Partial2
Corpus callosum 0.29 0.005 0.25 0.006 ⫺13.5⫾0.9 24.2 0.00061 0.708 Internal capsule 3.15 0.035 2.73 0.038 ⫺13.4⫾1.0 69.3 0.00001 0.874 Anterior
commissure
0.68 0.014 0.59 0.016 ⫺13.44⫾1.7 19.4 0.00134 0.659
Fornix 0.67 0.018 0.59 0.020 ⫺11.34⫾2.9 8.2 0.0169 0.452 Fimbria 1.77 0.041 1.56 0.044 ⫺11.39⫾2.1 11.8 0.00639 0.541
aPost hoctesting of genotype effects for each tract after MANCOVA (Pillai’s trace,p⬍0.005; genotype as the fixed factor, imaging cohort as the covariate).Ube3am⫹/p⫹,n⫽7;Ube3am⫺/p⫹,n⫽6.
EMM, Estimated marginal mean.
parameters within ImageJ, finding no significant differences between groups. We calculated g-ratios (the ratio of the inner axonal diameter to the total outer diameter axonal diameter, including the myelin
sheath) from randomly sampled 15 m2 electron micrographs
(15–20 images, 457– 666 myelinated axons per mouse).
Sciatic nerve imaging and analysis
We acquired electron micrographs of the sciatic nerve with a Zeiss 910
transmission electron microscope at 80 kV, acquiring images at 1600⫻
magnification. We measured myelinated axon caliber and g-ratios from
randomly sampled⬃2500m2micrographs (5–14 per mouse, totaling
404 –1245 myelinated axons).
Figure production
We linearly adjusted the brightness and contrast of some images in figure plates using ImageJ software. All images meant for direct comparison within figures underwent identical manipulations. We prepared all fig-ures using Adobe Illustrator software (RRID:SCR_010279).
Experimental design and statistical analysis
We performed and analyzed all experiments blind to genotype, estimat-ing minimum sample sizes from previously published datasets with sim-ilar experimental parameters. For brain and body weight, neuroimaging, light microscopy, electron microscopy, and electrophysiology experi-ments, we drew measurements from mutant animals and their age-matched littermates and attempted to balance the number of animals drawn from each sex.
Sample sizes by experiment
● Body and brain growth (seeFig. 1): P0, 7Ube3am⫹/p⫹(3 males,
4 females) and 6Ube3am⫺/p⫹ (3 males, 3 females) mice; P6, 6
Ube3am⫹/p⫹(4 males, 2 females) and 13Ube3am⫺/p⫹(7 males, 6
females) mice; P7, 8 Ube3am⫹/p⫹ (3 males, 5 females) and 11
Ube3am⫺/p⫹(4 males, 7 females) mice; P8, 10Ube3am⫹/p⫹(6 males,
4 females) and 7Ube3am⫺/p⫹(3 males, 4 females) mice; P14, 8
Ube3am⫹/p⫹(6 males, 2 females) and 6Ube3am⫺/p⫹(2 males, 4
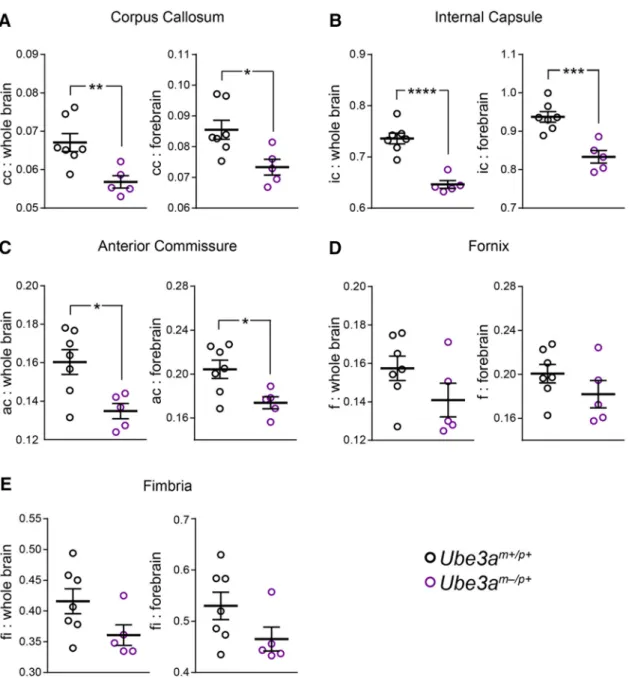
Figure 4. Decreased ratios of WM volume to whole-brain and forebrain volumes in adultUbe3am⫺/p⫹mice.A–E, Quantification of corpus callosum (A), internal capsule (B), anterior commissure
(C), fornix (D), and fimbria (E) volumes as a ratio of both whole-brain volume and forebrain volume inUbe3am⫹/p⫹(n⫽7) andUbe3am⫺/p⫹(n⫽5) mice. Data represent mean⫾SEM, *pⱕ0.05,
**pⱕ0.01, ***pⱕ0.001, ****pⱕ0.0001.
females) mice; P16, 7 Ube3am⫹/p⫹ (6 males, 1 female) and 10
Ube3am⫺/p⫹(3 males, 7 females) mice; P28, 7 femaleUbe3am⫹/p⫹and 5 femaleUbe3am⫺/p⫹mice; P90, 5 femaleUbe3am⫹/p⫹and 6 female
Ube3am⫺/p⫹mice.
● Cortical area mapping (seeFig. 2C): 5Ube3am⫹/p⫹(2 males, 3 fe-males) and 3Ube3am⫺/p⫹(1 male, 2 females) mice.
● Cortical lamination (seeFig. 2F): 3Ube3am⫹/p⫹(1 male, 2 females) and 3Ube3am⫺/p⫹(1 male, 2 females) mice.
● WM volumetrics (seeTable 1): 7Ube3am⫹/p⫹(4 males, 3 females) and 6Ube3am⫺/p⫹(3 males, 3 females) mice.
● WM/GM ratios (seeFigs. 3,4): 7Ube3am⫹/p⫹(4 males, 3 females) and 5Ube3am⫺/p⫹(3 males, 2 females) mice.
● DTI tractography (seeFig. 5, Table 2): 7Ube3am⫹/p⫹(4 males,
3 females) and 6Ube3am⫺/p⫹(3 males, 3 females) mice.
● Callosal electron microscopy (see Figs. 6, 7, 8): 6 Ube3am⫹/p⫹ (2 males, 4 females) and 6Ube3am⫺/p⫹(2 males, 4 females) mice.
● Cortical cell density (seeFig. 9): 3Ube3am⫹/p⫹(1 male, 2 females) and 3Ube3am⫺/p⫹(1 male, 2 females) mice.
● Sciatic nerve electron microscopy (seeFigs. 10A–C,11): 6Ube3am⫹/p⫹ (3 males, 3 females) and 6Ube3am⫺/p⫹(3 males, 3 females) mice.
● Sciatic nerve conduction (seeFig. 10F–H): 6Ube3am⫹/p⫹(3 males, 3 females) and 6Ube3am⫺/p⫹(3 males, 3 females) mice.
We performed statistical analyses using GraphPad Prism version 6 software (RRID:SCR_002798), SPSS version 22 software (IBM, RRID:
SCR_002865), and the FADTTSter tool (www.nitrc.org/projects/
namicdtifiber).
Statistical analyses by experiment
● Body and brain growth (seeFig. 1): two-way ANOVA, Sidak’spost
hoctest.
● Cortical area mapping (seeFig. 2C): two-way ANOVA, Sidak’spost
hoctest.
● Cortical lamination (seeFig. 2F): Unpaired two-tailedttest.
● WM volumetrics (seeTable 1): MANCOVA, setting imaging cohort
as the covariate.
● WM/GM ratios (seeFigs. 3,4): Unpaired two-tailedttest.
● DTI tractography (seeFig. 5D,Table 2): FADTTS.
● Callosal electron microscopy: Unpaired two-tailedttest (seeFigs.
6B,E,G,8A) and two-way repeated-measures ANOVA, Sidak’spost hoctest (seeFigs. 6F,7A,B,8B,C).
● Cortical cell density (seeFig. 9C–G): Unpaired two-tailedttest.
Figure 5. DTI tractography reveals deficits in callosal WM integrity in adultUbe3am⫺/p⫹mice.A–C, Tractography-computed callosal tract (713 fibers) in register with coronal and sagittal views of the FA atlas, which was generated from the average DTI of allUbe3am⫹/p⫹(n⫽7) andUbe3am⫺/p⫹(n⫽6) mice. The isthmus of the callosum was not computed. Dorsal (A) and lateral views from right (B) and from left (C) are shown. Color scale corresponds to arc-length position for statistical sampling along the mediolateral aspect of the tract.D, Distribution of false discovery rate-corrected localp-values (⫺log10) for each diffusion parameter along the arc-length of the callosal tract. Dashed line indicatesp⫽0.05 significance threshold.E, Tract-based statistical summaries for each diffusion measure: AD, RD, MD, and FA.y-axis values for AD, RD, and MD are multiplied by 103. Data represent mean⫾SEM.
Table 2. Group comparisons of anisotropy and diffusivity
Ube3am⫹/p⫹ Ube3am⫺/p⫹
p-valuea Mean SEM Mean SEM
Corpus callosum AD 0.62 0.023 0.54 0.019 ⱕ0.001
RD 0.16 0.005 0.16 0.004 0.834
MD 0.31 0.011 0.28 0.009 0.005
FA 0.71 0.006 0.65 0.007 ⱕ0.001
Internal capsule AD 0.54 0.008 0.51 0.009 ⱕ0.001
RD 0.22 0.005 0.22 0.005 0.198
MD 0.33 0.006 0.31 0.006 0.009
FA 0.53 0.004 0.52 0.006 0.21
Anterior commissure AD 0.62 0.019 0.59 0.019 0.004
RD 0.18 0.003 0.18 0.002 0.416
MD 0.32 0.008 0.31 0.007 0.011
FA 0.65 0.004 0.65 0.008 0.056
Precommissural fornix AD 0.61 0.009 0.6 0.01 0.066
RD 0.24 0.004 0.23 0.005 0.013
MD 0.36 0.005 0.35 0.006 0.011
FA 0.55 0.006 0.55 0.006 0.611
Postcommissural fornix AD 0.66 0.02 0.62 0.021 0.002
RD 0.29 0.011 0.27 0.012 0.013
MD 0.42 0.014 0.39 0.015 0.007
FA 0.5 0.005 0.5 0.005 0.144
Fimbria AD 0.81 0.05 0.73 0.033 0.002
RD 0.2 0.013 0.18 0.009 0.01
MD 0.41 0.025 0.37 0.017 0.003
FA 0.73 0.007 0.73 0.003 0.794
aPost hoc testing of genotype effects using FADTTS (Zhu et al., 2011). Imaging cohort was set as the covariate. Global p-values are indicated.Ube3am⫹/p⫹,n⫽7;Ube3am⫺/p⫹,n⫽6.
Values for AD, RD, and MD are multiplied by 103.
● Sciatic nerve electron microscopy: Unpaired two-tailedttest (see
Figs. 10B,11A) and two-way repeated-measures ANOVA, Sidak’s post hoctest (seeFigs. 10C,11C).
● Sciatic nerve conduction (seeFig. 10F–H): Unpaired two-tailedt test.
Results
Microcephaly in
Ube3a
mⴚ/pⴙmice is associated with a
disproportionate loss of WM volume
Individuals with AS are born with normal head circumference,
but present with absolute microcephaly— decreased head
cir-cumference regardless of body size—within the first 8 –12
months of life (Dagli et al., 2012). The emergence of
microceph-aly coincides with the manifestation of early neurological
pheno-types, including truncal hypotonia and seizures (Fryburg et al.,
1991;
Dagli et al., 2012), suggesting a close link between deficits in
early postnatal brain growth and AS pathophysiology. To
deter-mine whether mice lacking a functional maternal
Ube3a
copy
(
Ube3a
m⫺/p⫹, AS model mice) exhibit microcephaly according to
a similar time course, we tracked brain weight cross-sectionally
over postnatal development.
Ube3a
m⫺/p⫹brain growth appeared
normal at birth through P8, but then the trajectory flattened
relative to control, leading to statistically significant group
defi-cits by P14 (Fig. 1
A
,
B
; two-way ANOVA for genotype
⫻
age
interaction,
F
(7,106)⫽
4.38,
p
⫽
0.0003;
post hoc
unpaired
t
test
with Sidak’s multiple comparisons correction,
t
(106)⫽
5.11,
p
⬍
0.0001). In contrast, body weights in
Ube3a
m⫺/p⫹and control
mice were similar up to P90, when
Ube3a
m⫺/p⫹mice showed
evidence of adult-onset obesity (Fig. 1
C
; two-way ANOVA for
Figure 6. Callosal axons in adultUbe3am⫺/p⫹mice display normal myelination but decreased caliber.A, Representative electron micrographs used to assess axon g-ratio in⬃P90Ube3am⫹/p⫹ andUbe3am⫺/p⫹mice. Scale bar, 0.18m.B, Quantification of mean axon g-ratio.C, Plots of axon g-ratio versus diameter fit with a linear function.D, Representative electron micrographic montages of the corpus callosum used to measure the cross-sectional area and packing density of myelinated axons in⬃P90Ube3am⫹/p⫹andUbe3am⫺/p⫹mice. Scale bar, 2m.E, Quantification of the cross-sectional area of myelinated axons.F, Distribution of the diameters of myelinated axons (logarithmic scale).G, Quantification of total axon density.n⫽6 mice for each genotypic group. Data represent mean⫾SEM, *pⱕ0.05, **pⱕ0.01, ***pⱕ0.001, ****pⱕ0.0001.
genotype
⫻
age interaction,
F
(7,106)⫽
4.76,
p
⫽
0.0001;
post hoc
unpaired
t
test with Sidak’s multiple comparisons correction,
t
(106)⫽
5.33,
p
⬍
0.0001), consistent with previous reports in
mice and with clinical reports of adults with AS (van Woerden et
al., 2007;
Dagli et al., 2012;
Huang et al., 2013;
Margolis et al.,
2015). Therefore,
Ube3a
m⫺/p⫹mice faithfully model absolute
microcephaly with early postnatal onset, as is observed in AS.
Postnatally emergent microcephaly suggests a sparing of
prenatal ontogenetic processes governing brain histogenesis.
Accordingly, we found grossly normal cortical patterning in
Ube3a
m⫺/p⫹mice: sensory area maps (Fig. 2
A
–
C
; two-way
ANOVA,
F
(2,
18
⫽
4.38,
p
⫽
0.1758) and lamination (Fig. 2
D
–
F
;
L1– 4 unpaired two-tailed
t
test,
t
(4)⫽
0.45,
p
⫽
0.68; L5– 6
un-paired two-tailed
t
test,
t
(4)⫽
0.45,
p
⫽
0.68) were appropriately
proportioned and indistinguishable from control. To uncover
further clues as to how postnatal brain growth is affected by the
loss of maternal
Ube3a
, we undertook a detailed MRI-based
volumetric analysis of the
Ube3a
m⫺/p⫹brain. Brain structures
comprising mostly gray matter were somewhat smaller in
Ube3a
m⫺/p⫹mice than in littermate controls at P90. In
Ube3a
m⫺/p⫹cerebral cortex, for example, volumes were reduced
by an average of 7% (Fig. 3
A
–
C
; unpaired two-tailed
t
test,
t
(10)⫽
3.34,
p
⫽
0.008). However, we observed larger reductions in the
volume of WM tracts within the
Ube3a
m⫺/p⫹brain. Each tract
that we analyzed was at least 11% smaller
than control: corpus callosum showed the
greatest volumetric difference,
⫺
13.5%
(Table 1). We subsequently verified that
WM volume is disproportionately
re-duced in
Ube3a
m⫺/p⫹mice via
ratiomet-ric comparison of WM tract volumes with
volumes for total cortex, forebrain, and
whole brain in each animal (Figs. 3
D
,
E
,
4;
unpaired two-tailed
t test
s: callosum:
cor-tex,
t
(10)⫽
2.5,
p
⫽
0.03; callosum:
fore-brain,
t
(10)⫽
2.83,
p
⫽
0.02; callosum:
whole brain,
t
(10)⫽
3.32,
p
⫽
0.008;
cap-sule: cortex,
t
(10)⫽
3.93,
p
⫽
0.003;
cap-sule: forebrain,
t
(10)⫽
4.87,
p
⫽
0.0007;
capsule: whole brain,
t
(10)⫽
6.43,
p
⬍
0.0001; commissure: forebrain,
t
(10)⫽
2.78,
p
⫽
0.02; commissure: whole brain,
t
(10)⫽
3.03,
p
⫽
0.01; fornix: forebrain,
t
(10)⫽
1.3,
p
⫽
0.22; fornix: whole brain,
t
(10)⫽
1.56,
p
⫽
0.15; fimbria: forebrain,
t
(10)⫽
1.73,
p
⫽
0.11; fimbria: whole brain,
t
(10)⫽
1.96,
p
⫽
0.08).
WM integrity is globally compromised
in the adult
Ube3a
mⴚ/pⴙbrain
We next investigated whether WM
vol-umetric deficits were accompanied by
microstructural abnormalities. DTI
trac-tography of the corpus callosum (Fig.
5
A
–
C
) revealed a pronounced decrease in
axial diffusivity (AD) along the entire
medio-lateral extent of the tract in
Ube3a
m⫺/p⫹mice
compared with control, whereas radial
diffusivity (RD) was unperturbed (Fig.
5
D
,
E
). Therefore, reductions in AD drove
the decreases in mean diffusivity (MD)
and fractional anisotropy (FA) that we
observed for the corpus callosum (Fig.
5
D
,
E
). All tracts that we analyzed exhibited highly significant
statistical effects for both AD and MD except the precommissural
fornix, where decreases in AD only approached significance
(Table 2). Unlike other tracts, the precomissural fornix,
post-commissural fornix, and the fimbria consistently showed
de-creases in RD along with dede-creases in AD. This likely explains the
lack of significant FA effects in these major efferent pathways of
the hippocampus, because FA is sensitive to the
disproportional-ity of AD and RD. We therefore conclude that compromised WM
integrity—in particular, reduced AD—is a general feature of WM
tracts in the adult
Ube3a
m⫺/p⫹brain.
Decreased axon caliber underlies altered WM microstructure
in adult
Ube3a
mⴚ/pⴙmice
A number of axonal abnormalities could lead to reduced AD
within WM tracts (Mori and Zhang, 2006). We performed
elec-tron microscopy to determine factors that could explain AD
def-icits in
Ube3a
m⫺/p⫹mice. Focusing on the anterior midbody of
the corpus callosum, myelination appeared grossly normal (Fig.
6
A
), consistent with a lack of RD deficits within this tract (Fig. 5
E
,
Table 2) (Song et al., 2002;
Song et al., 2005). Although average
g-ratios for
Ube3a
m⫺/p⫹callosal axons were slightly decreased
relative to control (Fig. 6
B
; unpaired two-tailed
t
test,
t
(10)⫽
2.47,
p
⫽
0.03), plots of axon diameter versus g-ratio suggested that
Figure 7. Myelinated callosal axon diameter (linear scale).A,B, Histograms of myelinated callosal axons analyzed in g-ratio (A, replotting ofFig. 6Cdiameter data) and axon caliber analyses (B, replotting ofFig. 6Fdiameter data). Left panels indicate the percentage of axons distributed among bins of the given diameter ranges. Right panels display the same data normalized to wild-type (Ube3am⫹/p⫹) values.n⫽6 mice for each genotypic group. Data represent mean⫾SEM, *pⱕ0.05, **pⱕ0.01,
***pⱕ0.001, ****pⱕ0.0001.
this did not reflect enhanced myelination in
Ube3a
m⫺/p⫹mice (Fig. 6
C
), but rather an
underrepresentation of large-caliber
ax-ons (Fig. 7
A
; two-way ANOVA for
geno-type
⫻
diameter interaction,
F
(3,30)⫽
4.43,
p
⫽
0.01;
post hoc
unpaired
t
test with
Sidak’s multiple comparisons correction,
t
(40)⫽
4.11,
p
⫽
0.0008), which tend to
have higher g-ratios. Indeed, we found
that the caliber of myelinated axons was
markedly affected in the adult
Ube3a
m⫺/p⫹callosum: cross-sectional area was
de-creased by
⬃
25% on average (Fig. 6
D
,
E
;
unpaired two-tailed
t
test,
t
(10)⫽
5.1,
p
⫽
0.0005) and we observed a leftward skew
in the distribution of diameters (Fig. 6
F
;
two-way repeated-measures ANOVA for
genotype
⫻
diameter interaction,
F
(17,170)⫽
6.01,
p
⬍
0.0001;
Fig. 7
B
; two-way
repeated-measures ANOVA for
geno-type
⫻
diameter interaction,
F
(3,30)⫽
14.02,
p
⬍
0.0001), indicating reduced
caliber in both large and small myelinated
axons. Reductions in the caliber of
unmy-elinated callosal axons were much more
modest and did not achieve statistical
sig-nificance (Fig. 8
A
; unpaired two-tailed
t
test,
t
(10)⫽
2.09,
p
⫽
0.06;
Fig. 8
B
; two-way
repeated-measures ANOVA for genotype
⫻
diameter interaction,
F
(15,150)⫽
1.18,
p
⫽
0.3;
Fig. 8
C
; two-way repeated-measures ANOVA
for genotype
⫻
diameter interaction,
F
(4,40)⫽
1.1,
p
⫽
0.37), suggesting that loss of
ma-ternal
Ube3a
may affect the growth of
my-elinated axons preferentially.
Fewer axons or axon collaterals could also compromise WM
integrity, but we found that axon-packing density was actually
increased by
⬃
25% in the callosum of
Ube3a
m⫺/p⫹mice (Fig. 6
G
;
unpaired two-tailed
t
test,
t
(10)⫽
3.15,
p
⫽
0.01). This finding was
corroborated by evidence of increased neuronal packing in
over-lying neocortex (Fig. 9
A
–
E
), including in supragranular layers,
which contribute the majority of axon projections that traverse
the callosum en route to homotopic targets in the contralateral
hemisphere (Fig. 9
D
; unpaired two-tailed
t
test,
t
(4)⫽
2.9,
p
⫽
0.04). In contrast to these differences in neuronal density, glial
density was unchanged (Fig. 9
F
; unpaired two-tailed
t
test,
t
(4)⫽
0.64,
p
⫽
0.56), contributing to a statistically insignificant
differ-ence in total cell density between groups (Fig. 9
G
; unpaired
two-tailed
t
test,
t
(4)⫽
1.95,
p
⫽
0.12).
Reductions in axon caliber reflect deficits in nerve conduction
in adult
Ube3a
mⴚ/pⴙmice
What is the functional significance of reduced axon caliber in
Ube3a
m⫺/p⫹mice? We sought to answer this question by
measur-ing compound action potential conduction in the sciatic nerve
(an easily accessible WM pathway in mice that is amenable to
precise measurements of nerve conduction due to its length).
First, we determined whether axon caliber deficits are
generaliz-able to the
Ube3a
m⫺/p⫹sciatic nerve. We observed grossly normal
myelination, but a significant reduction in mean axon caliber in
sciatic nerves of
Ube3a
m⫺/p⫹mice compared with control (Fig.
10
A
,
B
; unpaired two-tailed
t
test,
t
(10)⫽
2.22,
p
⫽
0.05;
Fig.
11
A
,
B
; unpaired two-tailed
t
test,
t
(10)⫽
0.5,
p
⫽
0.63), similar to
what we had found in the corpus callosum (Fig. 6
C
). However,
relative to callosum (Figs. 6
F
,
7
A
,
B
), the caliber of the largest
sciatic nerve axons in
Ube3a
m⫺/p⫹mice was partially spared (Fig.
10
C
; two-way repeated-measures ANOVA for genotype
⫻
diam-eter interaction,
F
(14,140)⫽
3.33,
p
⫽
0.0001;
Fig. 11
C
; two-way
repeated-measures ANOVA for genotype
⫻
diameter
interac-tion,
F
(3,30)⫽
3.8,
p
⫽
0.02;
post hoc
unpaired
t
test with Sidak’s
multiple comparisons correction,
t
(40)⫽
3.6,
p
⫽
0.003), perhaps
because many of them arise from motor neurons in the ventral
spinal cord, in which the imprinting of paternal
Ube3a
is relaxed
(Huang et al., 2011). Accordingly, the maximum velocity of
com-pound action potentials, a function of nerve conduction though
the largest-caliber axons, was also spared in
Ube3a
m⫺/p⫹sciatic
nerves (Fig. 10
E
,
F
; unpaired two-tailed
t
test,
t
(10)⫽
0.25,
p
⫽
0.81). Nevertheless, mean compound action potential rise
kinet-ics were significantly slower in
Ube3a
m⫺/p⫹sciatic nerves (Fig.
10
G
; unpaired two-tailed
t
test,
t
(10)⫽
2.33,
p
⫽
0.04;
Fig. 10
H
;
unpaired two-tailed
t
test,
t
(10)⫽
2.46,
p
⫽
0.03), reflecting the
deficit in mean axon caliber (Fig. 10
B
).
Discussion
The present findings indicate that
Ube3a
m⫺/p⫹mice closely
model the microcephaly observed in AS individuals and suggest
that a major factor contributing to this phenotype is globally
impaired WM growth during early postnatal development. Our
observations of decreased axon caliber in both the corpus
cal-losum (Fig. 6
D
–
F
) and sciatic nerve (Fig. 10
A
–
C
) of adult
Ube3a
m⫺/p⫹mice lead us to speculate that the radial growth of
axons may be especially perturbed by loss of maternal
Ube3a
.
Figure 8. Analysis of unmyelinated callosal axon caliber in adultUbe3am⫺/p⫹mice.A, Quantification of the cross-sectional area of unmyelinated axons.B, Distribution of the diameters of unmyelinated axons (logarithmic scale).C, Left, Percentage of unmyelinated axons in the corpus callosum distributed among bins of the given diameter ranges. Right, Same data normalized to wild-type (Ube3am⫹/p⫹) values.n⫽6 mice for each genotypic group. Data represent mean⫾SEM.
Potential mechanisms underlying axon caliber deficits and
microcephaly in
Ube3a
mⴚ/pⴙmice
The caliber of the largest sciatic nerve axons in
Ube3a
m⫺/p⫹mice
is relatively preserved (Fig. 10
C
), perhaps reflecting the
persis-tence of paternal
Ube3a
expression in neurons of the ventral
spinal cord (Huang et al., 2011). This is consistent with a
neuron-specific role for UBE3A in regulating radial axon growth, though
we cannot rule out potential effects of UBE3A haploinsufficiency
in myelinating glia, which support radial axon growth
subse-quent to the initiation of myelination (Sa´nchez et al., 1996;
To-mita et al., 2007;
Sherman et al., 2012).
UBE3A interacts with the Armadillo repeat-containing C
ter-minus of the abnormal spindle-like microcephaly (ASPM)
pro-tein (Singhmar and Kumar, 2011), which is encoded by the gene
most frequently mutated in cases of autosomal recessive primary
microcephaly (Bond et al., 2002;
Nicholas et al., 2009). ASPM
localizes to the centrosome and midbody, where it participates in
the positioning of spindle poles and the organization of
microtu-bules into asters, thereby enabling the proper cleavage of
sym-metrically dividing neuroepithelial progenitor cells (Fish et al.,
2006;
Paramasivam et al., 2007;
Higgins et al., 2010). Notably,
acute shRNA-mediated knock-down of UBE3A in immortalized
human kidney cells results in mitotic abnormalities, including
disorganized spindles and misseggregated chromosomes
(Singh-mar and Ku(Singh-mar, 2011). If present in neural stem cell niches in
Ube3a
m⫺/p⫹mice or in individuals with AS, then these defects
could deplete the pool of viable neural progenitors that populate
the brain with neurons, leading to microcephaly. However,
Ube3a
m⫺/p⫹mice, similar to individuals with AS, do not exhibit
microcephaly until the postnatal period, after the completion of
neurogenesis and neuronal migration (Fig. 1). Presumably,
neu-ral stem cells, which bilallelically express
Ube3a
(Judson et al.,
2014), express sufficient UBE3A protein from the paternal allele
to support normal ASPM function in the event of maternal
Ube3a
loss. ASPM expression wanes in postmitotic neurons (Lu¨ers et al.,
2002;
Kouprina et al., 2005;
Williams et al., 2015), whereas the
expression of several other Armadillo repeat-containing
pro-teins, including

-catenin, persists. Considering the numerous
studies linking

-catenin signaling to axon growth,
morphogen-esis, and presynaptic function (Bamji et al., 2003;
Elul et al., 2003;
David et al., 2008;
Pratt et al., 2012;
Taylor et al., 2013), potential
interactions between UBE3A and

-catenin during early
postna-tal development merit investigation.
UBE3A has been linked, albeit tentatively (Jensen et al., 2013),
to regulation of the actin cytoskeleton, which supports terminal
axon branching and the elaboration of developing axonal arbors
Figure 9. Packing density of cortical neurons is increased in adultUbe3am⫺/p⫹mice.A,B, Immunostaining for the neuronal marker NEUN with DAPI nuclear counterstaining in primary somatosensory cortex of⬃P90Ube3am⫹/p⫹(A) andUbe3am⫺/p⫹(B) mice. Scale bars, 200m for far-left panels, 175m for representative counting strips, and 18m for zoomed images of L5 and L2/3.C–G, Quantification of total neuronal density (C), L1– 4 neuronal density (D), L5– 6 neuronal density (E), glial density (F), and total cell density (G).n⫽3 mice for each genotypic group. Data represent mean⫾SEM, *pⱕ0.05.
(Kalil and Dent, 2014). UBE3A is also enriched at nascent
psynaptic terminals and plays a role in experience-dependent
re-finement of synaptic architecture during the early postnatal
period (Yashiro et al., 2009;
Burette et al., 2017;
Kim et al., 2016).
Maternal
Ube3a
loss may thus affect the elaboration of axon
ter-minal arbors through distinct mechanisms: directly, by
disrupt-ing the actin cytoskeleton durdisrupt-ing terminal axon branchdisrupt-ing,
and/or indirectly, through deficits in synapse development and
stabilization. Because terminal arbor size tends to correlate
with the caliber of the parent axon (Stuermer, 1984;
Roe et al.,
1989;
Tsuji and Liberman, 1997;
Eatock et al., 2008;
Perge et
al., 2009), it is possible that reductions in axon caliber in
Ube3a
m⫺/p⫹mice are secondary to deficits in terminal axon
branching.
The development and maintenance of large axons and their
terminal arbors is energetically taxing. Mitochondrial volume
fraction in myelinated axons generally scales quadratically to
in-creases in axon caliber and terminal field size, possibly to match
energy production to the demands of synaptic transmission
within the terminal arbor (Sengupta et al., 2010;
Perge et al.,
2012). Although we did not find evidence of deficient mitochondrial
volume fraction or morphology in the axons of
Ube3a
m⫺/p⫹mice in
this or in previous studies (Wallace et al., 2012;
Burette et al.,
2017;
Judson et al., 2016), UBE3A does associate with
mitochon-drial membranes within neurons of both early postnatal and
adult mice and thus is poised to regulate mitochondrial function
(Burette et al., 2017). This is consistent with recent reports of
increased mitochondrial superoxide in the hippocampus of adult
Figure 10. Reduced axon caliber correlates with deficits in sciatic nerve conduction in adultUbe3am⫺/p⫹mice.A, Representative electron micrographs of the sciatic nerve from⬃P90 Ube3am⫹/p⫹andUbe3am⫺/p⫹mice. Scale bar, 6.4m.B, Quantification of the cross-sectional area of myelinated axons.C, Distribution of the diameters of myelinated axons (logarithmic scale).
D, Schematic forex vivorecording of sciatic nerve conduction.E, Averaged compound action potential for each genotypic group (amplitude-normalized). Dashed lines indicate peak of averaged compound action potentials. Scale bars, 1 ms and 100s (inset).F–H, Quantification of conduction velocity (F), rise time (G), and rise slope (H) for compound action potentials conducted by myelinated A␣fibers.n⫽6 mice for each genotypic group. Data represent mean⫾SEM, *pⱕ0.05, **pⱕ0.001, ****pⱕ0.001.
Ube3a
m⫺/p⫹mice (Santini et al., 2015). It will be interesting to
determine whether mitochondrial dysfunction is more
wide-spread in the brains of young
Ube3a
m⫺/p⫹mice, possibly
impos-ing energetic constraints on axon growth.
Abnormal WM morphology in adult
Ube3a
mⴚ/pⴙmice:
relation to neuroimaging findings in AS
Despite marked reductions in axon caliber, we found that the
myelination of callosal and sciatic nerve axons was largely intact
in adult
Ube3a
m⫺/p⫹mice (Figs. 6
B
,
C
,
11
A
,
B
). Our DTI
tractog-raphy study suggests that this is generally true for other tracts in
the adult
Ube3a
m⫺/p⫹brain as well. RD, often increased in
in-stances of hypomyelination (Song et al., 2002;
Song et al., 2005;
Harsan et al., 2006;
Tyszka et al., 2006), was unchanged in most
tracts or even decreased (Table 2). In contrast, a DTI
tractogra-phy study of children with AS found RD to be increased in WM
tracts throughout the brain (Peters et al., 2011), in agreement
with evidence for delayed myelination garnered from a separate
T2-weighted MRI study of younger children (Harting et al.,
2009). Although these seemingly discrepant findings could
indi-cate species differences in UBE3A function, we think it more
likely that they highlight the disparate developmental periods
explored in our respective studies. We hypothesize that impaired
radial axon growth delays the deposition of myelin within both
central and peripheral WM tracts in AS and achievement of a
minimum axon caliber, presumably delayed in
Ube3a
m⫺/p⫹mice, triggers the initiation of myelination by both
oligodendro-cytes and Schwann cells (Simons and Trotter, 2007;
Nave and
Trapp, 2008). This would suggest that
myelination largely normalizes by
adult-hood, explaining the findings reported
here. To test this hypothesis, future
stud-ies in
Ube3a
m⫺/p⫹mice should establish
the developmental profile of axon caliber
deficits in relation to the course of
myeli-nation. Likewise, future AS neuroimaging
studies should include adult subjects.
Prior neuroimaging studies focused on AS
individuals with large deletions of
mater-nal 15q11-q13 (Harting et al., 2009;
Pe-ters et al., 2011), which result in the
haploinsufficiency of important genes
(e.g., GABA
Areceptor subunits) in
addi-tion to
UBE3A
(Margolis et al., 2015).
This facet of the disorder, not modeled by
the
Ube3a
m⫺/p⫹mouse, could also
con-tribute to the WM pathology associated
with maternal
UBE3A
loss in humans.
Functional implications of axon caliber
deficits in adult
Ube3a
mⴚ/pⴙmice
Reduced axon caliber was commensurate
with the slowing of compound action
poten-tials in the sciatic nerves of
Ube3a
m⫺/p⫹mice
(Fig. 10). This functional deficit may
con-tribute to the motor dysfunction seen in
the model (Jiang et al., 1998;
van Woerden
et al., 2007;
Huang et al., 2013;
Mandel-Brehm et al., 2015;
Santini et al., 2015). If
slowed conduction of action potentials is
a property of all WM tracts in
Ube3a
m⫺/p⫹mice, this could have a profound
brain-wide impact on neural circuit function. For
example, slowed conduction could disrupt brain rhythms that
provide a temporal framework for grouping and integrating
in-formation within and across distributed neural networks;
abnor-mal brain rhythmicity is well documented in both
Ube3a
m⫺/p⫹mice
and in individuals with AS (Colas et al., 2005;
Thibert et al., 2013;
Judson et al., 2016) and may precipitate a range of phenotypes,
including cognitive deficits, sleep disturbances, and seizures.
Brain rhythms are highly conserved over the course of
mamma-lian evolution, and large-caliber axons have been proposed to
enable interareal neural synchrony despite tremendous increases
in brain scale. Importantly, the bigger the brain, the greater the
dependence on rapidly conducting, large-caliber axons (Buzsa´ki
et al., 2013). Therefore, we suggest that decreased axon caliber
consequent to loss of UBE3A function may have a far greater
functional impact in humans than in mice.
The extent to which axon caliber deficits contribute directly to
neural circuit and behavioral dysfunction in
Ube3a
m⫺/p⫹mice
remains to be determined. Nevertheless, our findings
demon-strate that WM abnormalities are a pervasive feature of the adult
Ube3a
m⫺/p⫹brain and these abnormalities are easily detected by
standard structural neuroimaging. This also appears to be the
case for children with AS (Harting et al., 2009;
Peters et al., 2011;
Wilson et al., 2011;
Tiwari et al., 2012); importantly, the severity
of WM microstructural defects in these children may be
associ-ated with clinical outcome (Peters et al., 2011). Structural
neuroimaging-based studies could further explore the
relation-ship between WM defects and clinical phenotypes in AS and
potentially establish WM volume and integrity as noninvasive
Figure 11. Analysis of g-ratio and diameter (linear scale) of myelinated axons in the sciatic nerve of adultUbe3am⫺/p⫹mice.
A, Quantification of mean axon g-ratio.B, Plots of axon g-ratio versus diameter, fit with a linear function.C, Axon diameter histograms, linear scale (replotting ofFig. 10Cdiameter data). Left panels indicate the percentage of axons distributed among bins of the given diameter ranges. Right panels display the same data normalized to wild-type (Ube3am⫹/p⫹) values.n⫽6 mice for each genotypic group. Data represent mean⫾SEM, **pⱕ0.01.