THE ASSOCIATION BETWEEN PRENATAL AND NEONATAL COMPLICATIONS AND AUTISM SPECTRUM DISORDER IN THE CHILD
Christina Cordero
A dissertation submitted to the faculty at the University of North Carolina at Chapel Hill in partial fulfillment of the requirements for the degree of Doctor of Philosophy in the Department
of Epidemiology in the Gillings School of Global Public Health.
Chapel Hill 2017
Approved by:
Julie Daniels
Anna Maria Siega-Riz
Stephanie Engel
Amy Herring
iii ABSTRACT
Christina Cordero: The Association Between Prenatal and Neonatal Complications and Autism Spectrum Disorder in the Child
(Under the direction of Julie Daniels)
The documented prevalence of autism spectrum disorder (ASD) has increased in recent
years. ASD is a heterogeneous group of neurodevelopmental disorders with multiple factors
involved; however, specific causal factors remain relatively unknown. Previous studies have
shown associations between prenatal and neonatal complications and neurodevelopmental
disorders. However, they are limited by small samples sizes, the use of administrative data, or by
not accounting for confounding or interaction.
To address these limitations, this study utilized data from the Study to Explore Early
Development, a population-based case-control study with data from medical records and
maternal report collected from six study sites located in the United States. A clinical evaluation
classified each child as meeting criteria for ASD (ASD n=698), having a developmental disorder
or delay without traits of ASD (DD n=887), or as a population control (POP n=979). In Aim 1,
we evaluated the association between maternal diabetes (n=246) and hypertensive disorders
(n=386) and ASD, two common complications of pregnancy. In Aim 2, we evaluated the
association between neonatal jaundice (n=1239) and ASD, which is variably associated with
ASD in previous literature. In our analysis, we controlled for confounding and assessed whether
the observed associations were modified by other factors such as maternal body mass index and
gestational age. We evaluated how associations varied when comparing ASD to POP versus DD
iv
association with maternal hypertensive disorders and ASD (aOR=1.67[95% CI 1.25, 2.23]), and
similarly with DD; but no association with diabetes and ASD. In Aim 2, neonatal jaundice was
associated with ASD in infants born 35-37 weeks (aOR=1.83[95% CI 1.05, 3.19]) and also with
DD, but not in infants born ≥38 weeks.
Our findings suggest that maternal hypertensive disorders and neonatal jaundice are
associated with ASD. Future studies should investigate the role of timing and severity of these
disorders in association with ASD. These results can help identify children at higher risk of
developmental disorders for whom developmental screening at younger ages may allow for
v
ACKNOWLEDGEMENTS
I am immensely grateful to my committee Drs. Julie Daniels, Anna Maria Siega-Riz,
Stephanie Engel, Amy Herring, and Catherine Vladutiu, for their instruction, commitment, and
support throughout this dissertation. I am especially thankful to my dissertation chair and
advisor, Julie Daniels, for going above and beyond with her mentorship, guidance, and
encouragement, and for having the patience and dedication to teach me and challenge me.
I am also grateful to my collaborators from the Study to Explore Early Development
whose expertise has been invaluable, particularly Laura Schieve, Gayle Windham, and Lisa
Croen.
I am also appreciative of the financial support provided by UNC, the Study to Explore
Early Development, and a pre-doctoral training grant from the National Institute for Child Health
and Human Development.
To my professors at UNC, thank you for providing the foundation that made this
dissertation possible. And to my classmates and friends, thank you for teaching me, supporting
me, providing constant feedback, and making this whole process enjoyable.
And finally, I would like to thank my family: my mother for being my greatest supporter
and constantly showing me what strength is, my father for teaching me to be independent, my
brother for pushing me to achieve my goals, and my grandparents, whose selfless decision to
leave everything behind and come to this country for better opportunities for me will never be
vi
TABLE OF CONTENTS
LIST OF TABLES ... viii
LIST OF FIGURES ... x
LIST OF ABBREVIATIONS ... xi
CHAPTER 1. INTRODUCTION AND SPECIFIC AIMS ... 1
A. Introduction ... 1
B. Specific aims ... 3
CHAPTER 2. BACKGROUND ... 5
A. The etiology of autism spectrum disorder is relatively unknown ... 5
B. Critical window of brain development ... 6
C. Environmental exposures during the prenatal and neonatal period ……….. 7
D. The role of diabetes in pregnancy on neurodevelopment ... 11
E. The role of hypertension in pregnancy on neurodevelopment ... 13
F. The role of neonatal jaundice on neurodevelopment ... 21
CHAPTER 3. METHODS ... 27
A. Study design ... 27
B. Study population ... 28
C. Outcome assessment ... 29
D. Exposure assessment ... 32
E. Covariate assessment ... 44
F. Statistical analysis ... 45
vii
CHAPTER 4: MATERNAL DIABETES AND HYPERTENSIVE DISORDERS IN
ASSOCIATION WITH AUTISM SPECTRUM DISORDER ... 54
A. Introduction ... 54
B. Methods ... 55
C. Results ... 61
D. Discussion ... 63
CHAPTER 5: NEONATAL JAUNDICE IN ASSOCIATION WITH AUTISM SPECTURM DISORDER ... 73
A. Introduction ... 73
B. Methods ... 74
C. Results ... 79
D. Discussion ... 81
CHAPTER 6. DISCUSSION………. ... 90
A. Summary ... 90
B. Prenatal complications and ASD ... 91
C. Neonatal complications and ASD ... 94
D. Strengths & limitations ... 99
E. Future directions ... 104
F. Conclusions... 105
viii
LIST OF TABLES
Table 2.1. Summary of studies that have looked at the association between diabetes or
hypertension in pregnancy and ASD ... 15
Table 2.2. Summary of studies that have looked at the association between neonatal jaundice or hyperbilirubinemia and ASD ... 24
Table 3.1. Instruments administered in SEED and criteria for ASD classification ... 31
Table 3.2. Sources of data in SEED pertaining to diabetes in pregnancy ... 35
Table 3.3. Criteria for diagnosis of GDM ... 37
Table 3.4. Sources of data in SEED pertaining to hypertension in pregnancy ... 38
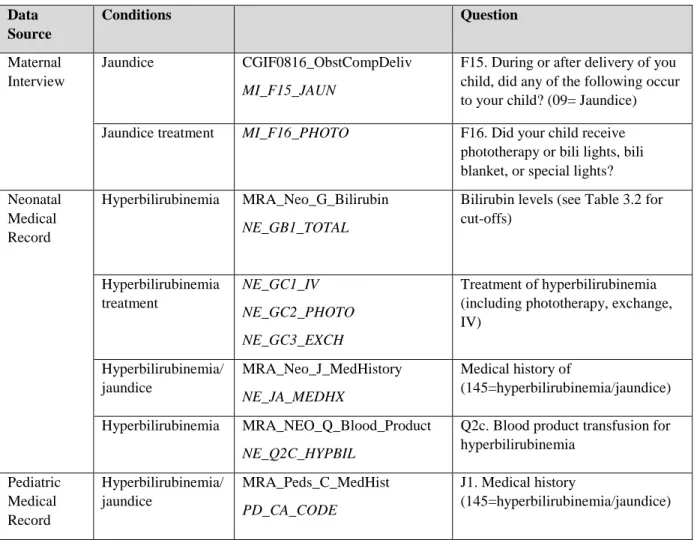
Table 3.5. Sources of data in SEED pertaining to neonatal jaundice ... 41
Table 3.6. Bilirubin measurement cut-offs for hyperbilirubinemia and visible jaundice for infants 35 weeks gestational age (193) ... 43
Table 3.7. Summary of covariates associated with perinatal exposures and with ASD in the child... 45
Table 3.8. Statistical power obtained to detect an association with ASD by effect size for the exposures of maternal diabetes, maternal hypertension, and neonatal jaundice according to CGI ... 53
Table 4.1. Distribution of maternal characteristics during pregnancy with index child born September 2003-August 2006, by child outcome classification and maternal condition in SEED (N=2,564) ... 67
Table 4.2. Associations between maternal diabetes or hypertensive disorders and ASD or DD in SEED ... 70
Table 4.3. Associations between maternal diabetes or hypertensive disorders and ASD with (n=258) and without (n=429) intellectual disabilities (ID) in SEED ... 71
Table 4.4. Stratum-specific effect estimates for maternal diabetes and hypertensive disorders for three strata of maternal pre-pregnancy BMI in SEED ... 72
Table 5.1. Distribution of maternal and infant characteristics by outcome classification and jaundice type in children born September 2003-August 2006 enrolled in SEED (N=2,561)... 85
ix
Table 5.3. Stratum-specific estimates by gestational age for the association between neonatal jaundice and ASD with or without ID SEED ... 88
x
LIST OF FIGURES
Figure 2.1. Mechanistic pathway for diabetes and hypertension in pregnancy and fetal
neurodevelopment ... 10
Figure 2.2. Biological mechanism for neonatal jaundice and hyperbilirubinemia in association with the development of ASD ... 23
Figure 3.1. SEED recruitment and final classification of participants. ... 30
Figure 3.2. Bhutani curve for hyperbilirubinemia cut-offs (193) ... 42
Figure 3.3. Directed Acyclic Graph (DAG) of the relationship between maternal diabetes in pregnancy in Specific Aim 1a and the outcome of ASD or DD ... 47
xi
LIST OF ABBREVIATIONS
ACOG American Congress of Obstetricians and Gynecologists
ADA American Diabetes Association
ADI-R Autism Diagnostic Interview- Revised
ADOS Autism Diagnostic Observation Schedule
aOR Adjusted odds ratio
ASD Autism spectrum disorder
BMI Body mass index
BP Blood pressure
CDC Centers for Disease Control and Prevention
CGI Caregiver interview
DD Developmental disorder or delay
DSM Diagnostic and Statistical Manual of Mental Disorders
GDM Gestational diabetes
HELLP Hemolysis, elevated liver enzymes, and low platelets
HTN Hypertension
ICD International Classification for Disease
OGTT Oral glucose tolerance test
OR Odds ratio
OSS Obstetric suboptimality
PIH Pregnancy induced hypertension
POP Population control group
RRB Restricted interests and repetitive behaviors
xii SEED Study to Explore Early Development
SES Socioeconomic status
T1DM Type 1 diabetes
T2DM Type 2 diabetes
1
CHAPTER 1. INTRODUCTION AND SPECIFIC AIMS
A. Introduction
Autism spectrum disorder (ASD) is a heterogeneous group of neurodevelopmental
disorders characterized by impaired socialization and communication, and repetitive and
stereotyped interests and behaviors. The documented prevalence of ASD has increased in recent
years; ASD affects one in 68 children, and 1 in 42 boys, aged 8 (1). Causes of ASD remain
unknown, but it is believed to be a complex disease involving both genetic and environmental
factors (2, 3). Recent studies provide evidence for gestation and the early postnatal period as
sensitive time windows for ASD. One study suggests that formation of the cortical layer in utero
may be disrupted among children with ASD (4). Other studies have shown that deficits in eye contact and ability to follow the parent’s eye gaze (joint attention) are present in infants less than
a year old (5, 6).
Perinatal complications have been associated with an increased risk of developmental
difficulties in children including ASD (7-13). Several studies have reported associations with the
most common prenatal complications (maternal diabetes and hypertension) and most common
neonatal complication (neonatal jaundice) and ASD (14-18). We hypothesize that the changes to
the perinatal environment associated with these conditions through pathways such as increased
inflammation and oxidative stress, over-nutrition (with diabetes) and nutritional insufficiencies
and growth restriction (with hypertension) (19), and increases in potentially neurotoxic
substances (12, 20-22). This may lead to alterations in gene expression patterns or neural
2
and lead to ASD (23-25). More recently, observational studies have begun evaluating these
specific conditions, but have been limited by: 1) the sample size to study a rare exposure and rare
outcome, 2) the exposure and outcome definitions are obtained from a secondary source without
confirmation, and 3) specific complications are not modeled independently, but instead are
modeled in aggregate with other conditions, without properly accounting for confounding or
interaction.
We address these limitations from previous studies utilizing a large, community-based,
case-control study, the Study to Explore Early Development (SEED). We evaluate the
association of the most common complications in pregnancy, maternal diabetes and
hypertension, with ASD, adjusting for confounding and assessing for interaction by body mass
index (BMI). We also evaluate the association of the most common complication in the neonatal
period, neonatal jaundice, with ASD, adjusting for confounding and assessing for interaction by
gestational age.
SEED is the largest study of children with ASD in the United States to-date and provides
the optimal data to evaluate these relationships (26). SEED was designed to identify etiological
risk factors for ASD and collected data on potential risk factors from multiple sources, including
prenatal and neonatal medical records and maternal interview and questionnaires. SEED has also
carefully characterized ASD through in-depth clinical assessment and allows comparison of
children with ASD to children with other developmental delays (DD) and a population-based
sample (POP) of children of the same age and location from the community. The ability to also
compare associations among children with DD to POP children allows us to determine the
specificity of any observed associations. We take advantage of this large, rich existing data to
3 B. Specific aims
Specific Aim 1: To examine the association between prenatal complications and
autism spectrum disorder in the child. The most common complications in pregnancy,
diabetes and hypertension, have been observed in relation to the development of ASD in the
child. We expand upon recent findings to evaluate whether this association was specific to ASD,
or also observed with DD. We also assessed the complex role of BMI and whether having both
conditions increased risk, as multiple conditions can confound or modify these associations, or
act as mediators on the causal pathway.
Specific Aim 1a: To examine the association between diabetes in pregnancy and autism
spectrum disorder in the child. The classification of mothers with diabetes in pregnancy
includes those with a new diagnosis of gestational diabetes or diabetes that was diagnosed prior
to pregnancy and continued into their pregnancy.
Hypothesis: We hypothesize that maternal diabetes during pregnancy will be positively
associated with ASD in the child. Rationale: Diabetes affects maternal inflammatory response,
oxidative stress, fetal nutrition, and fetal metabolism, all which may affect fetal
neurodevelopment.
Specific Aim 1b: To examine the association between hypertensive disorders in
pregnancy and autism spectrum disorder in the child. Hypertensive disorders in the mother are
classified as either a diagnosis of hypertension prior to pregnancy with elevated blood pressures
during pregnancy, or as a hypertensive disorder that was induced by pregnancy, including
4
Hypothesis: We hypothesize that hypertensive disorders in pregnancy are positively
associated with ASD in the child. Rationale: Maternal hypertension is associated with reduced
placental perfusion, changes in fetal oxygen and nutrient consumption, and inflammation and
oxidative stress impacting the neurodevelopment of the fetus.
Specific Aim 2: To examine the association between neonatal complications and
autism spectrum disorder in the child. We evaluated the association between neonatal
jaundice and hyperbilirubinemia in association with the development of ASD in the child, and
assessed for interaction with gestational age at birth. We assessed the strength of the association
by the method used to define jaundice. We used bilirubin measures from the medical record to
assess if the association is stronger among infants that present with more severe jaundice. We
evaluated if this association was specific to ASD, or also observed with DD.
Hypothesis: We hypothesize that jaundice and hyperbilirubinemia will be positively
associated with ASD in the child. Rationale: Neonatal jaundice may be indicative of high levels
5
CHAPTER 2. BACKGROUND
A. The etiology of autism spectrum disorder is relatively unknown
Autism spectrum disorder (ASD) is a group of neurodevelopmental disorders that are
typically diagnosed in early childhood, usually before the age of three, and characterized by
impaired social interactions, impaired verbal and non-verbal communication, and restricted
interests and repetitive behavior patterns. ASD affected one in 68 children aged 8 in 2010, with a
higher prevalence of 1 in 42 observed in boys, according to the most recent estimates from the
Centers for Disease Control and Prevention (CDC) (1). The documented prevalence of ASD has
increased dramatically over the past few decades, in part because of better diagnosis and
increased awareness (27, 28). A child with ASD requires constant and long-term care from
family members and healthcare professionals and therefore carries a large emotional and
financial burden. It is estimated that a child with ASD incurs an additional $17,000 per year in
medical costs compared to a child without ASD (29) and additionally requires intensive
behavioral interventions estimated at $40,000 to $60,000 per child per year (30). Despite the
large burden of ASD, little is known about its causes. Early studies in families estimated that
about 90% of ASD were heritable (31-34), yet more recent estimates suggest the heritability to
hover around 50% (2, 3). Earlier studies do not seem to distinguish between a condition being
heritable versus genetic, using these terms interchangeably while heritable diseases can have
environmental components. Few gene loci have been consistently identified in association with
ASD (2), leading researchers to believe that ASD may more likely be heritable due to shared
6
etiological research focus has shifted to investigate the interaction between genes and
environment, where environmental factors trigger or mediate ASD phenotypes in individuals that
are genetically vulnerable (35). Twin studies are often used to evaluate the influence of genetic
and environmental factors on individuals. The largest population-based twin study to date found
that shared environmental factors account for 55% of the variance of risk for ASD among twins,
while genetic factors only account for approximately 37% (2). A common theory is that multiple
causes are likely to operate in the etiology of ASD, which can include several combinations of
genes and environmental factors, broadly defined as any factor that is not genetic (9). By
definition, this would classify ASD as a complex disorder where multiple factors contribute to its
development. Epidemiological investigations are needed to determine which specific factors are
involved.
B. Critical window of brain development
The brain begins to develop in utero and continues through early childhood (36). Brain
imaging studies using MRI have found distinct differences in brain volume (having more gray
and white matter) and atypical growth patterns in early life of children with ASD (37, 38).
Etiologic studies of ASD have started to focus on events during the prenatal and perinatal period,
as this is known to be of critical importance to brain formation and development. A study
recently published in the New England Journal of Medicine identified that areas of the prefrontal
and temporal cortex, which begins to develop in utero, displayed disrupted growth and
layer-specific neuronal differentiation in children with ASD (4). These results support findings from an
earlier brain autopsy study that reported abnormalities in the structure of the frontal and temporal
cortex in individuals with ASD (39), emphasizing the importance of conditions that can impact
7
differences in infants who are later identified to have ASD. One study found that infants have
eye gaze deficits characteristic of ASD as early as 2-6 months of age (6), suggesting early
deviation in brain development. Another study further reported decreased joint attention
initiation in infants 8-12 months that later develop ASD (5).
C. Environmental exposures during the prenatal and neonatal period
A number of prenatal exposures are associated with an increased risk of the child
developing ASD. Exposures such as maternal smoking during pregnancy (43), maternal
medication use and exposure to infections (44-49) and related complications such as threatened
abortion before 20 weeks (50, 51), bleeding during pregnancy (43), and intra-uterine growth
retardation (43, 50, 52, 53), have all been associated with an increase risk in ASD. Obstetric
factors and indicators of poor neonatal health such as preterm birth (43, 46, 52-58), low birth
weight (43, 50, 53, 59), and cesarean section (43) have also been associated with ASD.
Yet, results across studies have been inconsistent and vary based on study design and
methodology. Many studies have grouped multiple complications of pregnancy, labor, and the
neonatal period together to create an overall obstetric suboptimality score (OSS), which has also
been associated with an increased risk in ASD (60, 61). Others have examined specific
complications of pregnancy, but have not presented results adjusted for confounding (58, 62).
Recent studies have reported maternal metabolic conditions to be associated with ASD. Specific
factors such as high body mass index (BMI) (12, 63-65), maternal weight gain (35), hypertensive
disorders (12, 43, 66), and diabetes (12, 35, 64, 67) were included in these studies. However,
inferences are limited due mainly to small sample sizes and possibility of bias. For example,
many studies have not adequately adjusted for confounding—some adjust for mediators on the
8
measures (43, 52, 68). Nonetheless, early results from these studies suggest these conditions may
be important and warrant more rigorous investigation.
Diabetes and hypertension, the two most common complications in pregnancy, can
impact the development of the fetus. The pathogenicity of these conditions in relation to ASD
include the role of obesity on endogenous hormones such as leptin (69-72) and testosterone (64,
73, 74), the effect of inflammation and oxidative stress on the fetus (75, 76), and a difference in
maternal nutritional stores such as folic acid (77, 78) and fatty acids necessary for brain
development such as docosahexaenoic acid (DHA; 79) (see Figure 2.1). Table 2.1 describes
studies that have evaluated the association between diabetes or hypertension in the mother and
the development of ASD in the child. These are further discussed in Section D and E, which
describe in detail the role of maternal diabetes and hypertension on the early neurodevelopment
of the child.
Several exposures during the early postnatal period have been shown to affect
neurodevelopment. Events during birth, such as labor complications (80-82), hypoxia (83-87), or
low Apgar score (88-92) have been implicated as causal factors for psychiatric or
neurodevelopmental disorders. Being born preterm (86, 93), with low birth weight or small for
gestational age (94, 95), has also been associated with developmental delays or disorders. In
infancy and early childhood, toxic exposures such as lead (96-98), iron deficiency anemia (99,
100), or inflammatory responses to infections also affect brain development (101-104). Some of
these birth outcomes and neonatal exposures have also been associated with an increased risk of
ASD, such as Apgar score or small for gestational age (43, 52), preterm birth (52, 53, 71, 105),
9
Insufficient studies have been conducted to evaluate the role of neonatal complications
with ASD. Most studies to date include all prenatal, obstetric, and neonatal complications under
one category (i.e. obstetric complications or obstetric suboptimality) or in combination of
different complications in the same statistical model, adjusting for all factors in each reported
measure even if they are not confounders. Few studies have analyzed the role of neonatal
jaundice independently with appropriate assessment of confounding. Because jaundice is not
typically reported in the birth record, exposure assessment in previous studies has relied on
maternal report or access to some medical records. Results from these studies, shown in Table
2.2 and discussed in Section F, are difficult to interpret due to limitations with inadequate sample
sizes, inappropriate selection of comparison groups, differing definition of jaundice, and
potential for bias by not adjusting for confounders or assessing for interaction with gestational
10
11
D. The role of diabetes in pregnancy on neurodevelopment
Gestational diabetes (GDM), defined as any degree of glucose intolerance with onset
during pregnancy, is one of the most common complications during pregnancy. The Agency for
Healthcare Research and Quality pooled data from different studies to estimate a prevalence of
6- 7% of pregnancies complicated by GDM, with a range of 1 to 25% depending on
sociodemographic factors (15, 16). Screening for GDM occurs during 24-28 weeks of gestation,
or earlier for women with clinical characteristics consistent with high risk of GDM (107). GDM
is often difficult to distinguish from type II diabetes mellitus (T2DM) as T2DM can go
unrecognized until the woman receives medical care during pregnancy. Accounting for diabetes
existing prior to pregnancy, approximately 10% of pregnancies are complicated by these
disorders (108). With the rise in obesity, these estimates are increasing (109).
Changes in insulin production and glucose metabolism normally occur during pregnancy
to promote fat storage to sustain the growing fetus and to prepare for lactation (110). Fatty acids
are also necessary for synapse formation during fetal brain development, with changes in fatty
acid availability directly affecting neuronal pathways (111). An imbalance of insulin and glucose
levels can make the body insulin resistant. Insulin resistance induces dyslipidemia and chronic
inflammation in adipose, muscle, and liver tissue detected by the presence of inflammatory
markers (112). Many of these inflammatory markers have been shown to cross the placenta and
enter fetal circulation (22, 110, 113-115). Fetal brain development can be disrupted by the
presence of inflammatory markers that cross the placenta and affect neural pathways and gene
expression. In animal models, increased levels of maternal inflammatory markers result in
offspring with seizures, impairments in learning and cognitive development, and abnormalities in
12
markers of inflammation and oxidative stress as well as lipid mediators in the blood, all of which
can cross the blood-brain barrier and affect neurodevelopment (118-122). A recent study using
lymphoblastoid cell lines obtained from children with ASD compared with their typically
developing siblings found a significant increase in cell necrosis when exposed to oxidative and
nitrosative stress (123).
Additionally, maternal insulin resistance may adversely affect fetal development,
particularly if the fetus develops hyperglycemia and increases insulin production due to the mother’s hyperglycemic state (124). Mothers with diabetes often give birth to macrosomic
infants, increasing the risk for obstructed labor, perinatal hypoxia-ischemia, and birth injury
(125). Diabetic mothers are also more likely to suffer from placental insufficiency resulting in
fetal growth restriction, which can adversely impact brain development (126, 127).
Fetal hyperinsulinemia can also lead to an increase in fetal metabolism and oxygen
consumption, resulting in hypoxia of the uterine tissue and if prolonged–fetal iron deficiency,
which has been associated with behavioral and developmental disorders (128-131). The
insulin-induced high glucose uptake may also cause relative cellular hypoxia in the in utero environment
(132, 133). Clinical studies have also shown that maternal insulin resistance during pregnancy is
associated with deficits in fine and gross motor function in the child, as well as with language
impairments, low verbal IQ, greater inattention and hyperactivity, and poorer cognitive function
(134-140). Maternal diabetes during pregnancy has also been associated with neonatal
complications such as congenital anomalies (141, 142) and neonatal jaundice (143).
Several epidemiological studies have reported positive associations between maternal
diabetes and ASD (60, 62, 68, 144). However, others have not reported statistically significant
13
inconclusive due to small numbers of exposed cases and potential bias from study design and
statistical modeling approach. There is also great variation in the assessment of diabetes and
outcomes that may have led to misclassification and impacted study results.
E. The role of hypertension in pregnancy on neurodevelopment
Like diabetes, maternal hypertension may exist prior to pregnancy, develop during the
pregnancy, or be associated with other complications such as preeclampsia, eclampsia, or
hemolysis, elevated liver enzymes and low platelets (HELLP) syndrome. Preeclampsia affects
about 3% of pregnancies while all hypertensive disorders complicate 5-10% or pregnancies (17,
18, 145). These rates have been increasing in the past few years, likely attributed to the rise of
obesity and maternal age at time of conception (145). As with diabetes, hypertension in
pregnancy can produce a low-level continuous state of inflammation in the fetus that can cause
brain damage, even in the absence of hypoxia (146). In fact, because blood pressure is
independently related to plasma insulin, many of the adverse fetal effects from maternal
hypertension are similar to those from diabetes (147).
Hypertension during pregnancy can result in reduced placental perfusion, limiting
nutrients and iron to the fetus, and typically results in intrauterine growth restriction, preterm
delivery, and infants that are small for gestational age (20, 148-151). Hypertensive disorders
have also been reported to cause asphyxia of the fetus (20, 152). Hypoxia-ischemia while in
utero has shown the strongest association with brain injury (153-156). Both intrauterine growth
restriction and asphyxia are associated with altered brain development and have been associated
with several neurodevelopmental disorders (8, 105, 157-159). Conditions of fetal hypoxia and
fetal iron deficiency are often present together when the mother is hypertensive, and has been
14
neurodevelopment (130, 131). Previous studies have reported an increased risk of several
developmental disorders and delays with hypertensive disorders during pregnancy (160-162).
Positive associations have also been reported between hypertension in pregnancy or
preeclampsia/eclampsia and ASD (12, 67, 68, 71, 163).
While obstetric suboptimality scores (OSS) that include diabetes and hypertensive
disorders in combination with a variety of problematic obstetric conditions have been associated
with ASD, it is necessary to study each exposure apart from the other factors. Most of the studies
to date (Table 2.1) included maternal diabetes and hypertension along with all other prenatal and
perinatal complications in association with ASD, without accounting for the other conditions.
This may be because they lacked sufficient data or the large sample size required to have
sufficient power to assess both a rare exposure and a rare outcome. Further, many of these
studies only have data from one source that does not include information on the timing or
severity of disease.
To address these limitations and those previously discussed in Section D, we investigate
the association between maternal diabetes and hypertension with ASD in SEED. SEED is a large
multi-site case-control study with detailed data on ASD and perinatal conditions, as well as
important covariates related to maternal characteristics and health history. Utilizing SEED, we
can study rare exposures such as maternal diabetes and hypertensive disorders independently,
and also subclassifications of these conditions based on onset. We are also able to assess for
interaction with BMI and evaluate the specificity of this association by comparing it to that with
15
Table 2.1. Summary of studies that have looked at the association between diabetes or hypertension in pregnancy and ASD
First author, year
Data source, population, and
study period Design, confounders
Exposures (n with ASD), ascertainment
Outcome (n with
outcome), ascertainment Measures of association
J. Piven, 1993 (61)
53 autistic probands and their 63 siblings who were enrolled in a family study at Johns Hopkins
Sibling-matched case-control study; maternal parity
Obstetric suboptimality score using Gilbert Optimality Scale and data from maternal interview or medical records.
n=39 “autistic subjects” matched with n=39 randomly matched sibling controls.
Null
N. Juul-Dam, 2001 (58)
74 children seen at a research center in California.
Case-control study; none. 28 pre-, peri-, and neonatal risk factors obtained from parental interview and available obstetric and neonatal records. Including gestational diabetes (n=6), preeclampsia (n=8), and hyperbilirubinemia (n=22).
Children with PDD (n=74) diagnosed between 2.5 to 4 years old using DM-IV and ADI-R criteria, reevaluated at 5 yrs old where autism n=51 (10 excluded due to incomplete records) and PDD-NOS=13.
Incidence was not statistically significantly higher at an alpha=0.05 level for GDM or preeclampsia, was statistically significantly higher for hyperbilirubinemia. C.M. Hultman, 2002 (43) Swedish Birth Register linked to the Swedish Inpatient Register from 1987-1994.
Population-based nested case-control study. Conducted analysis with a crude model and with a model that included all other variables in the analysis.
Maternal, pregnancy, and infant characteristics, including complications during pregnancy, delivery and the neonatal period classified by 8 and ICD-9. Includes diabetes (n=4) and hypertensive diseases (n=24).
Children discharged with a main diagnosis of infantile autism according to ICD-9 from any hospital in Sweden before 10 years of age (n=408).
Diabetes adjusted OR=1.2 (95% CI 0.3-5.7)
16
First author, year
Data source, population, and
study period Design, confounders
Exposures (n with ASD), ascertainment
Outcome (n with
outcome), ascertainment Measures of association
H. Leonard, 2006 (62)
Linked datasets of 236,964 children born in Western Australia between 1983-1992.
Population-based case-control study; did not adjust for covariates.
Preexisting medical conditions recorded on the midwives’ notification form for all births using ICD-9, including diabetes (n=6).
Ascertained educational and disability services sources that link to the birth record using DSM-IV criteria, including children with mild to moderate ID (n=2462), severe or profound ID (n=212), and ASD with ID (n=191). Compared to children without ID.
Diabetes (ASD with ID vs. no ID) OR=2.89 (95% CI 1.28-6.51)
Diabetes (Mild-moderate ID vs. no ID) OR=1.69 (95% CI 1.26-2.27)
S. Buchmayer, 2009 (52)
Swedish Birth Register linked to the Hospital Discharge Register from 1987-2002.
Population-based case-control study. Conducted analysis with a crude model and with a model that included all other variables in the analysis.
Several maternal, pregnancy-related, and neonatal factors collected from the Birth Register and Discharge Register including diabetes mellitus (n=18), gestational hypertension (n=21), preeclampsia (n=39).
Children discharged with a main diagnosis of infantile autism according to ICD-9/ICD-10 from any hospital in Sweden before 10 years of age (n=1,216).
Diabetes crude OR=1.13 (95% CI 0.67-1.89)/ adjusted OR=0.90 (95% CI 0.49-1.67)
Gestational hypertension crude OR=1.18 (95% CI 0.73-1.92)/adjusted OR=1.04(95% CI 0.59-1.81)
17
First author, year
Data source, population, and
study period Design, confounders
Exposures (n with ASD), ascertainment
Outcome (n with
outcome), ascertainment Measures of association
I. Burstyn, 2010 (68)
Provincial delivery records for singleton live births in Alberta, Canada between 1998-2004.
Population-based birth cohort. Conducted analysis controlling for all maternal, obstetric, and neonatal risk factors that were collected.
Maternal and obstetric risk factors extracted from the delivery records, including pre-pregnancy diabetes (n=16) and GDM (n=54), and preeclampsia (n=27).
Children that were assigned an ICD-9 code for ASD by physician billing from at least one claim from any physician (n=1,138)
Pre-pregnancy diabetes RR=1.65 (95% CI 1.01-2.71)
GDM RR=1.24 (95% CI 0.94-1.65)
Preeclampsia RR=1.49 (95% CI 1.00-2.23)
J. R. Mann, 2010 (67)
Women with
singleton pregnancies in South Carolina Medicaid billing records from 1996-2002
Birth cohort from SC; controlling for maternal age, race, alcohol use, and educational
attainment, year of birth, child’s sex.
Maternal conditions/diseases during pregnancy
(Preeclampsia n=52), lifestyle factors reported on the birth certificate, and child anomalies.
ASD determined by all children receiving services from the SC Department of Disabilities and Special Needs or diagnosed with ICD-9 by at least two different providers (n=472)
Preeclampsia/eclampsia OR=1.69 (1.26-2.28)
L. Dodds, 2011 (71)
All live births in Nova Scotia Perinatal Database between 1990-2002.
Retrospective,
longitudinal cohort study. Presented univariate results without controlling for confounding.
Pre-pregnancy factors (diabetes n=7), prenatal factors, and pregnancy diseases/conditions (GDM n=32; PIH n=106), labor and delivery variables, and neonatal factors and neonatal diseases/conditions. OSS.
18
First author, year
Data source, population, and
study period Design, confounders
Exposures (n with ASD), ascertainment
Outcome (n with
outcome), ascertainment Measures of association
P. Krakowiak, 2012 (12)
CHARGE study, 1,004 children between 24-60 months in California recruited from 2003-2010.
Population-based case-control study; maternal age, race/ethnicity, education level, delivery payer, calendar time.
Metabolic conditions (MC), type 2 diabetes (n=4), GDM (n=44), history of
hypertension (n=19), and obesity (n=111). Assessment by questionnaire and medical records (available for half).
Children with a prior diagnosis of ASD were confirmed with the ADI-R and ADOS (n=517). SCQ administered to DD (n=172) and GP (n=315) children to evaluate for ASD.
Diabetes OR=1.52 (95% CI 0.82-2.83)
Hypertension OR=2.84 (95% CI 0.94-8.56)
Obesity OR=1.67 (95% CI 1.10-2.56)
Any MC OR=1.61 (95% CI 1.10-2.37)
K. Lyall, 2012 (60)
Nurses Health Study II, 66,445 parous nurses in the U.S. enrolled from 1989-2003
Cohort Study; maternal age, race, marital status, income, spouse
education, and parity. For GDM and HBP: history of miscarriage, prior abortion, pregnancy related HBP, other complications, etc.
Obstetric suboptimality score and individual complications with first birth. Maternal report by questionnaire collected every two years, may have occurred with pregnancy other than index. GDM in first birth n=58, pregnancy-related HBP in first birth n=85.
Maternal report in 2005 asking women if they had a child with autism, Asperger syndrome, or “other autism spectrum disorder”, unknown if from first birth where exposure occurred; n=793 (1.2%).
OSS of 4+ OR=2.96 (95% CI 1.74, 5.03)
GDM OR=1.88 (95% CI 1.15-3.07)
Pregnancy-related HBP OR= 0.96 (95% CI 0.58-1.59)
S. G. Gregory, 2013 (144)
All recorded live births in North Carolina from the North Carolina Detailed Birth Record from 1990-98 linked to educational data from 1997-98 and 2007-08 school year.
Controlled for induced or augmented birth,
maternal age, maternal race/ethnicity, birth order, education, marital status, singleton birth, smoking, hypertension, diabetes.
Induction or augmented birth was the main exposure, looked at contributing factors such maternal characteristics and maternal conditions during pregnancy (hypertension n=386; diabetes n=220).
An autism diagnosis from public school educational records (n=5,648).
Hypertension OR=0.95 (95% CI 0.85-1.05)
19
First author, year
Data source, population, and
study period Design, confounders
Exposures (n with ASD), ascertainment
Outcome (n with
outcome), ascertainment Measures of association
A. T. Langridge, 2013 (8)
All live singleton births in WA between 1984-1999 linked with data from population-based disability databases
Adjusted for all maternal conditions, birth year, and sociodemographics.
Maternal conditions and pregnancy outcomes (including diabetes and hypertension), labor and delivery complications, neonatal outcomes. No Ns avail.
ASD (with ID and without ID) identified in state-wide disability database (N=752 and 452, respectively)
Diabetes OR= 1.03 (95% CI 0.62-1.69)
Hypertension OR= 1.34 (95% CI 1.05-1.71)
P. Polo-Kantola, 2014 (164)
Registry-based case-control study from all singleton births in Finland from 1990-2005
Birth type, Apgar scores, neonatal treatment, smoking during pregnancy, parity, and maternal psychiatric history
Maternal factors including high blood pressure (=56), birth factors, neonatal treatment
Childhood autism obtained from hospital discharge registry (n=1036)
High blood pressure OR=1.49 (95% 1.1-1.21)
C. K. Walker, 2015 (163)
CHARGE study, 1,004 children between 24-60 months in California recruited from 2003-2010.
Population-based case-control study; maternal educational level,
pre-pregnancy obesity, and parity.
Preeclampsia (n=32) and placental insufficiency.
Children with a prior diagnosis of ASD were confirmed with the ADI-R and ADOS (n=517). SCQ administered to DD (n=194) and GP (n=350) children to evaluate for ASD.
Preeclampsia OR=2.36 (95% CI 1.18, 4.68))
A.H. Xiang, 2015 (165) Retrospective longitudinal cohort study including 322,323 singleton children born in 1995-2009 at Kaiser Permanente
Birth year, maternal age, parity, education,
household income, race/ethnicity,
history of comorbidity, and sex of the child.
From birth record and medical record (GDM n=310, T2DM n=115).
Clinical diagnosis of ASD in the medical record (n=3,388)
T2DM OR=1.21 (95% CI 0.97-1.52)
GDM OR= 1.04 (95% CI 0.91-1.19)
20
First author, year
Data source, population, and
study period Design, confounders
Exposures (n with ASD), ascertainment
Outcome (n with
outcome), ascertainment Measures of association
N. Connolly, 2016 (166)
Medical records of children seen in behavioral clinic associated with Cincinnati Children’s Hospital, 2009- 2014
Case-control study; maternal age, maternal race, year of birth, and BMI.
Using ICD-9 codes and natural language processing, GDM (n=52) and preexisting diabetes (n=1), chronic hypertension (n=15), hypertension in pregnancy (n=29).
Clinical diagnosis of ASD in the medical record from the behavioral clinic; non-ASD DD, and POP
GDM OR=1.64 (95% CI 1.22, 2.22)
Obesity and GDM= 2.53 (95% CI 1.72, 3.373)
M. Li, 2016 (167)
Medical records, recruited at Boston Medical Center, 1998-2014
Prospective birth cohort; year or birth, sex, maternal age, parity, smoking, and preterm birth.
Using ICD-9 codes, GDM (n=9), preexisting diabetes (n=10)
Using ICD-9 codes, ASD (n=102)
GDM HR=1.86 (95% CI 0.92, 3.76)
21
F. The role of neonatal jaundice on neurodevelopment
Both neonatal jaundice and hyperbilirubinemia have been associated with the
development of ASD in the child. Jaundice, a yellow discoloration of the skin and the sclera of
the eyes, occurs in most newborn infants usually as a result of increased bilirubin levels. During
the neonatal period, fetal hemoglobin breaks down as it is replaced by adult hemoglobin,
resulting in the release of bilirubin produced in the cells. Bilirubin travels through the
bloodstream to be excreted by the liver, but this process may be prolonged due to an immature
liver leading to an increase of bilirubin in the blood (168). Increased bilirubin levels may be seen
more frequently with conditions characterized by increased hemolysis or other conditions
compromising infant liver function. Jaundice may also be seen with breastfeeding due to factors
in the breast milk that promote reabsorption of bilirubin after it is secreted into the intestinal
tract, and can be more common when feeding times are irregular (168). Visual jaundice is seen in
60% of term neonates and usually resolves within the first week of life (169, 170). However, if
bound to albumin, bilirubin can cross the blood brain barrier where it may have toxic effects on
the developing brain and may even cause death (Figure 2.2). Animal studies have shown
bilirubin in regions of the basal ganglia, hippocampus, substantia nigra, and brainstem nuclei
(171). High levels of bilirubin have been shown to cause mental retardation, cerebral palsy, and
kernicterus in children (172). Bilirubin can be measured directly from the blood or
transcutaneously, neonates with high levels according to the Bhutani curve (Figure 2.4) may be
treated with phototherapy or if not successful or in extreme cases, exchange transfusion (173).
Recently, several studies have reported an association between high levels of bilirubin
and the development of ASD in the child (52, 105, 174-176). Other studies did not find a
22
not accounting for confounders (10) and small sample sizes that make it difficult to detect
associations at high levels of bilirubin exposure. These studies also have varying methods of
collecting data and classifying jaundice, some using parental report, differing bilirubin cut-offs,
or administrative codes. Many of these studies also fail to fully address the role of preterm birth
and gestational age. For example, neonatal jaundice is more common in infants born preterm and
infants may also be more susceptible to high levels of bilirubin at earlier gestational ages, which
may affect the association with ASD(14). This study addresses these limitations and helps
elucidate whether the association with perinatal complications and ASD is likely due to prenatal
complications (maternal diabetes or hypertension) or subsequent neonatal complications
23
24
Table 2.2. Summary of studies that have looked at the association between neonatal jaundice or hyperbilirubinemia and ASD
First author, year
Data source, population, and
study period Design, confounders
Exposures (n with ASD), ascertainment
Outcome (n with outcome), ascertainment
Measures of association
L. A. Croen, 2005 (177)
Singleton term infants born between 1995 and 1998 at a northern California Kaiser Permanente Hospital
Nested case-control study; sex, birth facility, maternal age, maternal race/ethnicity, maternal education, gestational age
Maximal neonatal bilirubin levels from medical records: 15-19.9 mg/dL (n=27), 20-24.9 mg/dL (n=6), ≥25 mg/dL (n=1)
Children with an ICD-9 ASD diagnosis recorded in an outpatient database (n=338)
15-19.9 mg/dL
aOR=0.74 (0.48–1.15);
20-24.9 mg/dL
aOR=0.66 (0.27–1.59);
≥25 mg/dL aOR=1.12
(0.11–11.15)
K. A. Jangaard, 2008 (178)
Infants with gestational age ≥35 weeks born in Nova Scotia, Canada from Jan 1 1994-Dec 31 2000 in a Perinatal Database.
Population-based cohort study; adjusted for fetal sex and parity.
Infants identified as having hyperbilirubinemia, with moderate hyperbilirubinemia defined as TSB 230-<325 μmol/L (n=19).
ASD diagnosis from Canadian insurance database (n=187).
Unadjusted RR=1.6(1.0–2.6)
Adjusted RR=1.6(1.0– 2.5)
R. D. Maimburg, 2008 (175)
Children born in Denmark from 1990-1999.
Population-based matched case-control study; adjusted for birth weight, gestational age, mother’s age.
Medical record data from the prenatal and perinatal period, hyperbilirubinemia was defined if maximum bilirubin value in μmol/L exceeded 10% of the infant’s weight in grams on the same day, if not available birth weight was used. A serum bilirubin test was only ordered if jaundice was visible.
473 children <10 years old with a diagnosis of ASD in the Danish Psychiatric Central Register, and 473 controls from birth records.
Serum bilirubin test: UOR=1.4(1.1–2.1); AOR=1.2(0.8–1.7)
Hyperbilirubinemia- (by infant weight): UOR=5.6(2.2–14.5); AOR=3.7(1.3–10.5)
(by birth weight): UOR=6.0(2.1–17.3); AOR=3.8(1.2–12.1)
S. Buchmayer, 2009 (52)
Swedish Birth Register linked to the Hospital Discharge Register from 1987-2002.
Population-based case-control study; adjusted for all infant
characteristics and neonatal complications of interest.
Several maternal, pregnancy-related, and neonatal factors collected from the Birth Register and Discharge Register including neonatal jaundice (n=74).
Children discharged with a main diagnosis of infantile autism according to ICD-9/ICD-10 from any hospital in Sweden before 10 years of age (n=1,216).
25
First author, year
Data source, population, and
study period Design, confounders
Exposures (n with ASD), ascertainment
Outcome (n with outcome), ascertainment
Measures of association
R. D. Maimburg, 2010 (174)
All children born in Denmark from Jan 1 1994-Dec 31 2004.
Population-based, follow-up study; smoking, irregular fetal presentation, Apgar score, parents’ age, mother’s citizenship, birth weight, congenital malformations.
Birth and medical record data, jaundice exposure determined by ICD-10
ICD-10 ASD diagnosis (n=532) and diagnosis of other disorders of psychological development
Neonatal jaundice: Crude HR=1.84(1.26– 2.69); Adjusted HR=1.56(1.05–2.30)
M. P. Mamidala, 2013 (105)
Obtained via simple random sampling of individuals from 8 major Indian cities from Sept 2010-Dec 2012.
Case-control study; maternal age at delivery, sex, and birth year.
Parent questionnaire regarding parental, prenatal, perinatal, and neonatal characteristics, including neonatal jaundice (n=64).
481 ASD cases aged 2-10 obtained from developmental centers and 481 typically developing controls obtained from schools.
Neonatal Jaundice: Crude OR=3.58 (2.02– 6.35)
Adjusted OR=2.89 (1.58–5.28)
G. Duan, 2014 (176)
Cases were treated in a hospital in Zhengzhou city, China from Feb 2011-Feb 2013. Controls were healthy children from local kindergartens.
Case-control study; parental age, paternal introversion, passive smoking, premature rupture of the fetal membrane, premature delivery, birth asphyxia.
Neonatal jaundice (n=49) data collected from clinical data and parent report in cases and from parent report in controls.
Pediatric autism cases (n=286) treated by a hospital in China, and 286 controls from schools.
Neonatal jaundice crude RR=11.57 (1.86–34.72) Severe jaundice adjusted RR=21.81 (12.22–35.54) W. Froehlich-Santino, 2014 (10) California Autism Twin Study (CATS), obtained from the California Department of Developmental Service from 1987-2004.
Population-based twin study; none.
Parent questionnaire regarding specific complications of pregnancy, labor, and the neonatal period, including jaundice (n=59).
ASD diagnosis verified by ADI-R and ADOS. N=388 [194 twin pairs; 137 individuals with ASD] from age 4-18 yo. One child in the twin pair must have ASD.
26
First author, year
Data source, population, and
study period Design, confounders
Exposures (n with ASD), ascertainment
Outcome (n with outcome), ascertainment
Measures of association
Y. W. Wu, 2016 (179)
Infants born ≥ 35 weeks in Northern California, seen at Kaiser Permanente from 1995-2011.
Retrospective cohort study, TSB levels, treatment, maternal and paternal age, maternal and paternal education, maternal race/ethnicity, sex, gestational age, birth weight, apgar, year of birth.
Total serum bilirubin levels in medical record, n=146 with TSB ≥20, n=848 with 15<TSB<20, n=580 with phototherapy.
ASD diagnosis either by ICD-9 code, n=5,979
TSB≥20 OR=1.09 (95% CI 0.89, 1.35)
15<TSB<20 OR=1.07 (95 CI 0.98, 1.17)
27
CHAPTER 3. METHODS
A. Study design
The Centers for Autism and Developmental Disabilities Research on Epidemiology
(CADDRE) Network were established as regional centers of excellence for research on ASD and
developmental disabilities in 2002. The CADDRE Network designed the Study to Explore Early
Development (SEED) to better understand ASD phenotype and etiology. SEED is a multisite
case-control study with population-based, multiple-source ascertainment of children with ASD
and two comparison groups, children with developmental delays or disorders other than ASD
(DD) and children sampled from the general population (POP). Case children (ASD) were those
confirmed to have ASD based on DSM-IV criteria for autistic disorder, pervasive developmental
disorder-not otherwise specified, and Asperger syndrome. Potential participants were recruited
from a catchment area near the study sites in six states (California, Colorado, Georgia, Maryland,
North Carolina, and Pennsylvania)(26).
SEED was designed to be the largest multi-site epidemiological investigation of
etiological and risk factors contributing to ASD. A clinical evaluation was conducted to confirm ASD diagnosis and assess all children’s neurodevelopment. SEED collected detailed data from
maternal and child medical records, maternal interview, and birth certificates for the period covering the first maternal prenatal care visit through the child’s third birthday. Data collection
was uniform across all study groups. A summary of data collection sources and questions used
for this study are described in more detail below. More details on methods specific to each aim
28 B. Study population
SEED required eligible children to have been born in and reside in one of six study
catchment areas between September 1, 2003 and August 31, 2006 and to be between the ages of
30 and 68 months of age at the time of in-person assessment. SEED aimed to obtain a
population-representative sample. The catchment areas were of similar population size in
California, Colorado, Georgia, Maryland, North Carolina, and Pennsylvania. SEED also required
the children to live with a knowledgeable caregiver who was at least 18 years of age and spoke
English (or Spanish if participating in CO or CA)(26). For the purposes of this analysis, we also
require that the caregiver be the biological mother because of the focus on prenatal data.
Children in the ASD and DD groups were ascertained through multiple agencies that
evaluate or serve children with developmental challenges, even if they did not already have a
specific diagnosis of ASD or other developmental disability. Recruitment targeted agencies
focused on early intervention, special education, and related service programs for toddlers and
young children, as well as hospitals, clinics, and individual providers. Parents also might have contacted the study directly and the child enrolled if eligible. This “broad diagnostic net” for
ascertainment ensures that previously diagnosed and undiagnosed ASD children were identified
(26). SEED’s recruitment procedures across multiple agencies and multiple sites ensured sample
diversity that should be more generalizable to the broad US population than single clinic-based
studies.
State birth records were randomly sampled to identify children from the general
population to invite for participation. POP children were required to be born in the specified date
range, whose mothers were residing in the study catchment area at time of delivery, and were
29
were invited to participate in the study via mail and, if interested, received a follow-up call.
During this call, the Social Communication Questionnaire (SCQ) (180) was administered to the child’s primary caregiver to screen the child for ASD. SEED ascertainment and evaluation
procedures are described in more detail below and in Figure 3.1. This analysis is composed of
children enrolled in SEED that have data available from either the caregiver interview or medical
records on the exposure of interest and met criteria for one of the three outcome groups discussed
in more detail below.
C. Outcome assessment
ASD ascertainment
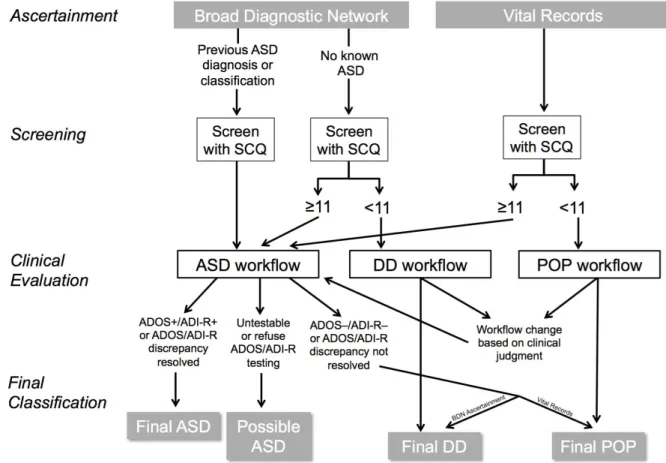
During the initial recruitment call, a positive screen was defined as an SCQ ≥11. This
lower cut-point was used to increase the sensitivity of the screener because of children’s young
age (26). Children who screened positive or had a previous diagnosis of ASD were placed in an
ASD workflow and received a standardized in-clinic assessment by trained research-reliable
clinicians. ASD was confirmed by both the Autism Diagnostic Observation Schedule (ADOS)
(181, 182) and the Autism Diagnostic Interview-Revised (ADI-R) (183) as meeting standard
criteria for both instruments, or relaxed criteria for the ADI-R if criteria for the ADOS is met as
described in Table 3.1. Children in the ASD workflow that were untestable or refused to take the
ADOS/ADI-R during clinical evaluation were placed in a separate “Possible ASD” group;
30
Figure 3.1. SEED recruitment and final classification of participants.
The general development of all children was assessed in the clinic using the Mullen
Scales of Early Learning (184). All parents also completed several instruments to characterize their child’s development including the Child Behavior Checklist (185) and the Social
Responsiveness Scale (186). All children in the ASD workflow, and those in DD or POP
workflow with an Early Learning Composite score of ≤78 on the Mullen Scales, also completed
the Vineland Adaptive Behavior Scales (187). If the clinician suspected that a child in the DD or
POP had possible ASD at the time of evaluation, the child was moved to the ASD workflow and
the ADOS/ADI-R was administered.
All SEED clinicians have advanced degrees in developmental pediatrics, developmental
31
diagnosis of children with ASD (188). Clinicians who administered the ADI-R and ADOS
participated in pre-data collection exercises to establish reliability, at least quarterly exercises to
maintain reliability, and at least yearly exercises to verify administration fidelity (188).
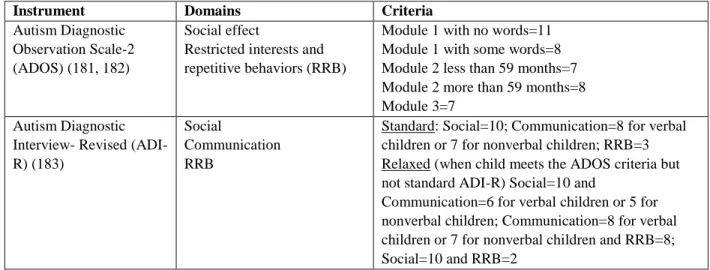
Table 3.1. Instruments administered in SEED and criteria for ASD classification
Instrument Domains Criteria
Autism Diagnostic Observation Scale-2 (ADOS) (181, 182)
Social effect
Restricted interests and repetitive behaviors (RRB)
Module 1 with no words=11 Module 1 with some words=8 Module 2 less than 59 months=7 Module 2 more than 59 months=8 Module 3=7
Autism Diagnostic Interview- Revised (ADI-R) (183)
Social
Communication RRB
Standard: Social=10; Communication=8 for verbal children or 7 for nonverbal children; RRB=3 Relaxed (when child meets the ADOS criteria but not standard ADI-R) Social=10 and
Communication=6 for verbal children or 5 for nonverbal children; Communication=8 for verbal children or 7 for nonverbal children and RRB=8; Social=10 and RRB=2
DD and POP comparison group ascertainment
Two different comparison groups were included in SEED: 1) children with
developmental delays or disorders other than ASD (DD), and 2) children sampled from the
general population (POP). Comparisons between the ASD and POP group identify risk factors in
children with ASD relative to children from the general population. Comparisons between the
ASD and DD group can identify unique risk factors to ASD independent of risks common to
other developmental disorders.
Children with an SCQ <11 were grouped according to their recruitment source, with
those entering through the Broad Diagnostic Network placed in the DD workflow and those
sampled from vital records placed in the POP workflow. If the clinician suspected that a child in
the DD or POP workflow had possible ASD at the time of in-person evaluation, the child was
32
classified as Final DD or Final POP. Children in the ASD workflow that were ADOS and ADI-R
negative or had a discrepancy in their ADOS/ADI-R that could not be resolved were classified as
Final DD if recruited from the Broad Diagnostic Network, or as Final POP if recruited from vital
records.
The DD group includes children that may have a previous ASD diagnosis or with
observed or reported ASD characteristics. Sub-classifications were created in the DD group to
designate children that fall into these categories. For the purposes of this analysis, these children
are excluded in order to have a DD comparison group that is distinct from ASD and more
representative of other developmental disorders. While children with these characteristics may
also be found in the POP group, all POP children are included to maintain its representativeness
of a true population control group.
D. Exposure assessment
Exposure assessment included data from available sources: medical record (including
hospital stays and clinic visits) and maternal report (from interview and health history forms).
This is described in more detail in more detail below.
Medical records
At enrollment, all participants were mailed medical records release forms. Once the
signed release forms were obtained, hospital and clinic medical records were obtained from the
prenatal, labor/delivery, neonatal, and pediatric periods, from which data was abstracted into four
corresponding data collection forms by trained data abstractors. Quality control steps were
implemented including training exercises for data abstraction, and testing initial and ongoing
quality control standards for all data collected from medical records. Data from the medical
33
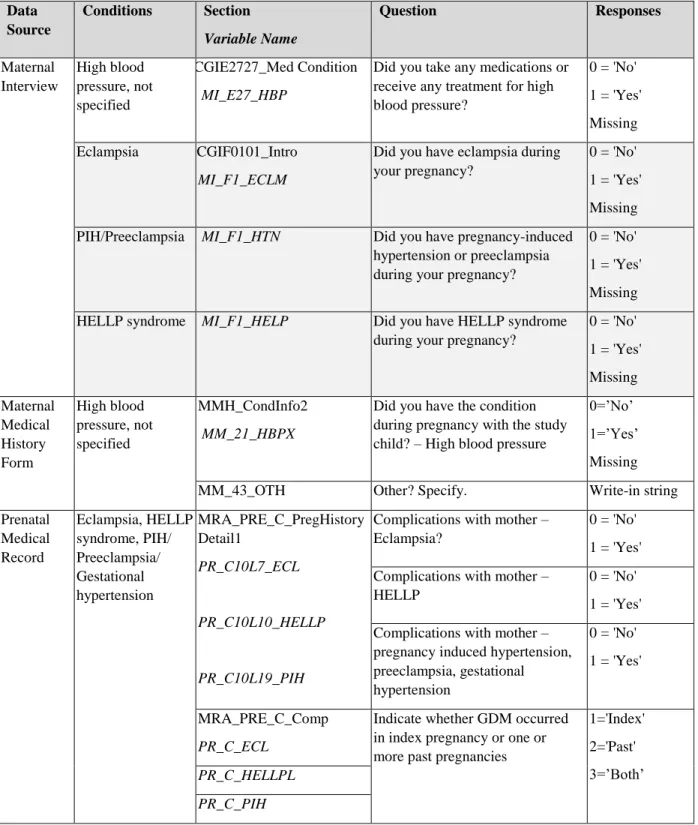
Delivery, Neonatal/Birth Hospital, and Pediatric. Questions used for this analysis from these
forms are described below in Tables 3.2, 3.4, and 3.5 below.
Caregiver interview (CGI)
Following enrollment, the caregiver was interviewed via telephone by a trained
interviewer with computer assistance. If the mother was the caregiver being interviewed,
questions were asked regarding sociodemographic information, maternal health history and
medical conditions, and regarding the pregnancy with the index child including complications,
and conditions or complications during pregnancy, delivery and the early postnatal period.
Questions from the CGI that are used for this analysis are included below in Tables 3.2, 3.4, and
3.5 below.
Autoimmune disease survey
Following the caregiver interview, a questionnaire packet was mailed to the caregiver.
Two of the forms included were a family autoimmune disease history survey, in which the
mother would indicate whether she has ever had an autoimmune condition and her age of onset.
Gestational diabetes and diabetes (either requiring insulin or with no insulin use) were included
in this form. Data used for this analysis from this questionnaire are described in Tables 3.2, 3.4,
and 3.5 below.
Diabetes in pregnancy
Mothers with diabetes in pregnancy include those with a diagnosis of gestational diabetes
(GDM), Type I diabetes (T1DM), Type II diabetes (T2DM), or diabetes-not otherwise specified
(diabetes- NOS). Any report of diabetes in the caregiver interview, the autoimmune disease
survey, or the prenatal medical record, is used to classify diabetes. In those with a date of
34
classified as T2DM. A new diagnosis of diabetes-NOS at or beyond 20 weeks of gestation (in
those with a date of diagnosis available) is classified as GDM. In addition, results from an oral
glucose tolerance test (OGTT) are used when available to identify women with GDM (see
below). Because it is often difficult to distinguish undiagnosed T2DM and GDM, we have a
broad exposure category of ‘Any diabetes’ that includes GDM, T2DM, T1DM, and
diabetes-NOS. Mothers previously diagnosed with diabetes with an active diagnosis in their prenatal
medical record are also included.
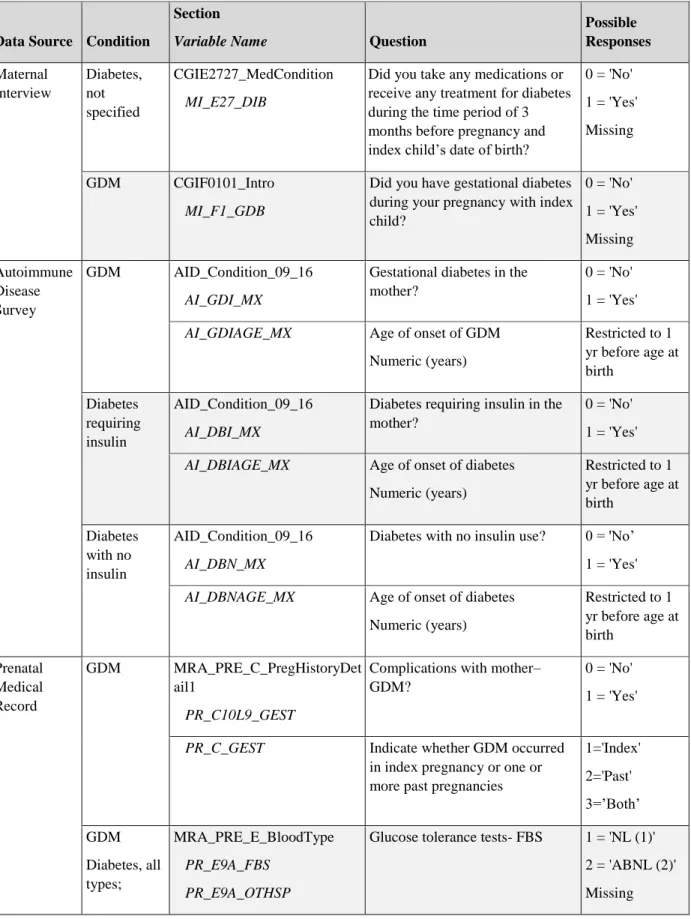
Table 3.2 describes the sources of data and specific information collected regarding
maternal diabetes. From these sources we determined if the mother had diabetes during or before
her pregnancy, the type of diabetes diagnosed, results from glucose tolerance tests during the
35
Table 3.2. Sources of data in SEED pertaining to diabetes in pregnancy
Data Source Condition
Section
Variable Name Question
Possible Responses Maternal Interview Diabetes, not specified CGIE2727_MedCondition MI_E27_DIB
Did you take any medications or receive any treatment for diabetes during the time period of 3 months before pregnancy and index child’s date of birth?
0 = 'No'
1 = 'Yes'
Missing
GDM CGIF0101_Intro
MI_F1_GDB
Did you have gestational diabetes during your pregnancy with index child?
0 = 'No'
1 = 'Yes'
Missing
Autoimmune Disease Survey
GDM AID_Condition_09_16
AI_GDI_MX
Gestational diabetes in the mother?
0 = 'No'
1 = 'Yes'
AI_GDIAGE_MX Age of onset of GDM
Numeric (years)
Restricted to 1 yr before age at birth Diabetes requiring insulin AID_Condition_09_16 AI_DBI_MX
Diabetes requiring insulin in the mother?
0 = 'No'
1 = 'Yes'
AI_DBIAGE_MX Age of onset of diabetes
Numeric (years)
Restricted to 1 yr before age at birth Diabetes with no insulin AID_Condition_09_16 AI_DBN_MX
Diabetes with no insulin use? 0 = 'No’
1 = 'Yes'
AI_DBNAGE_MX Age of onset of diabetes
Numeric (years)
Restricted to 1 yr before age at birth
Prenatal Medical Record
GDM MRA_PRE_C_PregHistoryDet ail1
PR_C10L9_GEST
Complications with mother– GDM?
0 = 'No'
1 = 'Yes'
PR_C_GEST Indicate whether GDM occurred
in index pregnancy or one or more past pregnancies
1='Index' 2='Past' 3=’Both’ GDM Diabetes, all types; MRA_PRE_E_BloodType PR_E9A_FBS PR_E9A_OTHSP
Glucose tolerance tests- FBS 1 = 'NL (1)'
2 = 'ABNL (2)'