Polarization degenerate solid-state cavity quantum electrodynamics
Morten P. Bakker,1Ajit V. Barve,2Thomas Ruytenberg,1Wolfgang L¨offler,1Larry A. Coldren,2 Dirk Bouwmeester,1,3and Martin P. van Exter1
1Huygens-Kamerlingh Onnes Laboratory, Leiden University, P.O. Box 9504, 2300 RA Leiden, Netherlands 2Departments of Electrical and Computer Engineering, University of California, Santa Barbara, California 93106, USA
3Department of Physics, University of California, Santa Barbara, California 93106, USA
(Received 1 October 2014; revised manuscript received 20 February 2015; published 31 March 2015) A polarization degenerate microcavity containing charge-controlled quantum dots (QDs) enables equal coupling of all polarization degrees of freedom of light to the cavity QED system, which we explore through resonant laser spectroscopy. We first measure interference of the two fine-split neutral QD transitions and find very good agreement of this V-type three-level system with a coherent polarization-dependent cavity QED model. We also study a charged QD that suffers from decoherence and find also in this case that availability of the full-polarization degrees of freedom is crucial to reveal the dynamics of the QD transitions. Our results pave the way for postselection-free quantum devices based on electron-spin–photon polarization entanglement.
DOI:10.1103/PhysRevB.91.115319 PACS number(s): 42.50.Pq,42.25.Ja,42.50.Nn,85.35.Be
I. INTRODUCTION
Quantum dots (QDs) embedded inside microcavities are of interest for hybrid optical-solid-state quantum information schemes [1,2] and long-distance quantum networks [3,4]. A key ingredient is the realization of entanglement between a QD spin and a single photon. Several experiments have demonstrated this by utilizing spontaneous emission [5–7], but these methods require postselection and are therefore not suitable for deterministic approaches. The need for postselection can be eliminated by using the spin-dependent reflection or transmission of a photon by a quantum dot in a cavity QED system. Several protocols have been proposed that either require polarization degenerate microcavities in order to couple with circular polarized light [8,9] or would be aided in order to match more easily with linear polarized transitions [10]. Further key system requirements are charge-controlled QDs and access to the Purcell or strong-coupling regime, which has been realized in photonic crystal cavi-ties [11] and micropillars [12]. Micropillars have the additional benefit of mode matching to external fields and polarization control of the cavity modes [13–18].
In this paper we report on a system exhibiting all these features, a charge-controlled quantum dot coupled to a polar-ization degenerate micropillar cavity. The microcavity consist of two distributed Bragg reflectors, a 3/4λ-thick aperture region for transverse mode confinement and aλ-thick cavity layer, containing InAs self-assembled QDs embedded inside a PIN-diode structure [13,19]. By systematically varying the size and shape of the oxide aperture, we were able to select, on average, one polarization degenerate cavity (polarization splitting<3 GHz) out of a (6×7) array [20]. This technique could be combined with a technique to actively tune the polarization properties by applying laser-induced surface defects [21] to enhance the sample yield. We tune the QD transition through the cavity resonance by the quantum confined Stark effect, induced by an applied bias voltage across the active region [22,23]. In principle this can be combined with other QD tuning techniques, such as strain tuning [24–26], which would further increase the sample yield. Further details
Tunable laser
polarizer (λ/2, λ/4) (polarizer) (λ/4) Transmission
(polarizer) Reflection Cryostat, 9.0 K
(a) (b)
(c)
P-contact
N-contact f=25.4 mm
f=10.0 mm
10 µm
FIG. 1. (Color online) (a) Schematic of the setup. Light is cou-pled into a microcavity mode, and the reflection and transmission spectra are recorded using single-photon avalanche photodiodes. The elements with names between brackets can be introduced for polarization analysis with either linear or circularly polarized light. λ/2 (λ/4): half-wave (quarter-wave) plate. (b) Optical microscope image of a sample. (c) Electron micrograph of the cavity region.
on the sample structure and characterization can be found in the AppendixA. The setup and optical and electron microscope images of the sample are shown in Fig.1.
II. NEUTRAL QUANTUM DOT
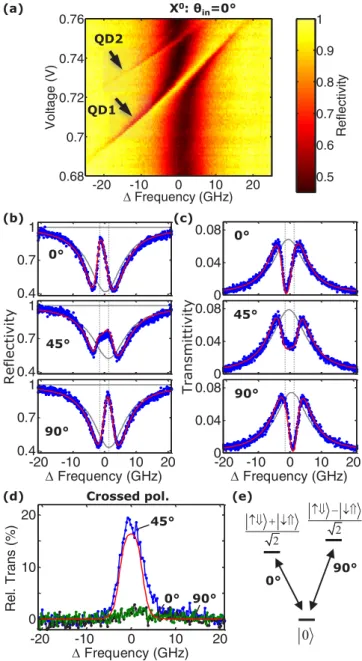
The lowest-energy levels of a neutral QD are depicted in Fig.2(e). Due to the QD anisotropy, the electron-hole exchange interaction leads to a fine-structure splitting of the excited states (∼3 GHz for the QD under study), and the neutral ground state is coupled to two excited states by two linear orthogonally polarized transitions. In the resonant reflection measurements in Fig. 2(a), the QD-cavity anticrossing, as a hallmark of strong to intermediate QD-cavity coupling, is clearly visible. Low laser power (Plaser=1 pW) is used
in order to avoid saturation of the QD transition, charg-ing [27], and dynamical nuclear spin polarization effects [28]. Figures 2(b) and 2(c) show reflection and transmission spectra for a voltage V =0.725 V, where QD1 is tuned into resonance with the cavity. The spectra are recorded for three linear polarizations that couple with the low-frequency QD transition (θin=0◦), the high-frequency QD transition (θin=90◦), or both QD transitions (θin=45◦).
For 0◦and 90◦polarization we observe that the quantum dot is able to restore high cavity reflectivity with near-unity fidelity, but this effect appears to be reduced for 45◦. Additionally, we show spectra when a crossed polarizer is used in the transmission path in Fig.2(d). We see that for 0◦and 90◦the light matches the natural polarization axes of the QD and that this polarization is maintained, resulting in a very low signal. For 45◦incoming polarization the transmission is significant, however. In the following, we develop a theoretical model to gain insight into the dynamics.
The transmission amplitude through a cavity with a coupled two-level system is given by [17,29,30]
t=ηout 1
1−i+1−2Ci, (1)
where=2(ω−ωc)/κ is the relative detuning between the
laser (ω) and cavity (ωc) angular frequencies, =(ω−
ωQD)/γ⊥ is the relative detuning between the laser and QD transition (ωQD), and ηout is the output coupling efficiency.
The device cooperativity isC =g2/κγ⊥, whereκ is the total intensity damping of the cavity,γ⊥is the QD dephasing rate, andgis the QD-mode coupling strength. We obtain close to perfect mode matching, and therefore the total transmittivity through the cavity is given byT = |t|2, and the total reflectivity
is given byR= |1−t|2. A more detailed description of Eq. (1) is provided in AppendixB.
An important figure of merit of the QD-cavity system is the cooperativity parameter C. By fitting our model to the experimental data in Fig.2forθin=0◦andθin=90◦, we find
C=2.5±0.5, a value similar to that previously reported [17]. We also obtainγ⊥=2.0±0.5 ns−1, which corresponds to a total dephasing timeτ =500 ps and total cavity damping rate
κ =77 ns−1, which corresponds to a quality factor of Q∼
2.6×10⁴ (see Appendix B). Since γ
⊥<2g=39 ns−1< κ, this places the system in the intermediate-coupling regime.
The line shapes corresponding to an empty cavity can be calculated from the fitted curves and are shown by the gray curves in Figs.2(b)and2(c). The very small dependence of the
Frequency (GHz)
R
e
l.
Tr
a
n
s
(
%
)
-20 -10 0 10 20
0 10 20
Frequency (GHz)
Voltage (V)
-20 -10 0 10 20
0.68 0.7 0.72 0.74 0.76
R
e
fl
e
c
ti
vity
0.5 0.6 0.7 0.8 0.9 1
0 2 2
0° 90°
0°
0°
45°
45°
90°
90° X0: θ
in=0°
0° 90° 45°
Reflectivity
Transmittivity
QD2
QD1
0.4 0.7 1
0 0.04 0.08
Frequency (GHz)
-20 -10 0 10 20
0.4 0.7 1
0 0.04 0.08
Frequency (GHz)
-20 -10 0 10 20
0 0.04 0.08 0.4
0.7 1 (a)
(b) (c)
(d) Crossed pol. (e)
FIG. 2. (Color online) (a) Reflectivity measurement of two neu-tral QDs as a function of the scanning laser frequency and applied volt-age. The incoming polarizationθin=0◦,Plaser=1 pW, andλ≈940 nm. (b) Reflectivity and (c) transmittivity spectra of QD1 recorded at V =0.725 V for various incoming linear polarizations. Blue points: experimental data. Red line: fitted curve using Eqs. (1) and (2). Gray curve: empty cavity, calculated from the fits. Vertical dashed lines: frequencies corresponding to the two fine-split transitions. (d) Transmittivity spectra when a crossed polarizer is used with respect to the incoming polarization, relative to the maximum transmittivity of an uncoupled cavity. The red line is calculated using Eqs. (1) and (2) and the parameters obtained from the fits in (b) and (c). (e) Energy-level diagram of the ground-state and lowest-energy excited states of a neutral QD.
cavity resonance frequency on the polarization angle confirms the high degree of polarization isotropy of this device.
0 3
0 2
T
ra
n
smi
tt
ivi
ty
(%
)
-15 0 15
0 3
Frequency (GHz) 0
10 20
0 5
R
e
fl
e
c
ti
vi
ty
(%
)
-15 0 15
0 10 20
Frequency (GHz) Δθout=
-22.5°
(a) (b)
Δθout=0° Δθout= +22.5°
Δθout= +22.5°
Δθout=0°
Δθout= -22.5°
QD1
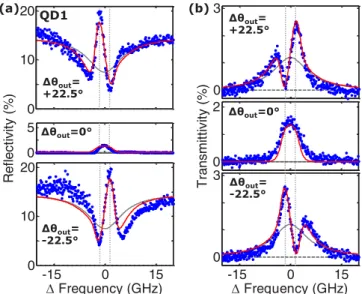
FIG. 3. (Color online) Resonant (a) reflection and (b) transmis-sion spectroscopy with a neutral QD (QD1 in Fig.2) forθin=45◦and for various θout=θin+90◦+θout. Blue dots: experimental data. Red lines: predicted curves using Eqs. (1) and (2) and the parameters obtained from the fits in Figs.2(b)and2(c). Gray lines: predicted curves corresponding to an empty cavity. Vertical dashed lines mark the two transitions split by the fine-structure interaction.
transmission of the system in terms of a Jones matrix,
t(ω)=
tx(ω) 0
0 ty(ω)
.
The measured transmittivity therefore depends on the input and output polarization as
tθout,θin(ω)=e
†
outt(ω)ein, (2)
where ei =(cos(θi),sin(θi)) defines the linear input/output
(i=in/out) polarization with angle θi. This model assumes
that when the two transitions are excited simultaneously (θin=45◦), coherence in the system is fully maintained, leading to quantum interference between the transmission amplitudes tx and ty. In an incoherent system we would
obtain a classical mixture of the excited states, making such interference impossible. The reflectivity is calculated in a similar way by usingrx/y =1−tx/y(ω) in the Jones matrix.
To further explore the validity of Eq. (2) and to demonstrate the full power of polarization degenerate cavity QED, we show in Figs.3(a)and3(b)reflection and transmission spectra for θin=45◦, while θout=θin+90◦+θout is varied. For θout=0◦, the crossed-polarizer condition, the transmission
and reflection spectra consist of two partially overlapping Lorentzian lines split by ∼3 GHz. The phase difference between these two resonances becomes apparent for the
θout= +22.5◦ (−22.5◦) spectra, which can be seen as the coherent sumof theθout=0◦and theθout= +45◦(−45◦)
spectra, where the latter contains only the high-frequency (low-frequency) transition. All the red curves in Figs.2and3 are produced with the same parameters forC,κ, andγ⊥and fit the experimental data very well. The results demonstrate how in a polarization degenerate cavity the fine-split excited states of a neutral QD can be simultaneously addressed in a coherent
way. Furthermore, these interference measurements hold great promise as a clever combination ofein andeout can be used
to tune the constructive or destructive interference betweentx
andty. This forms a generic technique to increase the ratio
between uncoupled and coupled cavity systems and thereby the fidelity of entanglement operations.
III. SINGLY CHARGED QUANTUM DOT
Now we turn to a different QD in the same polarization degenerate cavity but operated in a voltage regime around 0.9 V, where it is singly negatively charged. This system is of particular importance in quantum information as the optical transitions are polarization degenerate [see Fig.4(a)] due to cancellation of electron-hole exchange interaction and enables coherent control of the resident electron spin if a small in-plane magnetic field is applied. We first focus on Figs.4(b) and4(c), which show transmission spectra when circularly (σ+) or linearly polarized light is coupled into the cavity and transmitted light of the same (i.e., parallel) polarization is recorded. We define the contrast as (|tc|2−T)/|tc|2, with
the measured transmittivityT with a QD and the calculated transmittivity|tc|2 without a QD. While for the neutral QD
case we found contrasts of>91% in Fig.2(c), we now observe a strongly reduced contrast of the QD resonance, which is ∼19% when circularly polarized light is used and∼26% for linear polarization.
We use a slightly larger laser power (Plaser=10 pW) compared to the neutral QD as we find that the charging effects are now significantly smaller due to less absorption of the resonant laser at this voltage. Furthermore, this intensity corresponds to a mean intracavity photon number n¯ = |t|2P
laser/(κmω)<0.001 and is therefore sufficiently small
to prevent QD saturation effects from occurring.
In addition, we compared the cross-polarized transmitted intensity for circular and linear polarized light. For circular (σ+ and σ−) polarization, shown in Fig. 4(d), we observe negligible transmission, indicating that circular polarization remains unchanged. Surprisingly, for two linear orthogonal (lin1 and lin2) polarizations displayed in Fig.4(e), we observe that about 10% of the light is transmitted relative to |tc|2,
despite the low cooperativity (see below).
We will first try to explain our observations with a coherent model, which we adapt to the four-level system of a charged QD shown in Fig.4(a): The ground state consists of the two spin eigenstates, oriented in the out-of-plane direction, which couple with two corresponding trion lowest-energy excited states by degenerate circularly polarized optical transitions carrying spinσ±= ±1. We writet1±≡t1for the correspond-ing transmission amplitudes of σ± polarized light coupling with a corresponding transition andtc±≡tcfor the case of an
empty cavity. Since we do not control the electron-spin state it can be in any random state |φspin =α|↑ +β|↓. With
the incoming photon state |φin =γ|+ +δ|−, we obtain for the input quantum state|in = |φin ⊗ |φspin. The spin-selective interaction with the cavity-QD system entangles the photon with the electron spin via
|out =t1γ α| + ↑ +tcγ β| + ↓ +tcδα| − ↑ +t1δβ| − ↓.
-15 0 15 Freq. (GHz)
Crossed polarizer: linear
Freq. (GHz)
Rel.
T
rans
. (
%
)
-10 0 10
0 5 10 (a)
(b) (c)
(d) (e)
-10 0 10
0 3 6
Freq. (GHz)
T
ra
n
smi
tt
ivi
ty
(%
)
-10 0 10
Freq. (GHz)
σ+
σ-Parallel polarizer:
σ+ M1,M2
M1
M2 |t1|2
|tc|2
|t1|2
M2
M1 lin1
lin2 |tc|2
σ+
σ-Parallel polarizer: linear
Crossed polarizer: circular
FIG. 4. (Color online) (a) Energy-level diagram of a singly charged QD. Transmission spectra forPlaser=10 pW are shown for circular and linear polarization, analyzed with a (b) and (c) parallel or (d) and (e) crossed polarizer. The red-black dashed line in (b) is a fit of Eq. (4) (coherent model, M1) to the data, which yields the same result as Eq. (5) (decoherent model, M2). The red (black) solid lines in (c) and (e) predict the experimental data using Eq. (4) [Eq. (5)]. Black (red) dashed curves: empty (coupled) cavity calculations.
We then project this output state onto the detected polariza-tion|φout =γ|+ +δ|−and take the trace over the electron spin to obtain the projected transmission:
T = |t1γ γ+tcδδ|2|α|2+ |tcγ γ+t1δδ|2|β|2. (4)
Since we do not control the spin state, we use|α|2= |β|2=
0.5 for the balanced case. Note that this model (M1) is coherent in the sense that it still contains interference between thet1and tcterms.
The red solid line in Fig.4(c)shows how model M1 fits our data for the optimum cavity-QD coupling and QD dephasing parameters C =0.13 and γ⊥=9.5 ns−1. The dephasing rate cannot be explained by the decay rate of the excited state since lifetime measurements showed this to be about 1.2 ns. Instead, we attribute this much faster dephasing rate to an efficient cotunneling process across the 20-nm electron tunnel barrier, which is expected to be more pronounced for the flatter conduction band here compared to the neutral QD case presented before. This fast dephasing also reduces the cooperativity, which, however, might also be reduced due to low spatial overlap between the QD and the cavity mode. We expect that utilizing a thicker 35-nm tunnel barrier will
decrease the cotunneling process and enable high-fidelity spin-state preparation [31].
Next, we consider the linear-polarization data shown in Figs.4(c)and4(e), where the model prediction is shown by red lines. Equation (4) predicts that purely circular polarized light should pass the cavity unmodified and can therefore be fully blocked by a crossed polarizer (γ γ=δδ=0), which is, in-deed, what we observe experimentally in Fig.4(d). Significant discrepancies between the data and our model are, however, observed in Fig. 4(c) and in Fig. 4(e) in particular, where the cross-polarized transmission signal for linear polarizations lin1 and lin2 is much larger than expected. This cannot be caused by an energy splitting or phase difference between the two transitions because these splittings would have been visible in the data. Furthermore, the observed cross-polarized transmission is so large that it would requireC >0.8 in Eq. (4) to explain the cross-polarized transmission in Fig.4(e), while we foundC =0.13 for the fit in Fig.4(b).
This result therefore indicates that additional dephasing processes take place that project linear polarized light on the preferred circular basis of the QD transitions. The preference for this basis is known from Refs. [31–33] and is experi-mentally demonstrated by the fact that circularly polarized light remains circularly polarized after the interaction with the QD–cavity system. If the absorption and reemission of linear light were a fully coherent process, the linear polarization would largely remain, which is clearly not the case in Fig.4(e).
To model the results, we now introduce a tentative model (M2) that describes the spin-exciton system as if it were fully decoherent, meaning that any light interacting with the QD is instantaneously projected on the QD transition polarization basis. This corresponds to immediate decoherence of the entangled state described by Eq. (3) and elimination of interference between thet1andtcterms in Eq. (4). Since only
a fraction of the light that enters the cavity becomes entangled with the QD spin state, we first need to calculate the fraction of the light that did not interact. We estimate this fractionT0
by multiplying the cavity transmission with the QD response function:T0= |tc|2|1+12C
1−i
|2. The intensities of the circularly
polarized components of the transmitted light that interacted with parallel and opposite electron spins are now given by
T1= |t1|2−T0andTc= |tc|2−T0, respectively.
The total transmitted intensity corresponds now to the incoherent sum of five transmission channels:
T =T0|φout|φin|2+T1|γ αφout|+|2+Tc|δαφout|−|2 +Tc|γ βφout|+|2+T1|δβφout|−|2. (5) The transmissions predicted by the incoherent model [M2, Eq. (5)] and coherent model [M1, Eq. (4)] are equivalent in the case of circular incoming polarization [Figs. 4(b) and 4(d)]. They differentiate, however, in the case of the linear-polarization data in Figs.4(c)and4(e). The solid black curves predicted by the incoherent model (M2), based on the parameters deduced from Fig.4(b), agree very well, while the coherent model (M1) does not.
exact origin of decoherence is not known to us. We think it is related to the cotunneling process, and future sample designs with thicker tunnel barriers will resolve this issue.
IV. CONCLUSION
In conclusion, we have demonstrated a polarization degen-erate solid-state cavity QED system with charge control, which allows full use of all polarization degrees of freedom. Here, simple polarimetric reflection and transmission measurements enable the study of the coherence properties of the coupled QD-cavity system for neutral and charged quantum dots. This is an important advance for fundamental studies of spin dynamics and optical interactions in solid-state cavity QED systems and an important step towards quantum information applications with single-electron and hole spin qubits and postselection-free spin-photon polarization interaction.
ACKNOWLEDGMENTS
We would like to thank Alan Zhan for help with the sample characterization measurements. This work was supported by NSF under Grants No. 0960331 and No. 0901886 and FOM-NWO Grant No. 08QIP6-2.
APPENDIX A: SAMPLE STRUCTURE AND CHARACTERIZATION
The sample under study has been grown by molecular beam epitaxy on a GaAs[100] substrate. Two distributed Bragg reflectors (DBR) surround an aperture region and a λ-thick cavity region containing in the center InAs self-assembled quantum dots (QDs). The top DBR mirror consists of 26 pairs ofλ/4 layers of GaAs and Al0.90Ga0.10As, while the bottom
mirror consists of 13 pairs of layers of GaAs and AlAs and 16 pairs of GaAs and Al0.90Ga0.10As layers. In this way the
reflectivities of the top and bottom mirrors are matched to enable transmission and reflection measurements and optimize the incoupling efficiency. The oxidation aperture consists of a 10-nm AlAs layer embedded between 95-nm Al0.83Ga0.17As
and 66-nm Al0.75Ga0.25As layers, providing a linearly tapered
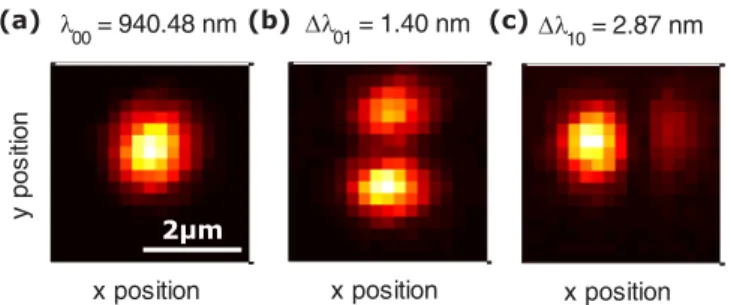
oxidation upon wet oxidation. The QDs are separated by a 20-nm GaAs tunnel barrier to n-doped GaAs (Si dopant, concentration 2.0×1018cm−3) and by a 107-nm GaAs layer top-doped GaAs (C doping, concentration 1.0×1018cm−3). By analyzing the confined optical modes and the wave-length splitting between the fundamental and first-order optical modes, an estimation can be made for the maximum Purcell factor and the numerical aperture (NA) of the fundamen-tal mode. A high Purcell factor is necessary to observe QD couplings close to the strong-coupling regime, while a modest NA enables perfect mode matching to external fields.
To characterize the optical properties of the confined modes, the sample is excited using an 852-nm laser diode and photoluminescence is recorded using a spectrometer as a function of position. Hermite-Gaussian modes are clearly identified in Fig.5. Following methods described in [34], we
01 = 1.40 nm
x position
10 = 2.87 nm
x position
00 = 940.48 nm
x position
y
p
o
s
itio
n
(a) (b) (c)
2µm
FIG. 5. (Color online) Spatial PL scans of the Hermite-Gaussian modes, where (a) is the fundamental mode00and (b) and (c) are the first-order10/01 modes. Light: more PL counts. The labels denote the wavelengthλ00of the fundamental mode or the wavelength splittingλ10/01=λ00−λ10/01.
calculate the mode volumeV using
V =Lcav
λ300
8π n2 0
√
λ01λ10, (A1)
whereLeff ≈5λ00/n≈1.4μm is the effective cavity length, λ00=940.48 nm is the wavelength of the fundamental mode in
vacuum,n≈3.25 is the average refractive index, andλ01/10
are the mode splittings between the 01/10 modes and the 00 mode. Filling in the experimentally obtained values for
the mode splitting, we obtain V =2.2 μm3. The expected maximum Purcell factorP is given by
P = 3
4π2
λ00 n0
3Q
V, (A2)
where Q=2.6×10⁴ is the quality factor measured during
the resonant spectroscopy scans. Using the above-mentioned values, we find P =22. The intensity of the fundamental mode, perpendicular to the propagation direction ˆz, has the
form I ∝exp[−2(x2 w2
x +
y2 w2
y)], where
wx/y= n10π
λ3 00 2λ10/01 is
the mode waist. The numerical aperture of the Gaussian beam originating from the fundamental mode is given by NAx/y =
sin( λ00
π Wx/y), which gives NAx =0.18 and NAy =0.25. The NA of the objective used is 0.4, enabling perfect mode matching.
APPENDIX B: COMPLETE DESCRIPTION OF THE TRANSMISSION AMPLITUDE
The transmission amplitude through a cavity with a coupled QD is given by [17,29,30]
t =ηout
1 1−i+1−2Ci
, (B1)
where the parameters are defined in the main text. We will here quantify the role of losses and its effect on the outcoupling efficiencyηout=2κκm, defined as the probability
that a photon in the mode will leave the cavity through the top or bottom mirror. Here,κm is the damping rate of each
Bragg mirror,κs is the scattering and absorption rate inside
the cavity, and κ =2κm+κs is the total cavity intensity
damping rate. Furthermore κm=Tmirror/tround, where Tmirror
is the transmittivity of a single mirror andtround=2nLcav/c
Lcav ≈5λ/nis the effective cavity length,cis the speed of light, andλ≈940 nm is the wavelength in vacuum.
The mirror damping rateκm≈11 ns−1is calculated from
the sample design parameters. Three observations consistently yield κs ≈55 ns−1: (i) the measured quality factor Q≈
2.6×10⁴ is lower thanQ=9.1×10⁴as determined by the
mirror transmittivity Tmirror=3.4×10⁻⁴ and cavity length
and corresponds toκ =77 ns−1, (ii) the minimum reflectivity of the empty cavity Rmin
Rmax = |1−ηout|
2≈0.5, and (iii) the
maximum transmissionTmax= |ηout|2≈0.08 (not taking into
account a ∼30% reflectivity at the GaAs to air interface at the back of the sample). We attribute this scattering rateκsto
(spectrally broad) absorption losses in the doped layers and scattering by the oxide aperture. Reducingκs, for example,
by using a lower doping concentration, is a major concern in future sample designs.
Finally, we will comment on the case of nonperfect mode matching. The total transmission T through the cavity is then given by T =ηinηT|t|2, where ηin is the incoupling
efficiency and ηT is the collection efficiency at the
trans-mission port. The total reflection is given by R=ηR|1−
ηint|2, whereηR is the collection efficiency at the reflection
port. In the case of perfect mode matching ηin=ηR =
ηT =1.
[1] E. Waks and C. Monroe,Phys. Rev. A80,062330(2009). [2] J. I. Cirac, A. K. Ekert, S. F. Huelga, and C. Macchiavello,Phys.
Rev. A59,4249(1999).
[3] W. Yao, R.-B. Liu, and L. J. Sham,Phys. Rev. Lett.95,030504 (2005).
[4] H. J. Kimble,Nature (London)453,1023(2008).
[5] K. De Greve, L. Yu, P. L. McMahon, J. S. Pelc, C. M. Natarajan, N. Y. Kim, E. Abe, S. Maier, C. Schneider, M. Kamp, S. Hofling, R. H. Hadfield, A. Forchel, M. M. Fejer, and Y. Yamamoto, Nature (London)491,421(2012).
[6] W. B. Gao, P. Fallahi, E. Togan, J. Miguel-Sanchez, and A. Imamoglu,Nature (London)491,426(2012).
[7] J. R. Schaibley, A. P. Burgers, G. A. McCracken, L.-M. Duan, P. R. Berman, D. G. Steel, A. S. Bracker, D. Gammon, and L. J. Sham,Phys. Rev. Lett.110,167401(2013).
[8] C. Y. Hu, W. J. Munro, J. L. O’Brien, and J. G. Rarity,Phys. Rev. B80,205326(2009).
[9] C. Bonato, F. Haupt, S. S. R. Oemrawsingh, J. Gudat, D. Ding, M. P. van Exter, and D. Bouwmeester,Phys. Rev. Lett.104, 160503(2010).
[10] S. Sun and E. Waks,Phys. Rev. A90,042322(2014).
[11] S. G. Carter, T. M. Sweeney, M. Kim, C. S. Kim, D. Solenov, S. E. Economou, T. L. Reinecke, L. Yang, A. S. Bracker, and D. Gammon,Nat. Photonics7,329(2013).
[12] M. T. Rakher, N. G. Stoltz, L. A. Coldren, P. M. Petroff, and D. Bouwmeester,Phys. Rev. Lett.102,097403(2009). [13] N. G. Stoltz, M. Rakher, S. Strauf, A. Badolato, D. D. Lofgreen,
P. M. Petroff, L. A. Coldren, and D. Bouwmeester,Appl. Phys. Lett.87,031105(2005).
[14] S. Strauf, N. G. Stoltz, M. T. Rakher, L. A. Coldren, P. M. Petroff, and D. Bouwmeester,Nat. Photonics1,704(2007). [15] A. Dousse, J. Suffczynski, A. Beveratos, O. Krebs, A. Lemaitre,
I. Sagnes, J. Bloch, P. Voisin, and P. Senellart,Nature (London) 466,217(2010).
[16] S. Reitzenstein and A. Forchel,J. Phys. D43,033001(2010). [17] V. Loo, C. Arnold, O. Gazzano, A. Lemaˆıtre, I. Sagnes, O.
Krebs, P. Voisin, P. Senellart, and L. Lanco,Phys. Rev. Lett. 109,166806(2012).
[18] A. K. Nowak, S. L. Portalupi, V. Giesz, O. Gazzano, C. Dal Savio, P.-F. Braun, K. Karrai, C. Arnold, L. Lanco, I. Sagnes, A. Lemaˆıtre, and P. Senellart,Nat. Commun.5,3240(2014).
[19] P. M. Petroff, A. Lorke, and A. Imamoglu,Phys. Today54(5), 46(2001).
[20] M. P. Bakker, A. V. Barve, A. Zhan, L. A. Coldren, M. P. van Exter, and D. Bouwmeester,Appl. Phys. Lett.104,151109 (2014).
[21] C. Bonato, D. Ding, J. Gudat, S. Thon, H. Kim, P. M. Petroff, M. P. van Exter, and D. Bouwmeester, Appl. Phys. Lett.95, 251104(2009).
[22] P. W. Fryet al.,Phys. Rev. Lett.84,733(2000).
[23] R. J. Warburton, C. Schaflein, D. Haft, F. Bickel, A. Lorke, K. Karrai, J. M. Garcia, W. Schoenfeld, and P. M. Petroff,Nature (London)405,926(2000).
[24] S. Seidl, M. Kroner, A. Hgele, K. Karrai, R. J. Warburton, A. Badolato, and P. M. Petroff,Appl. Phys. Lett.88,203113 (2006).
[25] S. Sun, H. Kim, G. S. Solomon, and E. Waks,Appl. Phys. Lett. 103,151102(2013).
[26] J. Gudat, C. Bonato, E. van Nieuwenburg, S. Thon, H. Kim, P. M. Petroff, M. P. van Exter, and D. Bouwmeester, Appl. Phys. Lett.98,121111(2011).
[27] J. Houel, A. V. Kuhlmann, L. Greuter, F. Xue, M. Poggio, B. D. Gerardot, P. A. Dalgarno, A. Badolato, P. M. Petroff, A. Ludwig, D. Reuter, A. D. Wieck, and R. J. Warburton,Phys. Rev. Lett. 108,107401(2012).
[28] B. Urbaszek, X. Marie, T. Amand, O. Krebs, P. Voisin, P. Maletinsky, A. H¨ogele, and A. Imamoglu,Rev. Mod. Phys.85, 79(2013).
[29] A. Auff`eves-Garnier, C. Simon, J.-M. G´erard, and J.-P. Poizat, Phys. Rev. A75,053823(2007).
[30] E. Waks and J. Vuckovic, Phys. Rev. Lett. 96, 153601 (2006).
[31] M. Atat¨ure, J. Dreiser, A. Badolato, A. H¨ogele, K. Karrai, and A. Imamoglu,Science312,551(2006).
[32] A. H¨ogele, M. Kroner, S. Seidl, K. Karrai, M. Atat¨ure, J. Dreiser, A. Imamo˘glu, R. J. Warburton, A. Badolato, B. D. Gerardot, and P. M. Petroff, Appl. Phys. Lett.86,221905 (2005).
[33] R. J. Warburton,Nat. Mater.12,483(2013).