DRINKING WATER QUALITY AND HUMAN HEALTH: IMPACT OF HARMFUL ALGAE AND WATER PIPE BREAKS
Cynthia Jean Lin
A dissertation submitted to the faculty at the University of North Carolina at Chapel Hill in partial fulfillment of the requirements for the degree of Doctor of Philosophy in the
Department of Epidemiology in the Gillings School of Global Public Health.
Chapel Hill 2018
Approved by:
iii ABSTRACT
Cynthia Jean Lin: Drinking Water Quality and Human Health: Impact of Harmful Algae and Water Pipe Breaks
(Under the direction of David Richardson)
Many factors within a water system can influence drinking water quality. One example is the presence of cyanobacteria, which can naturally occur in surface water sources of drinking water and produce toxins associated with harmful algal blooms. Another example is the
deterioration of drinking water distribution systems, which can lead to pipe breaks. This study assessed how such factors within a large drinking water system serving metropolitan Boston communities may influence human health.
In Aim 1, Poisson regression models were used to estimate the associations between daily measures of cyanobacteria concentration in the water source and emergency department (ED) visits for acute gastrointestinal illness (AGI), respiratory illness, and dermal illness over a 7-year period (7/27/2005 – 9/30/2012). Considering both 2-4 and 5-7 day lag periods, small relative increases in daily ED visits were observed for AGI and respiratory illness when
comparing upper quartile levels of cyanobacteria concentrations with the lowest quartile (≤5.0 Areal Standard Units/mL).
iv
examined a major water pipe break in 2010 that resulted in a boil water order affecting 30 metropolitan Boston communities. Conditional fixed-effects logistic regression models
estimated the risk of ED visits for AGI during 0-3 and 4-7 day hazard periods. When restricted to zip codes served primarily by a single water service network, the association between main breaks and ED visits for AGI was slightly elevated during the 0-3 days after a break (Odds Ratio, OR=1.15; 95% Confidence Interval, CI: 0.99-1.34). Furthermore, there was an increased risk of ED visits for AGI during the 0-3 days after the major water pipe break in 2010 (OR=1.32; 95% CI: 1.07-1.61), particularly among children (≤5 years) and adolescents (6-18 years).
v
ACKNOWLEDGEMENTS
I am grateful to my dissertation committee, Drs. David Richardson, Timothy Wade, Elizabeth Hilborn, Howard Weinberg, and Larry Engel for their guidance, expertise, and encouragement. This project would not have been possible without their commitment and helpful feedback. I would also like to extend my sincere gratitude to my late advisor, Dr. Steve Wing, who encouraged me to come to UNC, guided me through my Master’s project and the start of this dissertation, and taught me so much about upholding the integrity of public health research.
This work would not have been possible without the collaboration of many people at Massachusetts Water Resources Authority (MWRA), Massachusetts Department of
Conservation and Recreation (DCR), and Boston Water and Sewer Commission (BWSC). I greatly appreciate their patience, approachability, and willingness to share data and expertise. For explaining the inner-workings of the MWRA water system, I would like to acknowledge Lisa Bina, Guy Foss, Stephen Estes-Smargiassi, and the MWRA librarians. For assisting me with the cyanobacteria analysis, I would like to acknowledge Julieta Klages, Jamie Carr, and Dr. Betsy Reilley. For sharing details about the water main breaks, I would like to acknowledge the engineers at BWSC, Stephan Shea and John Sullivan.
vi
Valerie Hudock, Jennifer Moore), professors, and students, who have all supported me throughout my time in the epidemiology program. I am particularly indebted to Drs. Timothy Wade and Elizabeth Hilborn at the EPA for enriching my academic experience and professional development. Not only did they provide an office for me to work, their guidance and
mentorship have been invaluable and I am very thankful. I am grateful to the GIS Librarian, Philip McDaniel, for spending countless hours helping me with all the GIS components of my project. I also appreciate all the financial support I received as a student to pursue and develop my research interests, specifically the Graduate Student Transportation Grant, the EPA
Environmental Research and Business Support Program (ORAU), the Oak Ridge Institute for Science and Education (ORISE) Research Participation Program at EPA, and the NIEHS pre-doctoral training grant.
vii
TABLE OF CONTENTS
LIST OF TABLES ... xi
LIST OF FIGURES ... xiii
LIST OF ABBREVIATIONS ... xv
CHAPTER 1. SPECIFIC AIMS ... 1
Specific Aim 1 ... 1
Specific Aim 2 ... 2
Study Significance ... 2
Study Innovation ... 3
CHAPTER 2. BACKGROUND ... 4
Drinking Water Exposures ... 4
Drinking Water-Associated Illnesses ... 6
Waterborne Pathogens ... 10
Maintaining Safe Drinking Water ... 13
Drinking Water Regulations ... 15
Drinking Water Sources ... 20
Water Treatment Processes ... 23
In-Home Water Treatment... 25
Water System Failures ... 27
Aim 1 Background: Harmful Algae ... 28
viii
CHAPTER 3. STUDY DESIGN, MATERIALS, AND METHODS ... 60
Overview ... 60
Massachusetts Water Resources Authority ... 60
History ... 62
Water Source ... 64
Water Treatment ... 65
Distribution System ... 68
Study Population ... 73
Health Outcomes ... 73
Massachusetts Healthcare Data ... 73
Use of ICD-9-CM diagnosis codes in healthcare ... 75
Gastrointestinal Illness (Aims 1 & 2) ... 75
Dermal Symptoms of Illness (Aim 1) ... 78
Respiratory Symptoms of Illness (Aim 1)... 78
Data Quality Assurance ... 80
Aim 1 Materials and Methods ... 80
Study Population ... 80
Health Outcomes ... 81
Cyanobacteria Exposure ... 82
Latency between Cyanobacteria Measurement and ED visits ... 85
Other Variables ... 86
Statistical Analysis ... 86
Aim 2a Materials and Methods ... 87
ix
Health Outcomes ... 87
Main Break Exposure ... 88
Statistical Analysis ... 89
Sensitivity Analysis ... 90
Summarizing Zip Codes by Service Network ... 91
Aim 2b Materials and Methods ... 94
Study Population ... 94
Negative Control Exposure ... 94
Health Outcome ... 96
Pipe Break Exposure ... 96
Statistical Analysis ... 96
CHAPTER 4. CYANOBACTERIA IN AN UNFILTERED DRINKING WATER SYSTEM AND EMERGENCY DEPARTMENT VISITS FOR GASTROINTESTINAL, RESPIRATORY, AND DERMAL ILLNESS ... 98
Introduction ... 98
Methods ... 101
Results ... 106
Discussion ... 109
Figures ... 112
Tables ... 114
Acknowledgements ... 119
CHAPTER 5. MAIN BREAKS AND EMERGENCY DEPARTMENT VISITS FOR ACUTE GASTROINTESTINAL ILLNESS, A 10 YEAR LONGITUDINAL STUDY IN BOSTON, MASSACHUSETTS ... 120
Introduction ... 120
x
Results ... 125
Discussion ... 127
Figures ... 134
Tables ... 135
Acknowledgements ... 138
CHAPTER 6. EMERGENCY DEPARTMENT VISITS FOR ACUTE GASTROINTESTINAL ILLNESS AFTER A MAJOR WATER PIPE BREAK IN 2010 ... 139
Introduction ... 139
Methods ... 141
Results ... 145
Discussion ... 146
Figures ... 152
Tables ... 154
Acknowledgements ... 156
CHAPTER 7. DISCUSSION ... 157
Summary of Findings ... 157
Strengths ... 158
Limitations ... 160
Significance ... 163
Recommendations ... 166
Future Directions ... 167
Conclusion ... 168
APPENDIX 1: NATIONAL PRIMARY DRINKING WATER REGULATIONS ... 169
APPENDIX 2: NATIONAL SECONDARY DRINKING WATER REGULATIONS ... 171
xi LIST OF TABLES
Table 1. International drinking water guidelines for microcystins. ... 34
Table 2. U.S. state drinking water guidelines for microcystins. ... 34
Table 3. Cyanotoxin treatment processes and relative effectiveness. ... 42
Table 4. Common problems of different pipe materials. ... 52
Table 5. Factors affecting pipe breakage rates. ... 52
Table 6. MWRA communities with full water service. ... 61
Table 7. Water treatment steps at the John J. Carroll Water Treatment Plant (CWTP). ... 66
Table 8. Approximate travel times from the Norumbega facility to select communities, prior to 2005. ... 72
Table 9. ICD-9-CM diagnosis codes that have been used to define acute gastrointestinal illness. ... 77
Table 10. ICD-9-CM diagnosis codes used to define study outcomes. ... 79
Table 11. Emergency department visits in the Metropolitan Boston area, Massachusetts, 7/27/2005-9/30/2012. ... 114
Table 12. Summary of daily measures considered in analysis. ... 115
Table 13. Cyanobacteria in the Wachusett Reservoir and emergency department visits in Metropolitan Boston, Massachusetts, 7/27/2005-9/30/2012. ... 116
Table 14. Estimated number of emergency department visits per day, by cyanobacteria quartile. ... 118
Table 15. Descriptive summary of emergency department visits for acute gastrointestinal illness in Boston, Massachusetts (October 1, 2002 - September 30, 2012). ... 135
Table 16. Association between water main breaks and emergency department visits for acute gastrointestinal illness in Boston, Massachusetts (October 1, 2002 - September 30, 2012). ... 136
xii
Table 18. Descriptive summary of emergency department visits for acute
gastrointestinal illness (April 3, 2010 - June 5, 2010). ... 154 Table 19. Association between the major water pipe break and emergency department
xiii LIST OF FIGURES
Figure 1: Routes of water exposure: ingestion, inhalation, dermal absorption. ... 5
Figure 2: Microbial agents associated with drinking water outbreaks in developed countries. ... 13
Figure 3: Fundamental stages of ensuring safe drinking water quality. ... 14
Figure 4: Different types of water systems, as defined by the EPA. ... 15
Figure 5: Ground water versus surface water. ... 21
Figure 6: Causes of pathogenic outbreaks. ... 28
Figure 7: Cyanobacterial harmful algal blooms in the United States. ... 35
Figure 8: Drinking water distribution system. ... 44
Figure 9: Pathogen intrusion factors. ... 48
Figure 10: Different types of failures in pipes. ... 50
Figure 11: Etiologic agents of U.S. waterborne outbreaks associated with disruptions in the distribution infrastructure from 1981 to 2010. ... 55
Figure 12: Disruptions in the distribution system that were associated with U.S. waterborne outbreaks from 1981 to 2010. ... 55
Figure 13: Massachusetts Water Resources Authority (MWRA) service areas. ... 62
Figure 14: MetroWest Water Supply Tunnel. ... 64
Figure 15: Water Plant Process Schematic (since the addition of ultraviolet disinfection in April 2014). ... 67
Figure 16: Massachusetts Water Resources Authority (MWRA) water system. ... 69
Figure 17: Range of water travel times for each section of the MWRA system. ... 71
Figure 18. Metropolitan Boston Communities included in Aim 1. ... 81
Figure 19: Wachusett sampling locations. ... 83
xiv
Figure 21: Microcystis observed in the Wachusett Reservoir in July 2015. ... 84 Figure 22. Number of main breaks by zip codes in Boston, 10/1/2002 – 9/30/2012. ... 88 Figure 23. Boston Water Service Areas. ... 91 Figure 24. Massachusetts communities studied in relation to the 2010 water
pipe break. ... 95 Figure 25. Metropolitan Boston Communities included in analysis. ... 112 Figure 26. Time-series of Total Cyanobacteria in Wachusett Reservoir,
7/27/2005-9/30/2012. ... 113 Figure 27. Time-series of Emergency Department Visits in the Metropolitan
Boston area, Massachusetts, 7/27/2005-9/30/2012. ... 113 Figure 28. Number of main breaks by zip codes in Boston, Massachusetts,
Oct. 1, 2002 – Sept. 30, 2012. ... 134 Figure 29. Massachusetts communities studied in relation to the 2010 water
pipe break. ... 152 Figure 30. Odds ratios and 95% confidence intervals for emergency department
visits for acute gastrointestinal illness in the A) 0-3 and B) 4-7 days following the
xv
LIST OF ABBREVIATIONS
AGI Acute gastrointestinal illness ASU Areal Standard Units
BWSC Boston Water and Sewer Commission CDC Centers for Disease Control and Prevention CI Confidence interval
CWTP John J. Carroll Water Treatment Plant
DCR Massachusetts Department of Conservation and Recreation
ED Emergency department
EPA U.S. Environmental Protection Agency
ICD-9-CM International Classification of Disease, Version 9, Clinical Modification IRR Incidence rate ratio
MA Massachusetts
MWRA Massachusetts Water Resources Authority MGD Millions of gallons per day
OR Odds ratio
1
CHAPTER 1. SPECIFIC AIMS
Inadequately treated and contaminated drinking water can result in a wide range of adverse health effects, such as gastrointestinal, respiratory, and dermal symptoms of illness. Within a municipal water system, many factors can influence drinking water quality. The objective of this dissertation was to examine whether two potential contamination events are associated with increased illness. The first was the presence of cyanobacteria, or blue-green algae, in the water source. The second was pipe breaks in the drinking water distribution system. Both questions were analyzed within the context of a large water system operated by the Massachusetts Water Resources Authority (MWRA) that provides drinking water to
metropolitan Boston communities.
Specific Aim 1
The first Specific Aim was to estimate the association between daily measures of cyanobacteria in the Wachusett Reservoir and emergency department (ED) visits for acute gastrointestinal, respiratory, and dermal symptoms of illness in metropolitan Boston
communities served by MWRA over a 7-year period (7/27/2005 – 9/30/2012). The hypothesis was that higher levels of cyanobacteria in the drinking water source would increase the rate of ED visits for acute gastrointestinal, respiratory, and/or dermal symptoms of illness. This
2
the effect of cyanobacteria was hypothesized to be strongest in sensitive populations, such as children and elderly.
Specific Aim 2
The second Specific Aim had two parts. The first (Aim 2a) was to estimate the
association between water main breaks and ED visits for acute gastrointestinal illness (AGI) over a 10-year period (10/1/2002 – 9/30/2012) in the City of Boston. The second (Aim 2b) was to estimate the association between a major water pipe break in 2010 and ED visits for AGI in metropolitan Boston communities affected by the subsequent boil water order. The overall hypothesis was that the occurrence of water main breaks would have a positive association with subsequent ED visits for AGI. This association was anticipated to be strongest with the major water pipe break in 2010 (Aim 2b). Sensitive populations, such as children and elderly, were expected to be most affected.
Study Significance
Unplanned and unregulated events, such as the amount of cyanobacteria in the source water (1-5) and the occurrence of main breaks (6, 7), are projected to increase over time due to a changing climate and aging infrastructure. Therefore, human exposure to contaminated drinking water may also increase. Harmful algal blooms and water main breaks are
3
response plans. Since drinking water is a human necessity, uncovering even a small effect could have major public health implications.
Study Innovation
This dissertation project addresses gaps in the literature regarding the human health impact of potential contamination events in municipal drinking water systems. The first
Specific Aim provides insight on chronic low levels of cyanobacteria since the existing literature focuses primarily on high bloom levels that resulted in disease outbreaks. Low-level drinking water exposure to cyanobacteria provides a more common scenario experienced by water treatment plants. The second Specific Aim focuses on characterizing the risk of AGI after a main break. While it is established that pressure transients can allow contaminants to enter a
4
CHAPTER 2. BACKGROUND
Drinking Water Exposures
Water is essential to sustain human life(10). Specifically, water is the solvent for biochemical reactions, is essential for cellular homeostasis, absorbs the body heat from
metabolic processes, maintains vascular volume, and serves as the medium for transport within the body by supplying nutrients and removing waste(11). Severe dehydration can lead to low blood pressure, rapid heartbeat, and even delirium(12). Serious complications of dehydration include cerebral edema, seizures, and kidney failure(13). Given these health risks, staying hydrated is an important part of maintaining health(14, 15). The Institute of Medicine
recommends a daily total water intake of 2.7 liters (91 ounces) for healthy adult women and 3.7 liters (125 ounces daily) for healthy adult men(16). Total water intake can come from all
beverages and foods(16).
5
age of two(17). Based on nationwide dietary intake data, the average daily intake of plain drinking water is 3.9 cups, with over half (61%) of the overall intake coming from tap water versus bottled water(17). Most (69%) of the plain drinking water consumed occurs at home, with tap water accounting for two-thirds of the water consumed at home(17). Factors affecting water intake may include physical activity, extreme temperatures (hot and cold), and
altitude(11). In addition, adult women (≥20 years) are more likely to report drinking water compared to men, especially among those over the age of 60 years(17).
Most people consume and come in contact with tap water(18). Human exposure to contaminants in tap water can occur through ingestion, inhalation, and/or dermal absorption (see Figure 1)(19). Aside from drinking, water is also used for many everyday purposes, from cooking, cleaning, bathing and other basic hygiene, to recreational, agricultural, and industrial activities(20). The average American family uses over 300 gallons of water per day at home(21). With drinking water exposure being essentially universal, studies finding even a small effect on illness could have a major impact on public health(22).
Figure 1: Routes of water exposure: ingestion, inhalation, dermal absorption.
6 Drinking Water-Associated Illnesses
When drinking water is not adequately treated, human exposure to waterborne contaminants such as pathogenic microorganism (waterborne pathogens) can lead to subsequent illness(23, 24). In fact, prior to drinking water disinfection, the occurrence of diseases such as cholera and typhoid were common the U.S. and killed thousands(25). Considering the global challenges of producing safe water, the U.S. and other developed countries generally provide wide access to high-quality, safe drinking water supplies(26). Despite the wealth in resources and technologies in developed countries, however, poor quality source water, inadequate treatment, and failing distribution infrastructures still exist and waterborne illnesses associated with drinking water still occur(26-29). Also, a changing climate can impact water quality(4, 30). For example, extreme weather events such as heavy
precipitation and flooding can cause heavy runoff events to pollute drinking water sources and increased nutrient loadings can cause extensive algal blooms(4, 30). In addition, floods can threaten the water distribution infrastructure(30, 31). Contaminated drinking water can lead to serious health consequences, especially among sensitive populations (e.g., infants and young children, elderly, pregnant women, immunocompromised groups)(27, 32, 33). According to a review of waterborne disease outbreaks occurring in developed nations, contributing factors include: contamination by wastewater, insufficient knowledge of source water hazards, inadequate disinfection, severe weather (e.g., heavy precipitation and runoff), filtration
problems, cross-connections and distribution failures, livestock or wildlife fecal contamination, and changes in plant maintenance or treatment process(26). In the U.S., the majority of
7
and distribution system deficiencies(4). Aside from factors directly contributing to drinking water outbreaks, there can be income or racial disparities in water infrastructure maintenance and drinking water quality(34, 35). Drinking water-associated illnesses, even if sub-clinical, could result in loss of productivity at work and school for both the affected individuals and their caregivers(36, 37). With acute cases of illness, there can also be added healthcare and medication costs(36).
The types of illness that have been associated with drinking water contaminants (e.g., bacteria, chemicals, parasites, viruses) include acute gastrointestinal illness, acute respiratory illness, skin infections, neurological illness, and inflammation of the liver(19). Acute
8
The Centers for Disease Control and Prevention (CDC) defines a waterborne disease outbreak as two or more persons experiencing a similar illness and are epidemiologically linked by time and by location to water exposure(19, 42). The CDC, along with the EPA and the Council of State and Territorial Epidemiologists (CSTE), conduct regular surveillance for waterborne disease outbreaks(19). During the 36-year period from 1971 through 2006, 780 outbreaks were associated with drinking water exposure in the U.S., resulting in 577,094 cases of illness(19). The total number of illnesses, however, was strongly influenced by an estimated 403,000 cases from a single outbreak occurring in 1993 when a filtration process failed to remove Cryptosporidium oocysts at a municipal water treatment plant in Milwaukee,
Wisconsin(19, 39). This single outbreak was associated with 4,400 hospitalizations(36) and 50 deaths(43). After excluding the Milwaukee outbreak, the average size of a drinking water-associated outbreak was estimated to be 340.5 cases for community water systems and 162.6 cases for non-community water systems(19). In the most recent surveillance report published by the CDC, 32 drinking water-associated outbreaks were reported from 2011 through 2012, accounting for at least 431 cases of illness, 102 hospitalizations, and 14 deaths(41). Although this may appear to be a relatively low public health burden, the authors note that outbreak surveillance data underestimate actual values and should therefore not be used to evaluate the total number of outbreaks or cases of waterborne disease(41).
9
consumption, and illness(26, 27, 41, 42). Specifically, the factors influencing the underreporting of gastrointestinal infections include the large number of asymptomatic cases, symptomatic cases that do not seek treatment, cases that seek treatment but are not given a specific diagnosis and/or are not asked to provide information regarding exposures, and cases that actually receive a diagnosis but are not then reported(44, 45). Also, since the level of surveillance and reporting activity, as well as reporting requirements, vary across states and localities, it is difficult to produce a comprehensive national statistic(41). Of all the illnesses associated with the massive cryptosporidiosis outbreak in Milwaukee, it has been estimated that the majority (88%) did not seek medical attention and only about 11% seen as outpatient and 1% hospitalized(36). As expected, cases typically sought health care only when the illness was severe or prolonged(39).
To address some of the data limitations of waterborne disease outbreaks, several
attempts have been made to quantify the background or endemic levels of waterborne disease. Morris and Levins (1995) estimated an annual incidence of 7.1 million cases of gastrointestinal infections and 1,200 deaths attributable to waterborne disease(45). Colford et al. (2006) estimated a range of 4.26 to 11.69 million cases of acute gastrointestinal illness in the U.S. attributable to drinking water from community drinking water systems(46). Accounting for all waterborne illnesses attributable to drinking water (i.e., not just gastroenteritis), Reynolds et al. (2008) estimated 26 million infections and 13 million illnesses occurring each year in U.S.
10 Waterborne Pathogens
Water contamination can originate from many different sources, including nearby land use practices (fertilizers, pesticides, livestock), naturally occurring chemicals and minerals (e.g., arsenic, radon, uranium), manufacturing processes, and sewer overflows or wastewater
releases (47). While most enteric and opportunistic pathogens that can spread by the fecal-oral route can also be transmitted through water, an organism’s ability to cause a waterborne disease outbreak depends on its rate of survival in the water environment and its infectious dose(42, 44). Enteric pathogens that can survive but not proliferate in drinking water include
Vibrio cholerae, Shigella spp., Campylobacter jejuni, Giardia lamblia, and Cryptosporidium
parvum(44). Giardia and Cryptosporidium are two of the most common and bothersome
protozoan parasites since they can develop into hard-shelled cysts resistant to chlorine disinfection(24). Other waterborne enteric bacteria include Salmonella and certain strains of
Escherichia coli(27, 42). Environmental pathogens that can both survive and proliferate in
drinking water include a number of opportunistic pathogens, such as Legionella spp.,
Aeromonas spp., Pseudomonas aeruginosa, and Mycobacterium avium(42, 44). There are also
toxins produced by certain freshwater harmful algae (e.g., cyanobacteria)(4). Viruses of greatest concern in water include enteroviruses, hepatitis A virus, noroviruses, astrovirus, adenovirus, and rotavirus(27). While viruses cannot multiply in the receiving waters, their infective dose is low, typically ranging from just one to ten infectious units(42).
11
radon, radioactive runoff from mining, radioactive minerals from coal-fired power plants), and additives and their respective by-products (e.g., chlorine, fluoride, flocculating agents)(24). Newly emerging diseases also provide challenges to ensuring safe drinking water(48). Such challenges include resistance to chlorination or disinfection, resistance to standard medical treatment, zoonotic as well as human transmission, and low infective dose(48).
Given the abundance of potential waterborne pathogens in drinking waters, Messner et
al. (2006) has stressed the need for addressing exposure to mixtures of pathogens, rather than
to an individual pathogen, when considering health risks(27, 38). They contend that there could be an order of magnitude difference between the risk from regulated pathogens (e.g.
Cryptosporidium) and the risk from the total mixture of pathogens that people may be exposed
to from drinking water(38).
Since it is impossible to measure every possible waterborne pathogen, drinking water turbidity has often been used as a proxy measure for potential microbial contamination and the effectiveness of drinking water treatment(22, 49-51). When light penetrates a water sample, turbidity is a measure of the amount of light that is scattered by material in the water (i.e., relative clarity; cloudiness)(52). Pathogens (e.g., viruses, parasites, bacteria), along with clay, silt, finely divided inorganic and organic matter, algae, and plankton, can be among the mix of material found in water(51, 52). While outbreaks of gastrointestinal illness have been linked to extreme turbidity events(39, 53, 54), the findings from epidemiology studies have been
12
water turbidity and emergency department visits for gastrointestinal illness(55). Furthermore, they did not find an association with filtered water turbidity, thus highlighting the importance of considering source water quality (55). Similarly, Beaudeau et al. (1999) had found an
association between raw water turbidity and subsequent antidiarrheal drug sales, but not with filtered water turbidity(56). Recently, Hsieh et al. (2015) found an association between source water turbidity in New York City and emergency department visits for diarrhea among the youngest age groups during the spring season, but concluded that the majority of the temporal variation in diarrhea was due to seasonal illness patterns unrelated to source water
turbidity(57). In effluent water, a study in Russia found an association between an increase in water turbidity and an increased risk of self-reported gastrointestinal illness with a lag of 2 days(58).
An etiology was determined for 55% of the 780 outbreaks associated with drinking water occurring from 1971 to 2006 in the U.S(19). Of those, parasites were most frequently identified (18%), followed by non-Legionella bacteria (13%), chemicals (12%), and viruses (8%)(19). Legionella (3%) was only identified as the etiologic agent during the latter part of the 31-year period from 2001 to 2006(19). Only six outbreaks (<1%) reported mixed agents (i.e., combination of bacteria, parasites, and/or viruses)(19). Also, demonstrating the limitations in available data, it is important to note that no etiology was reported for 45% of the
outbreaks(19). During the cryptosporidiosis outbreak in Milwaukee, physicians usually
13
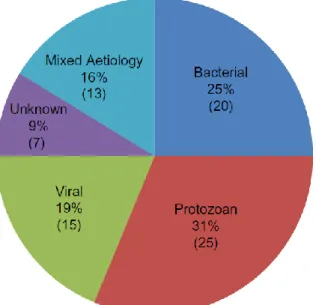
were Campylobacter spp., Norovirus and Cryptosporidium spp.(59). Onyango et al. (2015) reported that 75% of cases were linked to a single microbial species, though the remaining 25% had either an unknown microbial agent or multiple etiologies of infection (see Figure 2)(59).
Figure 2: Microbial agents associated with drinking water outbreaks in developed countries. Source: Onyango et al. 2015 (59)
Maintaining Safe Drinking Water
14
Figure 3: Fundamental stages of ensuring safe drinking water quality.
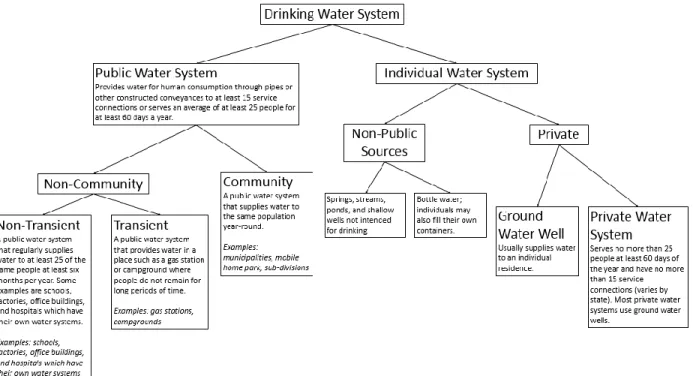
The U.S. Environmental Protection Agency (EPA) defines drinking water systems as either public or individual(60, 61). There are three types of public water systems: community; non-transient non-community; and transient non-community (see Figure 4 for definitions)(62). Of the approximately 153,530 public drinking water systems, 34% are community systems that serve the same population year-round(62, 63). The majority (82%) of the U.S. population is served by just 8% of the community water systems(63). During the 2009 fiscal year, there were a total of 51,651 community water systems serving 294,339,881 people(63). Individual water systems consist of the use of non-public sources (e.g., bottled water) and private water systems (e.g., ground water wells)(60). In 2010, the majority (87%) of the U.S. population received their water from a public-supply system and only about 14% supplied their own water for domestic use(64, 65).
Water Source is protected against natural and man-made pollution
Treatment Processes are effective and up-to-date pollution
15
Figure 4: Different types of water systems, as defined by the EPA. Source: EPA 2015 (62), CDC 2014 (60)
Drinking Water Regulations
16
with these standards(69, 70). Aside from setting legal limits on drinking water contaminants, the EPA also standardizes water-testing schedules and methods that water systems must follow(71). Under the SDWA, each level of government (e.g., federal, state, tribal), every public water system, and the individual consumer have distinct roles and responsibilities(69, 72-74). Public water systems regulated by the EPA supply drinking water to 90% of the country’s population(69). Individual water systems, such as privately owned wells, are not regulated by the EPA so it is up to the individual homeowners to maintain the safety of their water(60).
The National Primary Drinking Water Regulations (NPDWRs or primary standards), established by EPA under the SDWA, requires public water systems to comply with the
maximum contaminant levels (MCLs) for a list of contaminants(75). Currently, EPA has drinking water regulations for over 90 contaminants(51, 76). These contaminants include
microorganisms, such as Cryptosporidium, Giardia lamblia, total coliforms, and enteric viruses(51). Public water systems closely monitor bacteria because they can pose a
17
drinking water regulation at least once every six years and, if needed, revises them according to any new data, information, and technologies(79). See Appendix 1 for list of NPDWRs.
Under SDWA, there are four types of reportable violations: 1) health-based; 2)
monitoring and reporting; 3) public notice; and 4) other(80). Health-based violations are related to noncompliance with treatment requirements or exceedances in maximum contaminant or residual disinfectant concentrations(80). Monitoring and reporting violations are related to inconsistent monitoring or not reporting monitoring results on time(80). Public notice violations are related to inadequate consumer alerts of drinking water issues(80). Other violations are related to additional SDWA requirements, such as failing to issue annual consumer confidence reports(80). When SDWA marked its 25th anniversary at the end of 1999, the national goal for drinking water was set to provide water that met all health-based standards to 95% of the population served by public drinking water supplies by 2005(81, 82). In 2002, the level of compliance with these health-based standards was already 94%(81, 83).
For both groundwater and surface water systems during the 2011 fiscal year, 55% of all community water systems had at least one violation of SDWA regulations(84). These
community water systems served a total of 95.4 million people(84). Most of the violations were related to monitoring and reporting requirements and public notification or consumer confidence reporting requirements. Only about 10% of all community water systems had a health-related violation (e.g., exceeding a maximum contaminant level or violating a treatment technique)(84). The most common health-related violations during the 2011 fiscal year
18
where arsenic naturally occurs at high levels), and lead and copper (mainly in 15 states)(84). In general, Rubin (2013) found that SDWA violations during the 2011 fiscal year did not vary by source water or size of the community water systems(84). It is important to note, however, that compliance statistics are based on violations reported by states to the EPA Safe Drinking Water Information System, so there can be inaccuracies and underreporting of some data(63).
Resulting from the 1996 SDWA amendments, the EPA requires community water systems to provide customers with an annual drinking water quality report, referred to as a Consumer Confidence Report (CCR)(85). The purpose of the CCR is for water utilities to inform their customers about the drinking water quality(85). Specifically, the CCR describes the local water source and its risk of contamination(85). It also provides a summary on compliance with regulations, including detected contaminant levels(85). About 300 million residents receive water from a water utility that is mandated to provide a CCR to its customers(63). Despite having the potential to be a powerful public resource, however, CCRs have been shown to be inadequate in informing consumers about the safety of their drinking water(86, 87). Also, the public disclosure of information may alter the reporting behavior of water suppliers(88). Since the CCR requirement has been in place, Bennear and Olmstead (2008) found that violations reported by large water suppliers (serving 10,000 or more people) reduced in the state of Massachusetts(88). Specifically, total violations reduced by 30-44% and more severe health violations reduced by 40–57%(88).
19
aesthetic effects (e.g., taste, odor, or color) in drinking water(75). While EPA does not enforce these secondary standards, "secondary maximum contaminant levels" serve as guidelines to assist public water systems in managing their drinking water(75). Although these secondary contaminants are not known to cause health problems, the aesthetic nuisance they can cause may deter consumers from using the water even though it is actually safe to drink(75). See Appendix 2 for list of NSDWRs.
The Contaminant Candidate List (CCL) serves as the first level of evaluation for unregulated drinking water contaminants with a potential for public health concern(89). Published every five years, the CCL contains drinking water contaminants that are known or anticipated to occur in public water systems but are not subject to federal drinking water regulations(89). The list includes pesticides, disinfection byproducts, chemicals used in
commerce, waterborne pathogens, pharmaceuticals, and biological toxins(90). After a final CCL is published, the EPA must evaluate at least five contaminants and make a formal decision on whether a national primary drinking water regulation for each contaminant should be
developed(89). When making a regulatory determination, EPA considers the following criteria: 1) potential adverse health effect of the contaminant; 2) occurrence of the contaminant in public water systems and levels which threaten public health; and 3) prospect that a regulation would reduce health risks(89). After reviewing the CCL, the Unregulated Contaminant
20 Drinking Water Sources
21
Figure 5: Ground water versus surface water. Source: United States Geological Survey (USGS)
http://www.cdc.gov/healthywater/drinking/public/water_sources_groundwater_fig.html
Source Water Contamination
Source water can be contaminated by natural and man-made contaminants(69, 92). Surface runoff, along with treated and untreated discharges from industry and wastewater treatment plants, bring pollutants in direct contact with surface water. As more land gets developed and impervious surfaces increase, so does the amount of runoff from
22
to ground water quality are underground storage tanks, septic systems, landfills, industrial facilities, and agricultural operations(69).
Source Water Protection
Source water protection is crucial in maintaining safe drinking water supplies(48, 93). Not only does it reduce the public health risks associated with exposures to contaminated water, but it also reduces treatment costs(93). Source water protection relies on the
involvement of many different players, from the EPA and other federal agencies, to businesses and industries, to local utilities and resources(93). The EPA and other federal agencies provide the guidance and resources needed for implementing protection(93). For example, the Clean Water Act establishes the basic structure for regulating pollutant discharges and surface water quality standards(93, 94). State and local governments play important roles in applying and assessing locally-relevant protection activities(93). Water utilities can promote the protection of their source waters through education campaigns and community partnerships(93).
Businesses and industries can directly contribute to source water protection by reducing their use of harmful contaminants and ensuring proper disposal of their waste products(93).
Studies have suggested that drinking water quality is directly related to land-cover composition of the source areas(95, 96). Thus, protection of the watershed surrounding source waters is an important component of protecting drinking water supplies. Approximately 78% of the contiguous U.S. is situated within a drinking water watershed(96). The supply and
23
drinking water watersheds generally had a high percentage of natural vegetation but a low percentage set aside for conservation(96). Over time, drinking water watersheds may gradually lose their natural vegetation and increase in urban land development(96). Due to increased population and increased pollution, however, many watersheds are in need of protection(97). The EPA’s Office of Wastewater Management oversees the safeguard of waters and watersheds in the U.S. and promotes the Clean Water Act by encouraging effective and responsible water practices in addition to watershed protection and restoration(69).
Water Treatment Processes
Since source waters can almost all be potentially impacted by some type of
contamination, nearly all public water systems require at least some type of treatment before being distributed to consumers(69). There are various methods of water treatment used by public drinking water systems to ensure safe drinking water. The steps most commonly used by community water systems (mainly surface water treatment) include: coagulation and
24
in the U.S., a residual is required to protect the water from pathogens while in the distribution system(29, 98). Disinfection treatment processes for microbiological contaminants include chlorination, chloramination, ozonation, ultra-violet irradiation and chlorine dioxide
disinfection(29, 81, 99). Chlorination is probably the most widely used and generally the most cost-effective method of drinking water disinfection(29). In terms of cost, efficacy, stability, ease of application, and formation of by-products, every disinfectant has its advantages and disadvantages(99).
Since all disinfectants are reactive substances, they will inevitably produce
by-products(99). Chlorine-based disinfectants are the most commonly used disinfectants because they are inexpensive, easy to use, and usually effective for bacteria and viruses. However, chlorination is not always effective against parasites and it produces disinfection by-products (e.g., trihalomethanes, haloacetic acids, bromate, chlorite)(99). Disinfectants such as
chloramines, ozone, chlorine dioxide, and ultraviolet disinfection are gaining popularity as alternatives to chlorine(99). Of these, ozone has been noted as the most efficient disinfectant for inactivating bacteria, viruses, and protozoa(99). Existing risk assessment studies are inconclusive regarding the public health implications of drinking water exposure to
disinfectants and their by-products(100). However, the WHO concludes that the estimated health risks from disinfectants and their by-products are negligible when compared to the actual risks associated with inadequate disinfection(99, 101).
A number of U.S. cities have avoided construction of filtration plants by investing
25
possible because the municipal water authority owned and was able to protect the critical watershed lands(97). In the case of New York City, however, a multifaceted agreement with watershed communities was necessary due to the private ownership of approximately three quarters of the watershed(97). Utilizing an unfiltered surface supply, New York City provides 9 million consumers with approximately 1.5 billion gallons of water per day(30). Without
filtration, the city relies on chlorination, fluoridation, and corrosion control to treat the water and also routinely monitors water quality indicators, such as coliform bacteria, turbidity, temperature, and pH(30). In the event that extreme conditions increase turbidity levels, the city may also resort to additional chemical treatments, such as alum and sodium hydroxide(30). Increasingly, many of these unfiltered water systems may be threatened by developments in their watersheds and face greater risk of microbiological and chemical pollution(102). As a result, some cities with unfiltered water systems have been ordered by either the EPA or state government to filter their water or to improve water treatment through use of advanced disinfection technologies such as ozone or ultraviolet light(102).
In-Home Water Treatment
In addition to the typical municipal water treatment, there are several types of in-home water treatment systems that can target a specific or range of contaminants as well as improve taste and odor(103). Contaminants that can be removed by in-home treatment systems
26
treatment systems range from whole-house systems to simpler point-of-use systems(103). Whole house systems usually treat the water at the point of entry in order to treat all or most of the water entering a residence(103). Consequently, they are typically installed near the water meter (municipal) or pressurized storage tank (well water)(103). Whole-house systems include ultraviolet microbiological systems, water softeners, and whole-house filters for chlorine, taste, odor and particulates(103). Alternatively, point-of-use systems typically treat water at the point of consumption and include water pitchers, faucet filters, and reverse osmosis systems(103). The majority of available home water filters remove Cryptosporidium, though some filter designs are more suitable than others(104). Technologies more likely to reduce Cryptosporidium include filters with reverse osmosis and those with an absolute pore size of 1 micron or smaller(104). Activated carbon filters are commonly used to treat general taste and odor problems, including the removal of chlorine residuals(24). Although these filters do not remove nitrate, bacteria, or metals, they are one of the best methods for the removal of certain organic chemicals, including some pesticide residues, which adsorb to the surfaces of the carbon particles(24). Obviously, the effectiveness of any in-home water treatment system depends on proper use and maintenance(24). For example, activated carbon filters are
designed to filter a certain amount of water and then can become clogged or their contaminant removal capacity has been exceeded rendering them ineffective(77).
27
studied, the results were inconsistent as some contaminant concentrations increased and others decreased(105). In a randomized intervention trial assessing the use of reverse-osmosis filters in Montreal, 35% of the self-reported gastrointestinal illness was related to the water and considered preventable(106). Nevertheless, in a double-blinded, randomized, controlled intervention study conducted in Australia, the use of a combined 1-μm filtration and ultraviolet treatment did not seem to impact the incidence of self-reported gastrointestinal illness among residents drawing from a high quality water source(107). Similarly, in a triple-blinded,
randomized, controlled intervention study conducted in Iowa, the use of a combined 1-μm filtration and ultraviolet treatment did not affect the incidence of self-reported gastrointestinal illness among residents drawing from a microbiologically challenged water source(108).
Water System Failures
28
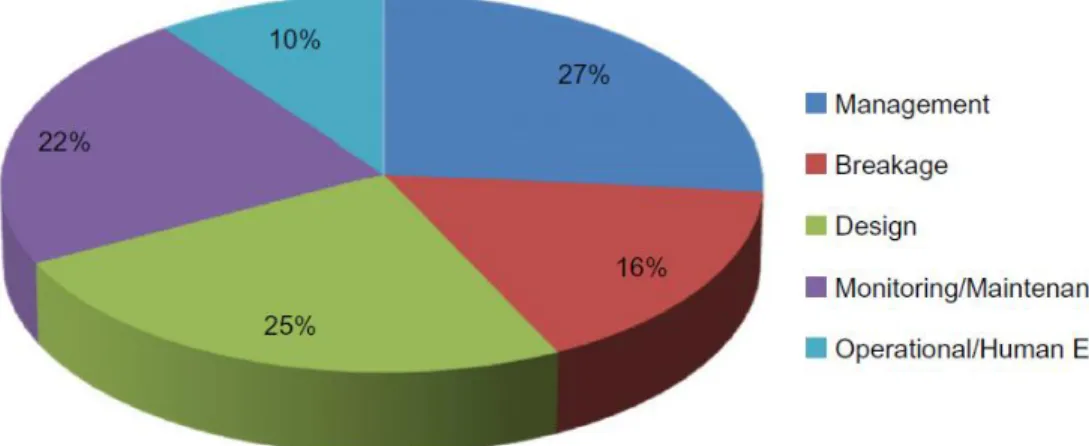
infrastructural design (25%)(59). Figure 6 shows the breakdown of causes identified. According to a quantitative microbial risk assessment (QMRA) on microbial health risks due to failures in Swedish drinking water systems, the majority of potential infections resulted from pathogens passing treatment during normal operation and not due to failures(109). The primary water treatment risks identified were related to sub-optimal particle removal or disinfection malfunction(109).
Figure 6: Causes of pathogenic outbreaks. Source: Onyango et al. 2015 (59)
Aim 1 Background: Harmful Algae
29
states and can have substantial consequences on human health, aquatic ecosystems, and the economy(8).
Cyanobacteria, also referred to as blue-green algae, are microscopic organisms that naturally occur in fresh, estuarine, and marine waters(112). While cyanobacteria have a bacterial ancestry, they are considered to be algae by phycologists due to phenotypic
similarities(113). Depending on the species, they can occur as single cells, filaments of cells, or colonies(114). Some species live dispersed in the water (phytoplankton) whereas others grow on sediments (phytobenthos)(115). Cyanobacteria help maintain marine and freshwater ecosystems by producing oxygen (as a by-product of photosynthesis) and by serving as a food source for other organisms(115, 116). However, under certain environmental conditions, such as high nutrient levels, warmer temperatures, and sun exposure, an excessive proliferation of cyanobacteria can form a bloom(5, 114, 115). With a changing climate impacting freshwater and marine environments, harmful algal blooms may end up occurring more often, in more places, and at higher intensities(1-5). Climate impacts potentially affecting algal blooms
include: warming water temperature; changes in salinity resulting from droughts; higher carbon dioxide levels; changes in rainfall leading to more nutrient runoff; sea level rise creating more shallow and stable coastal waters; and coastal upwelling bringing nutrients from the ocean floor to the surface(1, 4, 5).
30
hepatotoxins, neurotoxins, and dermatotoxins(115, 116, 119). While taste-and-odor
compounds and toxins frequently co-occur, odor alone does not indicate the presence of toxins because toxins still occur more frequently than taste-and-odor compounds(118).
Cyanotoxins are a diverse group of natural toxins that can be produced by a wide variety of planktonic cyanobacteria(112, 115). Most cyanotoxins, including anatoxin-a and
microcystins, are produced and contained intracellularly and released in an algal bloom during cell death and lysis(111, 112). However, some cyanotoxins, such as cylindrospermopsin, may be naturally released to the water by the live cyanobacterial cell, existing approximately 50% intracellularly and 50% extracellularly(111). Compared to intracellular toxins, extracellular toxins can be more challenging to remove because they may adsorb to clays and organic material in the water column(111).
Cyanotoxins can be divided into three general groups of chemical structure: cyclic peptides, alkaloids, and lipopolysaccharides(115). Cyclic peptides include microcystins and nodularin, both of which primarily target the liver and are the most frequently found cyanobacterial toxins in freshwater blooms(115). Microcystins are produced by a range of cyanobacterial genera (e.g., Anabaena, Fischerella, Gloeotrichia, Nodularia, Nostoc, Oscillatoria, members of Microcystis, Planktothrix) and can bioaccumulate in common aquatic vertebrates and invertebrates such as fish, mussels, and zooplankton(112). Of the 80 or so known
31
acid component generally elicits an irritant of allergenic response in humans and
mammals(115). The most commonly identified cyanotoxins in the U.S. are microcystins, cylindrospermopsin, anatoxins, and saxitoxins(112).
The risk for exposure to cyanotoxins is not always obvious since toxins may still be present in the absence of a bloom or visible scum on the water(120). As mentioned above, this is because cyanotoxins are generally contained within cells and only released into surrounding waters during cell death and lysis(120). Therefore, waters that appear to be free of
cyanobacteria may actually be contaminated with free toxin(120). Also, treatment methods may lyse cells and release toxins into the water(120). In 2007, EPA identified microcystins, a group of cyanotoxins, in approximately one-third of the nation’s lakes(121).
Aside from producing toxins, cyanobacteria can present other treatment challenges for public water systems, including taste and odor and shortened filter run times(117, 122). The occurrence of cyanotoxins in drinking water depends on their concentration in the raw source water and how well the treatment methods are at removing cyanobacteria and
cyanotoxins(122). Unfortunately, data on the presence or absence of cyanotoxins in finished drinking water are limited because there is no centralized monitoring program(122).
32
collected(124). In more recent years, there has been a noticeable increase in the severity of cyanobacterial harmful algal blooms in Lake Erie, a drinking water source for many
communities(123). Based on agricultural and meteorological trends that triggered a massive bloom in 2011, scientists predicted that, without any changes to mitigate future projections, nuisance algal blooms would only become more common(3). As predicted, in the summer of 2014, microcystin concentrations were particularly severe in Western Lake Erie(2). In fact, microcystin levels in fully treated tap water were detected at almost three times the WHO limit of 1 µg/L(2). The immediate impact was that over 500,000 residents in and around Toledo, Ohio were warned not to use their water(2, 122). The Toledo event brought national attention to the threat of algal toxins in public water supplies(125). In New York, two municipal systems that draw water from Owasco Lake in the Finger Lakes region began collecting samples for toxin testing after the Toledo event(125). In September 2016, microcystins were detected at low levels (≤0.18 µg/L) in both water systems, first in the untreated water and then in the finished water(125). This incident marked the first time algal toxins have ever been found in treated public drinking water in the state of New York(125).
Drinking water systems that use surface water sources (e.g., lakes, reservoirs) are vulnerable to harmful algal blooms(126). In fact, the lakes and reservoirs that supply drinking water to an estimated 30 to 48 million Americans may sometimes be contaminated by algal toxins(4, 126). Despite this, there are currently no U.S. federal water quality criteria or
33
toxicological, epidemiology and occurrence studies, cyanotoxins, including anatoxin-a,
cylindrospermopsin, and microcystin-LR, were included on the third CCL in 2009 and also on the draft of the fourth CCL in 2015(111, 122). Although the EPA has yet to establish any drinking water standards, they developed health advisories (non-regulatory) for the cyanobacterial toxins microcystins and cylindrospermopsin in 2015(122, 127, 128). Specifically, the EPA recommended that 1) young children and people with preexisting health conditions should not consume water containing more than 0.3 μg/L for microcystins or 0.7 μg/L for
cylindrospermopsin; and 2) older children and healthy adults should not consume more than 1.6 μg/L for microcystins and 3.0 μg/L for cylindrospermopsin (122, 127). Other cyanotoxins, such as saxitoxins and anatoxin-a(S), that also occur in U.S. drinking water sources were not directly addressed(111, 122). Also, the International Agency for Research in Cancer considers Microcystin-LR to be a possible human carcinogen (Group 2B) based on some evidence that it may act as a tumor promoter(112, 115). According to the EPA, however, there is insufficient data to assess carcinogenic potential of microcystins in humans due to limitations in the few available human studies (i.e., potential co-exposure to other contaminants) and lack of long-term animal studies evaluating cancer following oral exposure(112).
34
based on the provisional WHO guideline value of 2,000 cyanobacterial cells/mL for drinking water or 1 μg/L of microcystin-LR(33, 122).
Table 1. International drinking water guidelines for microcystins.
Country Guideline Value
Brazil, China, Czech Republic, Denmark, Finland, France, Germany, Italy, Japan, Korea, Netherlands, Norway, New Zealand, Poland, South Africa, and Spain
1.0 μg/L microcystin-LR
Australia 1.3 μg/L microcystin-LR
(toxicity equivalents)
Canada 1.5 μg/L microcystin-LR
Table 2. U.S. state drinking water guidelines for microcystins. State Guideline Value
Minnesota 0.04 µg/L microcystin-LR Ohio 1 µg/L microcystin Oregon 1 µg/L microcystin-LR
Harmful Algae and Illness
Human exposure to cyanobacteria and cyanotoxins can occur through direct contact, inhalation of contaminated water droplets (e.g., while showering or during recreational activities), and ingestion (e.g., drinking contaminated water, consuming tainted fish or
shellfish)(110, 111). In the U.S., recreational activities during freshwater harmful algal blooms have been associated with waterborne disease outbreaks that include dermatologic,
35
458 suspected or confirmed human illnesses and 175 animal morbidity and mortality cases were reported as being associated with bloom events during 2007-2011(134). The data in HABISS, however, only reflects recreational exposures for humans and domestic pets(134). When public drinking water systems are contaminated with harmful algae, there can be a substantial public health impact as large numbers of people may be exposed and become ill(134, 135). Drinking water exposure to harmful cyanobacteria can lead to symptoms of illness, both chronic (e.g., liver and kidney damage) and acute (e.g., gastroenteritis, muscle pain and dermatitis)(116, 133, 135). Toxic cyanobacterial blooms have been associated with human and animal illness in at least 43 states(136). Figure 7 shows the distribution of reports and events related to such blooms. In August 2016, at least 19 states had public health advisories because of cyanobacterial harmful algal blooms(136).
Figure 7: Cyanobacterial harmful algal blooms in the United States. Source: https://www.usgs.gov/media/images/national-status-cyanohabs-august-2016
36
37
the authors suggested a need for further investigation(140). Gastrointestinal illness has been a common outcome in studies of cyanobacteria exposure via drinking water ingestion and
accidental recreational intake(141). While acute toxicity is the most evident problem in cyanobacterial poisoning, there may also be chronic effects(115, 133). As mentioned earlier, there is some evidence suggesting Microcystin-LR may act as a tumor promoter and the International Agency for Research in Cancer considers it to be a possible human carcinogen (Group 2B)(112, 115). Human studies and long-term animal studies, however, are limited(112). Human studies suggesting a link between cyanobacteria and malignant disease come primarily from the southeast coastal area of China, where ponds and ditches that serve as drinking water regularly suffer from intense cyanobacterial blooms(115, 133). A few epidemiologic studies have suggested that populations obtaining water from ponds and ditches have a much higher incidence of primary liver cancer than those using river or well water(115, 133).
38
effects of different cyanotoxins (e.g., microcystins, saxitoxin, anatoxin-a, cylindrospermopsin) have been observed in fish embryos and mouse models, the impact on human development has not been established(143).
Globally, cyanotoxins have been detected in raw and finished waters and direct
ingestion of contaminated drinking water is a common route of exposure(144). Increased risks to human illness have been linked to the ingestion of high levels of cyanotoxin in water;
however, the effect of chronic low levels not well-documented or understood(144). There are challenges to addressing the potential public health impacts because the risks associated with exposure vary across organisms, toxins, and routes of exposure(134). As noted by Hudnell (2010), the least characterized risks are perhaps those from repeated, low-level, multi-route exposures to cyanotoxins in surface and drinking waters(128).
Water Treatment for Harmful Algae
The management of cyanobacterial blooms in surface water is complex. In order to protect consumers from exposure, the primary management objectives are to prevent, monitor, and, if necessary, remove cyanobacteria and their toxins(119). Preventing the
occurrence of algal blooms involves the control and management of nutrients from outside and from within the lake or reservoir(119). Monitoring involves the routine counting and
39
sediments(115, 119). In order to avoid these negative consequences, algaecides should only be used under very specific conditions(115). In essence, there are no simple restorative measures once a bloom occurs in surface water(119).
Research on cyanotoxin removal is ongoing(123). While certain drinking water treatment processes can remove cyanobacterial toxins, their efficacy range from 60% to 99.9%(4). An ineffective treatment method not only compromises water quality, but it can also bring about severe treatment disruption or treatment plant shutdown(4). Factors that impact cyanotoxin removal include the cyanobacterial species and cell density, coagulant type and dose, pH, natural organic material, and operational parameters such as flocculation time, frequency of filter backwashing and clarifier sludge removal(122, 145). Existing operations working to address cyanotoxins are modifying the locations where treatment chemicals are applied, the types and concentrations of chemicals applied, and the pH at which the processes are operated(123). Recent research has focused on the impacts of pH and hydrogen peroxide addition on ozone contactor efficiency(123). While chlorination has demonstrated some potential in treating microcystins during oxidation and disinfection processes, chlorine-based processes (chlorine, chloramines and chlorine dioxide) have not been found to successfully treat other cyanotoxins (e.g., anatoxin-a)(146, 147).
Water treatment processes are typically based on either the retention or degradation of contaminants(119). Retention-based treatments include
40
generally require more regular maintenance (e.g., cleaning procedures, backflushing,
replacement of activated carbon and membranes), degradation-based treatments may produce potentially harmful by-products (e.g., trihalomethanes)(119).
Although intracellular microcystins make up the majority of the total microcystin
concentration in source water, extracellular microcystins (either dissolved in water or bound to other materials) still make up a portion (<30%)(122). Therefore, it is essential that treatment processes consider the presence of both intracellular and extracellular microcystins(122). In the absence of cell damage, conventional water treatment (e.g., coagulation, flocculation, sedimentation, rapid granular filtration) can be effective at removing intact cells and the
majority of intracellular toxins(122). In fact, 60 to 95% of cells and intracellular microcystins can be removed during sedimentation and up to 99.9% can be removed through filtration(122). If toxins are released into the water, however, conventional treatments need additional
processes such as chemical oxidation, adsorption, biodegradation or reverse osmosis, and nanofiltration(122). Studies have suggested that conventional drinking water treatment followed by oxidation or activated carbon may remove both intracellular and extracellular microcystins up to 99.99% of total microcystins to achieve concentrations below 0.1 μg/L in treated water(122).
41
water treatment process(148). Since ozone will oxidize most organic materials in the water, its concentration must be above the ozone demand of the organic material in the raw water(116, 148). Combining ozonation and chlorination can successfully remove the most common extracellular toxins(119).
Although effective at oxidizing extracellular microcystins, chemical oxidation using chlorine, potassium permanganate, or ozonation can also impair cell integrity(122). Impaired cell integrity can lead to cell lysis, which would subsequently increase the concentrations of extracellular microcystins(122). One solution to this is to simply apply a conventional (or alternative) filtration process first to remove the majority of intact cells(122). As expected, the removal efficiency of filtration depends on the size of the filter’s pores(122). In general, microfiltration (0.1–10 μm) and ultrafiltration (1–100 nm) membranes can remove both cyanobacterial cells and intracellular microcystins(122). For the removal of extracellular microcystins, however, ultrafiltration is inconsistent (35 to 70% removal) and microfiltration is ineffective(122). On the other hand, nanofiltration (around 1 nm) and reverse osmosis
membranes (0.1 nm) can effectively remove intracellular and extracellular microcystins (82 to 100% removal)(119, 122).
42
Table 3. Cyanotoxin treatment processes and relative effectiveness.
Treatment Process Relative Effectiveness
Intracellular Cyanotoxins Removal (Intact Cells)
Pre-treatment oxidation Oxidation often lyses cyanobacteria cells releasing the cyanotoxin to the water column. If oxidation is required to meet other treatment objectives, consider using lower doses of an oxidant less likely to lyse cells (potassium permanganate). If oxidation at higher doses must be used, sufficiently high doses should be used to not only lyse cells but also destroy total toxins present (see extracellular cyanotoxin removal). Coagulation/Sedimentation/
Filtration
Effective for the removal of intracellular toxins when cells accumulated in sludge are isolated from the plant and the sludge is not returned to the supply after sludge separation.
Membranes Study data are limited; it is assumed that membranes would be effective for removal of intracellular cyanotoxins. Microfiltration and ultrafiltration are effective when cells are not allowed to accumulate on membranes for long periods of time. Can clog and form biofilms. Flotation Flotation processes, such as Dissolved Air Flotation (DAF), are effective
for removal of intracellular cyanotoxins since many of the toxin-forming cyanobacteria are buoyant.
Extracellular Cyanotoxins Removal (Dissolved)
Membranes Depends on the material, membrane pore size distribution, and water quality. Nanofiltration is generally effective in removing extracellular microcystin. Reverse osmosis filtration is generally applicable for removal of extracellular microcystin and cylindrospermopsin. Cell lysis is highly likely. Further research is needed to characterize performance. Potassium Permanganate Effective for oxidizing microcystins and anatoxins. Further research is
needed for cylindrospermopsin.
Ozone Very effective for oxidizing extracellular microcystin, anatoxin-a, and cylindrospermopsin.
Chloramines Not effective.
Chlorine dioxide Not effective with doses used in drinking water treatment. Chlorination Effective for oxidizing extracellular cyanotoxins as long as the pH is
below 8; ineffective for anatoxin-a.
Ultraviolet Radiation Effective at degrading microcystin and cylindrospermopsin but at impractically high doses.
Activated Carbon Powdered activated carbon (PAC): Effectiveness varies highly based on type of carbon and pore size. Wood-based activated carbons are generally the most effective at microcystin adsorption. Carbon is not as effective at adsorbing saxitoxin or taste and odor compounds. Doses in excess of 20mg/L may be needed for complete toxin removal.
Granular activated carbon (GAC): Effective for microcystin but less effective for anatoxin-a and cylindrospermopsins.
43 Aim 2 Background: Drinking Water Distribution Systems
After the treatment of water, public water systems rely on a distribution system made up of a complex, interconnected series of pipes, storage facilities, pumps, and valves to
transport drinking water from the water source or treatment plant to the consumer (see Figure 8)(6, 149). A water main is any pipe that distributes potable water to more than one
property(150). From a main, water reaches an individual property through a service line(150). Aside from providing an uninterrupted supply of pressurized safe drinking water to all
consumers, distribution systems also deliver fire protection needs to facilities such as homes, schools, hospitals, and businesses(149). Based on surveys of water utilities, there are about 1 million miles of piping, 24,000 storage tanks, 6.8 million fire hydrants, 69.5 million service lines, and 14.6 million valves in the U.S.(6, 151). According to a study of utilities across the U.S. and Canada, 264 people are served per 1 mile of pipe regardless of utility size(152). Public water systems in the U.S. produce 34 billion gallons of drinking water each day, over half of which is used by residential customers(6). Although the majority (>80%) of water used by residential customers is used for activities other than human consumption (e.g., sanitary service,
44
Figure 8: Drinking water distribution system.
Source: https://www.epa.gov/dwsixyearreview/drinking-water-distribution-systems
Ideally, the quality of treated water from the time it leaves the treatment plant until the time it is consumed should not change(6). In reality, however, complex physical, chemical, and biological reactions can cause substantial changes in water quality during distribution(6). Thus, distribution systems are a potential source of contamination that can lead to waterborne disease outbreaks(6).
Most drinking water regulations focus on water quality standards at the treatment plant and not within the distribution system(6). The few rules under SDWA that address the
degradation of distribution system water quality include the Lead and Copper Rule, the Surface Water Treatment Rule, the Total Coliform Rule, and the Disinfectants/Disinfection By-Products Rule(6). These rules focus on measurements taken within the distribution system and in tap water samples(6). In addition, there are a number of state regulations and plumbing codes that influence distribution system water quality, from requirements for design, construction,
45
Regardless, regulations only address certain aspects of distribution system water quality rather than the integrity of the entire distribution system(6).
Unplanned Disruptions in Distribution
Due in part to the EPA regulations governing public water systems using surface water, waterborne disease outbreaks associated with untreated surface water systems have declined since 1971, with none reported between 1991 and 2002(153). Also, treatment deficiencies, such as inadequate filtration of surface water, have declined over the years(153). Instead, disruptions in the distribution infrastructure have become the main culprit of waterborne disease outbreaks in recent years(153). During 2001-2002, these disruptions were responsible for over half of all waterborne disease outbreaks(153).