THE DEVELOPMENT AND INFLUENCE OF VISUAL HIERARCHICAL PROCESSING STYLES
Jennifer Nicolette Gibson
A dissertation submitted to the faculty of the University of North Carolina at Chapel Hill in partial fulfillment of the requirements for the degree of Doctor of Philosophy in the Department of Psychology.
Chapel Hill 2012
Approved by:
ABSTRACT
JENNIFER GIBSON: The Development and Influence of Visual Hierarchical Processing Styles
(Under the direction of Dr. J. Steven Reznick)
Perceptual and cognitive processing styles are human tendencies to perceive the world in specific and predictable ways. One such processing style commonly observed among typical adults is the “global bias.” When viewing hierarchical information, or information with at least one global or “whole” and one local or “part” quality, typical adults are usually faster at processing global information and are easily distracted by the global information if it conflicts with the local. Conversely, individuals with autism spectrum disorders (ASD) appear to lack the typical global bias and tend to demonstrate either no bias or a local bias. Researchers are currently working to understand how the typical adult global bias emerges and the consequences that different hierarchical
processing styles may have on perceptual input and behavioral output among typical and atypical populations. This dissertation makes advances in the understanding of the typical developmental trajectory of the global bias, the generalizability of processing styles, and relations between processing styles and object exploration and play during the second six months of life. Infants aged 6, 9, and 12 months participated in a
cross-sectional, multi-method study including a visual familiarization task, manual
iii
DEDICATION
v
ACKNOWLEDGEMENTS
More than anything, I want to say thank you to the phenomenal individuals at the University of North Carolina at Chapel Hill who have become my friends, family, teachers, and mentors. First, I owe many thanks to my doctoral advisor, Dr. J. Steven Reznick, who has been an incredible mentor and teacher to me each and every day. I also owe many thanks to Dr. Amy Needham, who mentored me at Duke University and introduced me to my current research path. Second, many thanks to my dissertation committee: Dr. J. Steven Reznick, Dr. Carol Cheatham, Dr. Barbara Goldman, Dr. Mark Hollins, and Dr. Peter Ornstein. I cannot begin to express how they have each played a crucial role in my graduate training and dissertation, but I know they have undoubtedly helped me become the student, teacher, and research that I am today. Third, I would like to thank my research assistants for their hard work, support, and dedication: Joshua Chen, Galen Cook, Monica Ferenz, Allison Isaacson, Sydney Jones, Celenia Lonsinger,
TABLE OF CONTENTS
LIST OF TABLES………...viii
LIST OF FIGURES………....ix
Chapter 1. INTRODUCTION………...…1
Aim 1: To clarify the pattern of typical visual hierarchical processing styles demonstrated by infants from 6 to 12 months of age….………...5
Aim 2: To understand if infants will demonstrate the same hierarchical information processing styles in a more naturalistic setting………6
Aim 3: To explore the relation between hierarchical information processing styles and object exploration behaviors……….7
2. METHODS………..8
Participants………...8
Visual Familiarization Task……….9
Change Detection Task………..12
Manual Familiarization Task……….13
Sequential Touching Task………..16
Play Exploration Task………17
Data Coding………...18
3. RESULTS………..21
Visual Familiarization Task………...21
vii
Manual Familiarization Task……….27
Sequential Touching Task………..39
Play Exploration Task………40
4. DISCUSSION………45
5. CONCLUSION………..52
LIST OF TABLES Table
1. Description of participants for each task………..……….…9 2. Description of participants for the visual familiarization task………..……...21 3. Percentage of looking time during the familiarization trials for
the visual familiarization task……….……….22 4. Description of participants for the change detection task………...…….24 5. Description of participants for the manual familiarization task………...……27 6. Percentage of looking time during the familiarization trials for
the manual familiarization task………...…….29 7. Percentage of manual interaction time during the familiarization
ix
LIST OF FIGURES Figure
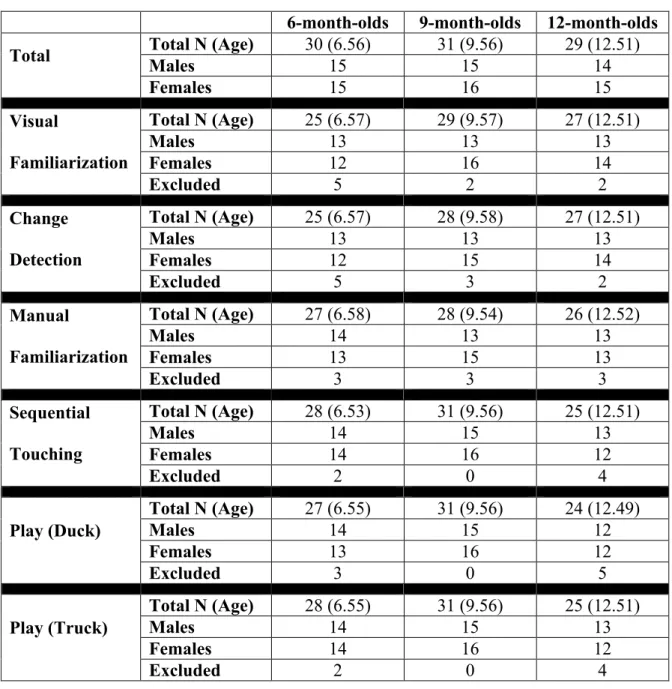
1. Visual familiarization design and stimuli example………..…....11
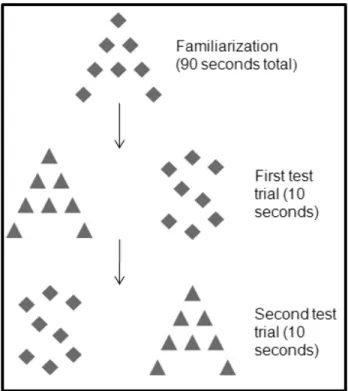
2. Manual familiarization design and stimuli example…………..………..15
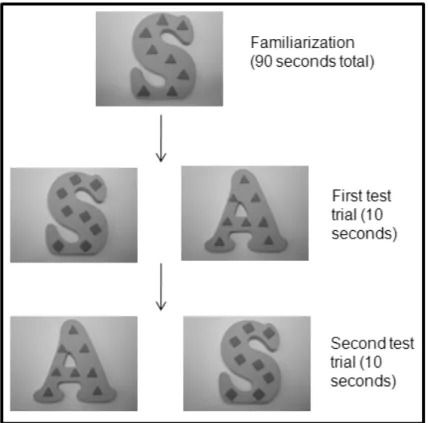
3. Sequential touching stimuli………..………17
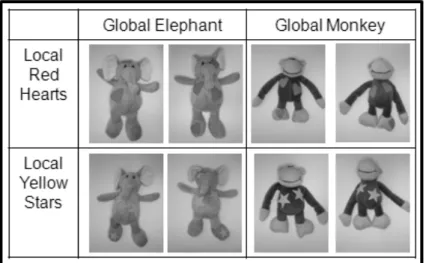
4. Free-play stimuli………..………18
5. Proportion of looking time at the globally and locally changed stimuli during the visual familiarization test trials………..…....23
6. Distribution of the proportion of looking time at the globally changed stimulus during the visual familiarization test trials………..24
7. Proportion of looking time at the changing and unchanging stimulus streams during the change detection task…….………..……...26
8. Distribution of the proportion of looking time at the changing stream during the change detection task………..………...…….26
9. Proportion of looking time (a), manual interaction (b) and attention (c) towards the globally and locally changed stimuli during the manual familiarization test trials………...…..34
10.Distribution of the proportion of looking time (a), manual interaction (b), or attention (c) towards the globally changed stimulus during the manual familiarization test trials…………..………35
CHAPTER 1
INTRODUCTION
The human perceptual system is a seamless integration of sensation and attention, allowing our mind to develop coherent representations of the world around us. We are able to make sense of objects by parsing elements and binding them together to create complicated visual scenes (Colombo, 2001; Bhatt & Quinn, 2011). An especially sophisticated property of visual perception is our ability to understand everything we see as both whole entities as well as constituent features. For example, a flower is not only a whole flower but also an arrangement of petals, leaves, and a stem. The ability to process such hierarchical information, or information that contains at least one “whole” and one “part” property, efficiently and effectively is essential due to the prevalence of
hierarchical information in our perceptual world.
2
argue that the whole is greater than the summation of the elements that create it, carrying its own meaning and properties in addition to the meaning and properties of the elements. Only once the whole has been processed can the individual make sense of the smaller pieces.
Previous research has consistently demonstrated that typically developing adults process visual hierarchical information with a “global bias.” Adults are usually faster at responding to global properties, and information at the global level can interfere with processing of local properties if the two levels are incongruent (Navon, 1977; Navon, 1981; Neiworth, Gleichman, Olinick, & Lamp, 2006).
The global bias, however, does not appear to be universal among adults. Growing evidence suggests that individuals with autism spectrum disorders (ASD) do not process hierarchical information with the typical global bias processing style. Rather, it appears that individuals with ASD process hierarchical information with either a) no visual bias, demonstrated by equal responses to local and global information (enhanced perceptual function theory, Mottron, Dawson, Soulières, Hubert, & Burack, 2006), or b) a “local bias” (weak central coherence theory, Frith & Happé, 1994; Happé & Frith, 2006). An abundance of previous research has demonstrated the atypical lack of a global bias among individuals with ASD (e.g., Bölte, Holtman, Poustka, Scheurich, & Schmidt, 2007; Booth, Charlton, Hughes, & Happé, 2003; Jolliffe & Baron-Cohen, 1997; Mottron & Belleville, 1993; Mottron, Belleville, & Ménard, 1999; Scherf, Luna, Kimchi,
Minshew, & Behrmann, 2008).
about the development of hierarchical processing styles or the consequences that a processing style may have on daily perception, cognition, or behavior. Therefore, although it is clear that differences in processing styles exist among typically developing adults and individuals with ASD, very little is understood about these differences, how they emerge, why they exist, or how they may affect downstream cognition and behavior, including the manifestation of clinical symptoms among individuals with ASD.
The developmental trajectories of hierarchical processing styles among typically developing adults and individuals with ASD are unknown. Concerning typical
development, most researchers suggest that hierarchical information processing styles transition from local- to global-biased during the first year of life, depending on stimuli complexity (Cohen, 1998; Cohen & Cashon, 2001; Colombo, 2001; Schwarzer, et al., 2007; Younger & Cohen, 1986). Other researchers have suggested that infants are
global-biased from birth (Macchi Cassia, Simion, Milani, & Umiltà, 2002) or, in contrast, that a local bias in infancy persists into childhood or adolescence before transitioning to the typical adult global bias (Elkind, Koegler, & Go, 1964; Neiworth, et al., 2006; Poirel, Mellet, Houdé, & Pineau, 2008; Porporino, Shore, Iarocci, & Burack, 2004; Scherf, Behrmann, Kimchi, & Luna, 2009). Concerning atypical development among individuals with ASD, it remains unclear when, how, or why the development of hierarchical
information processing styles begin to differ from typically developing peers. An understanding of atypical development will continue to be difficult until the
developmental trajectory of typical development is clarified as a platform for comparison. Similarly unclear is the generalizability of visual hierarchical information
4
by Mottron and colleagues (2000) has demonstrated that the atypical hierarchical
processing styles demonstrated by individuals with ASD are also evident in the auditory modality. Individuals with ASD demonstrated typical global processing but superior local processing compared to peers when listening to musical melodies (Mottron, Peretz, & Ménard, 2000). However, a thorough literature scan suggests that no previous research has addressed the generalizability of an individual’s visual hierarchical processing style to other exploratory modalities or naturalistic settings, such as the processing of
hierarchical objects. Therefore, it remains unclear if visual hierarchical processing styles are isolated phenomena specific to the visual system when viewing images or if they represent a more global perceptual or cognitive processing style. This distinction could have significant impacts on the construction of broader perceptions and related
behavioral responses.
By extension, it is unclear what broader consequences may result from having a particular hierarchical processing style. Theoretical discussions of ASD have suggested that atypical hierarchical processing styles may be related to the expression of phenotypic diagnostic symptoms as well as savant talents exhibited by individuals with ASD (Happé, 1999; Happé & Frith, 2006; Happé & Booth, 2008; Mottron, et al., 2006). Similarly, it is likely that hierarchical processing styles may influence typical infant behaviors, such as object exploration and play. Support for this hypothesis comes from research
Because much of the research literature suggests that the infant visual processing style is transitioning from local to global visual processing at this time, it is not unreasonable to suggest that the transition from individual object and detail exploration to global object integration may also be related to the visual processing transition. Additionally, previous research has demonstrated that infants at high-risk for ASD employ atypical visual strategies compared to low-risk peers when inspecting and exploring objects, including long fixations towards one object (greater than 10 seconds), examining objects from odd or unusual angles, squinting during object examination, or blinking excessively during object examination (Mottron, Mineau, Martel, St-Charles Bernier, Berthiaume, Dawson, Lemay, Palardy, Charman, & Faubert, 2007; Ozonoff, Macari, Young, Goldring,
Thompson, & Rogers, 2008). Despite supporting evidence, a thorough scan of the published literature reveals no research that has explicitly correlated an infant’s demonstrated hierarchical processing style with object exploration behaviors.
I conducted my dissertation to better understand the developmental trajectory and generalizability of visual hierarchical information processing styles as well as the relation between processing styles and object exploration. To achieve this goal, I addressed three specific aims.
Aim 1: To clarify the pattern of typical visual hierarchical processing styles demonstrated by infants from 6 to 12 months of age.
Research findings on how the developmental trajectory of hierarchical
6
Spelke, 1983; Quinn, Brown, & Streppa, 1997; Quinn, Burke, & Rush, 1993; Slater, Johnson, Brown, & Badenoch, 1996; Van Giffen & Haith, 1984). My dissertation focuses on the saliency of global versus local information to an infant during the formation of his or her mental representation. Aim 1 is achieved using a visual familiarization task with hierarchical visual images.
Based on previous research, I hypothesized that the 6-month-olds would show a bias for the local property of the familiarization stimuli and that the 12-month-olds would show a bias for the global property of the familiarization stimuli. I expected that the 9-month-olds would show a pattern that is transitional between the 6- and 12-month-old groups. Specifically, some 9-month-olds would show a local bias while others would have started the transition to a global bias. Therefore as a group, the bias would either be weak in one direction or possibly not evident. These results would support previous findings that infants transition from a local bias to a global bias during their first year of life (e.g., Younger & Cohen, 1986).
Aim 2: To understand if infants will demonstrate the same hierarchical information processing styles in a more naturalistic situation.
an infant on a visual familiarization task and the processing style demonstrated by that infant on a manual familiarization task.
Although there is no previous research from which to base a hypothesis, I
expected that the infants would show the same hierarchical processing style in the visual and manual familiarization tasks, both at the individual and group levels. Therefore, I expected that the 6-month-olds would show a bias for the local property of the
familiarization stimuli, the 12-month-olds would show a bias for the global property of the familiarization stimuli, and the 9-month-olds would show a transitional pattern of biases for the local or global property of the familiarization stimuli.
Aim 3: To explore the relation between hierarchical information processing styles and object exploration behaviors.
Previous theories have suggested that atypical hierarchical information processing styles could play a role in the development of diagnostic symptoms exhibited by
individuals with ASD (Happé, 1999; Happé & Frith, 2006; Happé & Booth, 2008; Mottron, et al., 2006). However, I am not aware of any previous research that has
evaluated the relation between processing style and behavioral output. To address aim 3, I included an exploratory component to evaluate possible correlations between
hierarchical processing styles and infant object exploration.
CHAPTER 2
METHODS Participants
A total of 90 healthy, full-term infants aged 6, 9, and 12 months from central North Carolina were included in this study (80% White, 13% multiple races, 3% Asian, 2% Black/African-American, 1% Hispanic/Latino). An additional 11 infants
Table 1: Description of Participants for Each Task
6-month-olds 9-month-olds 12-month-olds
Total Total N (Age) Males 30 (6.56) 15 31 (9.56) 15 29 (12.51) 14
Females 15 16 15
Visual
Familiarization
Total N (Age) 25 (6.57) 29 (9.57) 27 (12.51)
Males 13 13 13
Females 12 16 14
Excluded 5 2 2
Change
Detection
Total N (Age) 25 (6.57) 28 (9.58) 27 (12.51)
Males 13 13 13
Females 12 15 14
Excluded 5 3 2
Manual
Familiarization
Total N (Age) 27 (6.58) 28 (9.54) 26 (12.52)
Males 14 13 13
Females 13 15 13
Excluded 3 3 3
Sequential
Touching
Total N (Age) 28 (6.53) 31 (9.56) 25 (12.51)
Males 14 15 13
Females 14 16 12
Excluded 2 0 4
Play (Duck)
Total N (Age) 27 (6.55) 31 (9.56) 24 (12.49)
Males 14 15 12
Females 13 16 12
Excluded 3 0 5
Play (Truck)
Total N (Age) 28 (6.55) 31 (9.56) 25 (12.51)
Males 14 15 13
Females 14 16 12
Excluded 2 0 4
Visual Familiarization Task
10
monitor using Habit X software (Cohen, Atkinson, & Chaput, 2000) that was controlled by the experimenter.
The infant viewed a navy hierarchical local-global pairing of one of the following randomly assigned images: an S made of local triangles, an S made of local diamonds, an A made of local triangles, or an A made of local diamonds (see Figure 1). The same image was presented 6 times for 15 seconds, totaling 90 seconds of exposure to the familiarization stimulus. After the familiarization period, the infants viewed a paired-choice of two test stimuli. One of the test stimuli was identical to the familiarization stimulus at the global level but different at the local. The other test stimulus was
Figure 1: Visual Familiarization Design and Stimuli Example
The global A and S familiarization images were approximately 12 cm high and 12.7 cm or 9 cm wide, respectively. The local diamond and triangle images were approximately 1.25 cm high and 1.25 cm wide. The total familiarization display
subtended approximately 12° horizontal and either 12° (A) or 9° (S) vertical visual angle from the infant’s viewpoint. Each of the elements subtended approximately 1.2°
horizontal and 1.2° vertical visual angle. The test stimuli consisted of the same images, sized approximately 12 cm high and either 12.7 cm (A) or 9 cm (S) wide, made of diamonds and triangles approximately 1.25 cm high and 1.25 cm wide separated by a distance of 9 cm. The entire test display subtended approximately 28° horizontal and 12° vertical visual angle from the infant’s viewpoint. Similar familiarization designs have been utilized with success in previous visual change detection and hierarchical processing research (e.g., Colombo, Freeseman, Coldren, & Frick, 1995; Quinn, Bhatt, Brush,
12 Change Detection Task
The visual acuity of infants aged 6 to 12 months of age is believed to be fairly stable and, on average, somewhere between 20/20 and 20/100 (Dobson & Teller, 1978; Mayer & Dobson, 1982; McDonald, Dobson, Sebris, Baitch, Varner, & Teller, 1985; Sokol, 1978). Following the definition of 20/20, a person with 20/20 visual acuity has a minimum angle of resolution of 1 arcminute or 1/60° at approximately 6 m, and a person with 20/100 visual acuity has a minimum angle of resolution of 5 arcminutes or 5/60° at approximately 6 m (Holladay, 1997). Therefore, an infant with visual acuity somewhere between 20/20 and 20/100 should have a minimum angle of resolution between 0.02° and 0.08° in the present configuration in which the infant is approximately 60 cm from the presented stimulus. Accordingly, the 6- to 12-month-old infants should easily be able to detect, parse, and accurately perceive each of the local elements that subtend a minimum angle of 1.2°, which is much larger than the size that is necessary for the worst predicted visual acuity.
To verify that the stimuli were appropriate given infant visual acuity, the infants also participated in a change detection task immediately following the visual
familiarization task. The infants viewed two simultaneous streams of visual information for approximately 20 seconds. In one visual stream, the stimulus was a repeated,
unchanging diamond. In the second visual stream, the stimuli were repetitions of
The images were identical to the local elements of the visual familiarization task, sized approximately 1.25 cm high and 1.25 cm wide and subtending approximately 1.2° horizontal and 1.2° vertical visual angle. The visual streams were separated by 28.5 cm and subtended a total visual angle of 27° horizontal and 1.2° vertical.
Manual Familiarization Task
To explore the generalizability of a local or global processing style to a
naturalistic setting, the infants also participated in a manual familiarization paradigm. The infant sat on his or her parent’s or family member’s lap close to a table in a position that allowed the infant to easily reach for and play with objects on the table. The
experimenter sat across from the infant at a distance of approximately 75 cm. The infant was given one of the following hierarchical local-global objects: an S made of local triangles, an S made of local diamonds, an A made of local triangles, or an A made of local diamonds (see Figure 2). The selected object differed from the image that the infant viewed in the visual familiarization task in both the global and local properties. For example, if the infant viewed an A made of local squares in the visual familiarization task (as in Figure 1), he or she was given an S made of local triangles in the manual
14
global level (Figure 2). Because infants in this age range typically show a preference for novel stimuli, it was expected that the infant would attend to the novel stimulus at test. As with the visual familiarization task, the test trials paired the novelty of a local change with the novelty of a global change and, based on the infant’s novelty preference, was used to estimate which change was the most salient. The change that the infant attended to most during the test trials was assumed to reflect the aspect of the stimulus that the infant found most salient during familiarization, which made the change at test in that level the more novel change. The test stimuli were given to the infant twice for 10 seconds, counterbalancing the sides. The familiarization and test stimuli objects were placed within the infant’s reach and were equally accessible. Similar object
familiarization designs with longer durations and sequential test trials have been utilized with success in previous categorization and attention studies (Oakes, Madole, & Cohen, 1991; Oakes & Tellinghuisen, 1994). The present version of the task was altered slightly to match the visual familiarization paradigm more exactly and to allow for more direct comparisons between the preference results elicited by the two similar tasks.
The global A and S familiarization objects were made of light foam material and thus were ideal for easy grasping, lifting, and manipulation. Because successful reaching and grasping typically begins around 4 months of age (von Hofsten, 1969), it was
Figure 2: Manual Familiarization Design and Stimuli Example
The global familiarization objects were approximately 12 cm high and either 12.7 cm (A) or 9 cm (S) wide. The local diamond and triangle elements were approximately 1.25 cm in high and 1.25 cm wide. The test stimuli consisted of the same objects, sized approximately 12cm high and either 12.7 cm (A) or 9 cm (S) wide, made of diamonds and triangles approximately 1.25 cm high and 1.25 cm wide, and separated by a distance of approximately 9 cm so that they were equally accessible.
16
immediately returned it to within reaching distance. Given this configuration, the minimum visual angles were approximately equal to or larger than those calculated for the visual familiarization task. Because the visual acuity of infants 6 to 12 months of age is believed to be fairly stable and on average somewhere between 20/20 and 20/100 (as described above), a 6- to 12-month-old infant should have an angle of resolution between 0.02° and 0.08° at 60 cm. Therefore, the infants should easily be able to detect, parse, and accurately perceive each of the local elements that subtend a minimum angle of 1.2°, which is much larger than what is necessary for the worst predicted visual acuity, and the global configurations for both the familiarization and test stimuli.
Sequential Touching Task
During the sequential touching task, the infant remained seated on his or her parent’s or family member’s lap close to a table in a position that allowed the infant to easily reach for and play with objects on the table. The experimenter sat across from the infant at a distance of approximately 75 cm and presented the infant with a tray of eight items. Four of the items shared one global property (four elephants), and four shared a different global property (four monkeys). A different four (two from each global
Lansink, & Merryman; 1996; Rakison & Butterworth, 1998; Starkey, 1981). Although this task may have been less effective for the 6-month-olds due to motor and attention issues, it had great potential to be informative in the 9- and 12-month-old age groups (Starkey, 1981) and was worth conducting as an aspect of object exploration for the 6-month-old age group.
Figure 3: Sequential Touching Stimuli Play Exploration Task
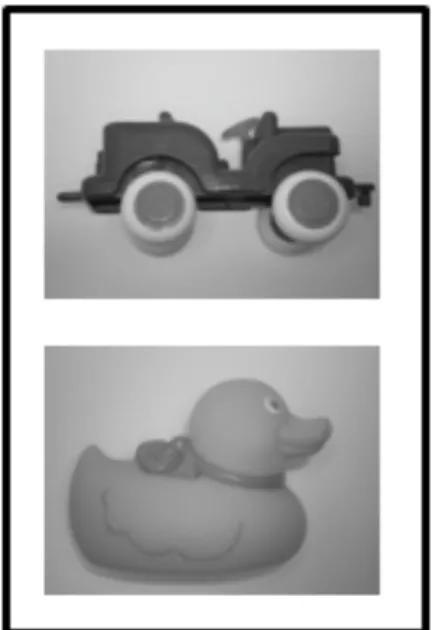
18
that might elicit differential behavior, such as the presence of a face or not (e.g., the duck had a face but the truck did not), the soft texture or hard plastic (e.g., the duck was soft and the truck was hard), and the immobile or mobile local features (e.g., aspects of the duck could not move but the car wheels could rotate). These properties are confounded, but a systematic difference between the free-play stimuli could be interpreted within the context of discovery.
Figure 4: Free-play Stimuli Data Coding
Trained observers coded the video recordings of each task using custom software with 0.2s frames of the video (Libertus, 2008). This software allows coders to progress through the video by looking at still frames from every 0.2 seconds of the task. The coders then mark the variables of interests for each frame. This technique allows coders to proceed through the videos as slowly (or quickly) as necessary and supports a high level of precision.
For all tasks, the observers coded “looking time” at the task stimuli, and the coding software provided summary statistics of the total time spent looking at each stimulus. Looking time was defined as time spent looking at an image based on the infant’s fixation direction during visual familiarization and change detection tasks or looking at an object during the manual familiarization, sequential touching, and play tasks.
For the manual familiarization, sequential touching, and play tasks, the trained observers also used the video recordings and custom software to capture infant manual behavior. The observers coded touching, grasping, mouthing, bimanual interaction, lifting, and fingering. Touching was defined as time spent with the fingers placed on any part of the object. Grasping was defined as time spent with the fingers curled around the object. Mouthing was defined as time spent with the object on or in the mouth or being explored by the tongue. Bimanual interaction was defined as time spent with both hands on one object. Lifting was defined as the amount of time that an object was completely lifted from the table. Fingering was defined as time spent engaging in detailed
20
CHAPTER 3
RESULTS Visual Familiarization Task
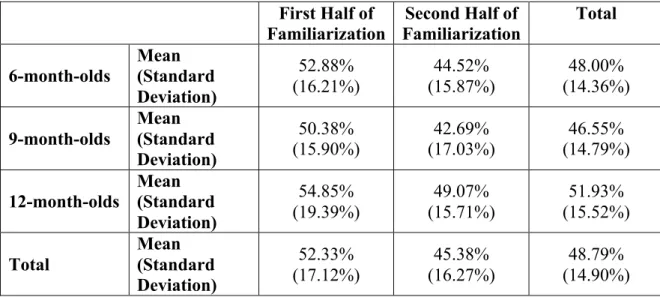
Data from 81 of the 90 participants were used for visual familiarization analyses. Data from the remaining 9 infants were not used due to experimenter error, fussiness, or maternal distraction. Table 2 summarizes the distribution of participants.
Table 2: Description of Participants for the Visual Familiarization Task
6-month-olds 9-month-olds 12-month-olds
Visual
Familiarization
Total N (Age) 25 (6.57) 29 (9.57) 27 (12.51)
Males 13 13 13
Females 12 16 14
Excluded:
Exp. Error 3 1 0
Fussiness 1 1 1
Distraction 1 0 1
21
used in this study for all tasks; however, it is important to keep this conceptual flaw in mind.
All coders were blind to the infant’s familiarization stimulus or the specific locations (left or right) of the presented test stimuli. For the purpose of measurement reliability, a second coder recoded a random subset of a fourth of the videos (25 of 81 videos). A third coder settled discrepancies greater than 20% during the test trials for 6 of the videos, and the original codes from coder 1 or coder 2 that most closely matched coder 3 were used in the final analyses. For two videos, a fourth coder was necessary to settle inconsistencies among the first three coders. In one case, the third and fourth coder matched most closely, and the data from coder 3 was used in the final analyses. In the second case, coder 4 matched most closely with coder 2, and the data from coder 2 was maintained for the final data analyses. Reliability was compared for percentage of looking time at each of the two test stimuli during the duration of the test trials, with reliability defined as the Pearson’s correlation between two different coders. Several individual coders acted as “coder 1” and / or “coder 2” to avoid any systematic errors that could affect the Pearson’s correlation without reflecting coder agreement. The reliability was 84% for the globally changed stimulus and 90% for the locally changed stimulus. These reliability figures were considered to be good considering the technology (webcam) and close spatial proximity of the test stimuli (9 cm).
familiarization period. Percentage of looking time between groups did not differ for the first half of the familiarization trials, the second half of the familiarization trials, the entirety of the familiarization trains, or the decrease in looking time from the first to the second half of the familiarization trials (all F2,78<1.14, p>0.33).
Table 3: Percentage of Looking Time During the Familiarization Trials for the Visual Familiarization Task
First Half of Familiarization
Second Half of Familiarization
Total
6-month-olds Mean (Standard Deviation) 52.88% (16.21%) 44.52% (15.87%) 48.00% (14.36%) 9-month-olds Mean (Standard Deviation) 50.38%
(15.90%) (17.03%) 42.69% (14.79%) 46.55%
12-month-olds Mean (Standard Deviation) 54.85% (19.39%) 49.07% (15.71%) 51.93% (15.52%) Total Mean (Standard Deviation) 52.33% (17.12%) 45.38% (16.27%) 48.79% (14.90%)
No effect of sex was detected for any of the age groups (6-month-olds: F1,23=0.59, p=0.45; 9-month-olds: F1,27=0.17, p=0.69; 12-month-olds: F1,25=0.49, p=0.49) or overall (F1,79=0.13, p=0.72). Similarly, there was no effect of sex on the duration of looking time during the test trials (F1,79=0.41, p=0.52); therefore, males and females were combined for further analyses.
23
looking time, this significance should be of little impact. However, it is a potentially important context to remember when interpreting the results.
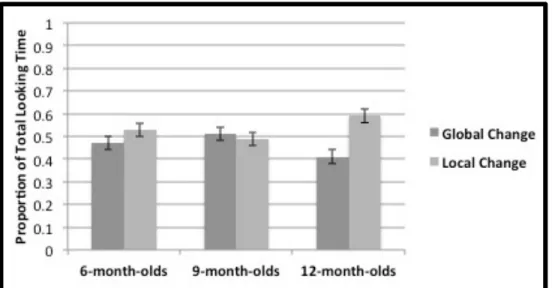
Paired-samples t-tests indicated no preference during the test trials for the 6-month-old (t=-0.91, p=0.37) or 9-6-month-old (t=0.43, p=0.67) infants. In contrast, 12-month-old infants significantly preferred the test stimulus with the changed local elements (t=-3.10, p=0.005).1 Based on the paradigm assumptions, the results indicate that the 12-month-olds, on average, were more likely to have a locally-biased processing style during familiarization, making the local change more saliently novel during test (Figure 5). A distribution of the proportion of looking time at the test stimulus with the changed global element can be seen in Figure 6.
Figure 5: Proportion of Looking Time at the Locally and Globally Changed Stimuli During the Visual Familiarization Test Trials
1 The same analyses were conducted with subsets of the infants, including only infants that demonstrated a decrease in looking between the first and second half of the
familiarization period, excluding infants that showed a 0% or 100% preference for one of the test stimuli, or both. Only the direction of preference was altered for the 9-month-old infants; however, the difference was minimal due to the fact the 9-month-old infants have, on average, nearly no preference. For the 6- and 12-month-olds, neither the
Figure 6: Distribution of the Proportion of Looking Time at the Globally Changed Stimulus During the Visual Familiarization Test Trials
Differences in the proportion of looking time at each of the test stimuli between groups approached significance (F2,78=2.75, p=0.07), and a Tukey’s HSD multiple comparison test suggested that the pattern was largely attributable to the differences between the 9- and 12-month-old averages (p=0.056). These results support the
hypothesis that an important developmental shift in visual hierarchical processing occurs between 9 and 12 months of age.
Change Detection Task
Data from 80 of the 90 participants were used for the change detection analyses. Data from the remaining 10 infants were not used due to experimenter error, fussiness, or maternal / sibling distraction. Table 4 summarizes the distribution of participants.
Table 4: Description of Participants for the Change Detection Task
6-month-olds 9-month-olds 12-month-olds
Change
Detection
Total N (Age) 25 (6.57) 28 (9.58) 27 (12.51)
Males 13 13 13
Females 12 15 14
Excluded:
Experimenter Error 3 1 0
Fussiness 1 1 1
25
The primary variable of interest was the proportion of looking time at each of the two streams of stimuli. Proportion of looking time at each stream was calculated by dividing the infant’s looking time towards each stream by the total looking time during the trial. A second coder recoded a random subset of a fourth of the videos (25 of 80 videos). A third coder settled discrepancies greater than 20% during the test trials for 3 of the videos, and the original codes from coder 1 or coder 2 that most closely matched coder 3 were used in the final analyses. Reliability was compared for percentage of looking time at each of the two streams of stimuli and was 95% for the changing stream and 89% for the unchanging stream.
No effect of sex was detected for any of the age groups (6-month-olds: F1,23=1.80, p=0.19; 9-month-olds: F1,26=0.001, p=0.98; 12-month-olds: F1,25=0.39, p=0.54) or overall (F1,78=0.05, p=0.82); therefore, males and females were combined for further analyses.
Paired-samples t-tests indicated that every age group had a significant preference on average for the changing stimuli stream (Figure 7). Six-month-olds looked
proportionally 70.08% of the time at the changing stream (t=6.41, p=0.000), 9-month-olds looked proportionally 65% of the time at the changing stream (t=4.28, p=0.000), and 12-month-olds looked proportionally 69% of the time at the changing stream (t=5.13, p=0.000).2
In addition, 76 of the 80 infants demonstrated a preference for one of the streams by at least 10%, indicating that they could detect a difference in the two visual streams.
A distribution of the proportion of time spent looking at the changing stream can be seen in Figure 8. Taken together, the group results as well as the individual preferences give strong evidence that the infants could easily detect, parse, and differentiate the local elements of the visual familiarization stimuli.
Figure 7: Proportion of Looking Time at the Changing and Unchanging Stimulus Streams During the Change Detection Task
Figure 8: Distribution of the Proportion of Looking Time at the Changing Stream During the Change Detection Task
27 Manual Familiarization Task
Data from 81 of the 90 participants were used for manual familiarization analyses. Data from the remaining 9 infants were not used due to experimenter error or equipment failure. Table 5 summarizes the distribution of participants.
Table 5: Description of Participants for the Manual Familiarization Task
6-month-olds 9-month-olds 12-month-olds
Manual
Familiarization
Total N (Age) 27 (6.58) 28 (9.54) 26 (12.52)
Males 14 13 13
Females 13 15 13
Excluded:
Exp. Error 3 3 1
Equip. Failure 0 0 2
The primary variables of interest were the percentage of looking and manual interaction time during the familiarization period as well as the proportion of looking and manual interaction time towards each of the two test stimuli during the test trials. Manual interaction included time spent touching, grasping, mouthing, lifting, bimanual
test is a valid response, especially if the infant demonstrates the ability to manually interact during familiarization. Finally, a third variable was created for the test trial stimuli consisting of the sum of looking and manual interaction time for one test stimulus divided by the total amount of time the infant looked at or manually interacted with the test stimuli. In this way, a variable indicating the proportion of attention, considering both visual and manual attention, was created for each test stimulus. This variable may be a better indicator of preference because it takes into account the shift from manual (and oral) exploration to visual exploration as the infant ages across the first year.
A second coder recoded a random subset of a fourth of the videos (20 of 81 videos). Reliability was compared for percentage of looking and percentage of manual interaction towards each of the test stimuli during the duration of the test trials. For looking time, reliability was 82% for the globally changed stimulus and 93% for the locally changed stimulus, and for manual interaction, reliability was 98% for the globally changed stimulus and 99.8% for the locally changed stimulus. These reliability figures are considered to be good considering the distance of the camera for the visual codes.
29
and between the 6-month-olds and both the 9- and 12-month-olds for the entirety of the familiarization trials (p=0.007 and p=0.03, respectively). Despite differences in
familiarization, all of the age groups demonstrated a decrease in looking, indicating some degree of visual habituation throughout the duration of the familiarization period.
Differences in the decrease in looking from the first half to the second half of the familiarization trials were not significant across age groups (F2,78=2.29, p=0.11).
Table 6: Percentage of Looking Time During the Familiarization Trials for the Manual Familiarization Task
First Half of Familiarization
Second Half of Familiarization Total 6-month-olds Mean (Standard Deviation) 65.04% (17.12%) 59.07% (19.21%) 61.93% (16.04%) 9-month-olds Mean (Standard Deviation) 51.64% (16.29%) 46.93% (14.50%) 49.36% (13.92%) 12-month-olds Mean (Standard Deviation) 57.85% (16.67%) 45.08% (15.99%) 51.23% (14.48%) Total Mean (Standard Deviation) 58.10% (17.39%) 50.38% (17.59%) 54.15% (15.68%)
Considering only the percentage of manual interaction time during the
familiarization trials (Table 7), the average percentage of manual interaction time differed significantly across age groups for the second half of the familiarization trials (F2,78=3.64, p=0.03) and trended towards significance for the entirety of the familiarization trials (F2,78=2.88, p=0.06). Tukey HSD multiple comparisons indicated a significant difference between the 6-month-olds and the 12-month-olds for the second half of the
(p=0.054). All of the age groups demonstrated a decrease in manual interaction, again indicating some degree of habituation for manual interaction throughout the duration of the familiarization period. Differences in the decrease in manual interaction from the first half to the second half of the familiarization trials were not significant across age groups (F2,78=1.64, p=0.20).
Table 7: Percentage of Manual Interaction Time During the Familiarization Trials for the Manual Familiarization Task
First Half of
Familiarization Familiarization Second Half of Total
6-month-olds Mean (Standard Deviation) 93.78% (5.37%) 90.85% (11.76%) 91.26% (10.66%) 9-month-olds Mean (Standard Deviation) 86.04% (21.59%) 81.14% (28.77%) 83.50% (24.70%)
12-month-olds Mean (Standard Deviation) 85.19% (16.54%) 74.46% (15.99%) 79.38% (14.48%) Total Mean (Standard Deviation) 88.35% (16.35%) 82.23% (23.00%) 84.77% (18.77%)
The differences in looking time and manual interaction during familiarization are not surprising considering the changes in exploratory behavior, motor skills, and attention occurring as the infant develops from 6 to 12 months of age. Around 6 months of age, when successful reaching is still a relatively new accomplishment, exploration is reliant on visual exploration with considerable manual and sensory exploration, often involving uncoordinated lifting and mouthing. However, as manual dexterity increases,
coordination of visual and manual exploration also increases.
31
differences in looking and manual interaction times may easily be attributed to developmental changes in domains other than cognitive processing. It is important to note is that significant differences in the decrease in looking and manual interaction time did not differ between the age groups, suggesting similar patterns of habituation
regardless of differences in baseline looking or manual interaction times.
A univariate ANOVA revealed no significant main effects or interactions for age group, sex, or color condition for the proportion of time looking at each of the test stimuli (all F<2.17, p>0.12), proportion of time manually interacting with each of the test stimuli (all F<3.68, p>0.057), or proportion of attention towards each of the test stimuli (all F<2.40, p>0.09).
The results did indicate a significant interaction between sex and color condition for total duration of visual looking (F1,69=5.12, p<0.03). Because data analyses were conducted on proportion of looking, which takes into account differences in duration of looking, the impact of this significance should be minimal. However, it should be considered in the context of interpreting the data. There were no other significant main effects or interactions for age group, sex, or color condition for the duration of looking during the test trials (all F<2.73, p>0.07). Likewise, there were no significant main effects or interactions for age group, sex, or color condition for the duration of manual interaction during the test trials (all F<2.97, p>0.0.09). Therefore, sex and condition were combined for further analyses.
preference for stimuli that differed in color. Specifically, 12-month-old infants who had the pink stimuli with blue local elements were more likely to manually interact (but not visually look at) the global change at test as compared to 12-month-old infants who had the blue stimuli with pink local elements (F=6.16, p=0.02). The cause of this difference is unclear, as there is no previously established reason that blue or pink stimuli should influence preference. No influence of color was demonstrated overall or for any other age groups on any of the variables (all F<3.44, p>0.07), and there were no detectable differences for sex that could be influencing the differential preference based on color. Because the influence of color was only present for one age group on one variable and the meaning of the influence is not known, subjects with blue and pink stimuli were combined for further analyses, but this effect warrants future research.
Paired samples t-tests for each age group and the age groups combined revealed no preference for either test stimulus for the proportion of looking time (all t<±1.39, p>0.18), manual interaction (all t<±1.60, p>0.12), or the integrated attention variable (all t<±1.01, p>0.32)3.
The 9- and 12-month-old infant groups both had participants that did not interact with one or both of the test stimuli. When these infants were removed from the 9-month-old group, neither the direction nor the significance of the results was influenced;
therefore, data from all 28 9-month-olds were included for the analyses. However, the fact that one 9-month-old did not touch either test stimulus despite demonstrating manual
33
interaction during familiarization did influence the group’s averages. This infant was coded as 0 manual interaction for the stimulus that represented the local change as well as the stimulus that represented the global change; therefore, the summation of the
proportions of manual interaction with each test stimulus do not add perfectly to 1.00 as they do for each of the other groups. However, as mentioned previously, this scoring system was preferred to removing the data because not touching the test stimuli after demonstrating the ability to manually interact is a valid response to the objects.
When the one infant who only interacted with the global change was removed from the 12-month-old group, a shift in the analyses occurred. The direction did not change; however, the significance of the difference in the proportion of manual
interaction with test stimuli did. The 12-month-old infants showed a preference for the local change during the test trials that trended towards significance (t=-1.98, p=0.059). These values are depicted in Figure 9.
(a)
35 (c)
Figure 9: Proportion of Looking Time (a), Manual Interaction (b) and Attention (c) Towards the Globally and Locally Changed Stimuli During the Manual Familiarization
(b)
(c)
Figure 10: Distribution of the Proportion of Looking Time (a), Manual Interaction (b), or Attention (c) Towards the Globally Changed Stimulus During the Manual Familiarization
Test Trials
Concerning relations with the visual familiarization and change detection tasks, none of the variables from the manual familiarization task correlated with infant behavior on either the visual familiarization or the change detection tasks (all r<±0.18, p>0.13).
Finally, a within-subjects ANOVA indicated an interaction between proportion of looking times during the visual and manual familiarization tasks and age group trending towards significance (F=2.52, p=0.09). However, there were no main effects of either looking times during the two tasks (F=1.49, p=0.23) or age group (F=0.77, p=0.47). Likewise, a within-subjects ANOVA revealed an interaction trending towards
37
during the manual familiarization task, and age group (F=2.96, p=0.06). However, there was also a main effect trending towards significance of age group for manual interaction during the manual familiarization task (F=2.69, p=0.07); a Tukey HSD multiple
comparison test indicated that this trend is largely due to a difference approaching significance between the 6- and the 9-month-old groups (p=0.07)4. The interactions between age group and within-subject factors of proportion of looking time to the globally changed stimulus during the visual familiarization test trials with proportion of looking time to the globally changed stimulus during the manual familiarization test trials (a) as well as proportion of looking time to the globally changed stimulus during the visual familiarization test trails and proportion of manual interaction with the globally changed during the manual familiarization test trials (b) are plotted in Figure 11.
(a)
4 All subjects were included in the within-subjects ANOVAs, including those infants who did not manually interact with one or both of the test stimuli. Not manually interacting with the test stimuli is a valid response to the stimuli, and because we do not yet
(b)
Figure 11: Interactions for Within-Subject Factors and Age Group for Preference for the Globally Changed Stimulus in the Visual Familiarization and Manual Familiarization
Tasks
The interactions suggest that infants have, on average, a processing style or underlying cognitive mechanism that is accessed across visual and manual familiarization tasks and that the nature and / or utilization of this mechanism may change as the infant develops through the second half of the first year. For proportion of looking times at the globally changed stimulus across tasks, it appears that variability in looking at the globally changed stimulus for visual image tasks converges on more object-based activities, regardless of age group. However, for proportion of looking time during the visual familiarization task and manual interaction time during the manual familiarization task towards the globally changed stimulus, both 6- and 12-month-old infants
39
In both interaction examples, 6- and 12-month-olds demonstrate increases in exploration during the manual familiarization task (albeit, this increase is small for the 6-month-old looking times across tasks) and the 9-6-month-olds show a decrease in
exploration during the manual familiarization task. These patterns may simply reflect developmental patterns of motor control, with 6-month-olds participating in more oral exploration, 12-month-olds actively utilizing coordinated manual manipulations, and 9-month-olds falling in the middle of the transition. However, it may also indicate that for 6- and 12-month-old infants, the saliency of the globally changed stimulus is greater during manual exploration than during visual exploration. Thus, global processing may be more utilized or more easily demonstrated by the 6- and 12-month-olds when the stimulus is an object.
Sequential Touching Task
Data from 84 of the 90 participants were used for the sequential touching
analyses. Data from the remaining 6 infants were not used due to fussiness or equipment failure. Table 8 summarizes the distribution of participants.
Table 8: Description of Participants for the Sequential Touching Task
6-month-olds 9-month-olds 12-month-olds
Sequential
Touching
Total N (Age) 28 (6.53) 31 (9.56) 25 (12.51)
Males 14 15 13
Females 14 16 12
Excluded:
Fussiness 2 0 2
Equipment Failure 0 0 2
looking time and 97% for percent manual interaction with the toys. Additional indices of sequential touching (vis., total number of objects touched, order of sequential touching, and fingering) were measured but not included in data analyses due to poor reliability. The total number of objects touched and the sequential order of interaction with the objects had extremely poor inter- and intra-rater consistency, likely due to the distance of the camera and the angle of the camera from the infant. Reliability for fingering was poor at 20%. Future research will need to take into account the challenge of coding specific, often slight, behavioral patterns by utilizing a different recording method.
No overall effect of sex was detected for looking at or manually interacting with the sequential touching stimuli (all F<0.52, p>0.47). Therefore, data from males and females were combined for further correlational analyses.
The amount of time the infants manually interacted with the sequential touching stimuli significantly correlated with age (r=-0.25, p=0.02), indicating that older infants were less likely to manually interact with the objects. Not surprisingly, manual
interaction was also significantly correlated with looking time during the sequential touching ask (r=0.32, p=0.003) such that infants who looked at the objects more also manually interact with the objects for more time.
Play Exploration Task
41
additional 2 infants were not included for the analyses of duck play behavior due to fussiness. Table 9 summarizes the distribution of participants.
Table 9: Description of Participants for the Play Tasks
6-month-olds 9-month-olds 12-month-olds
Play (Duck)
Total N (Age) 27 (6.55) 31 (9.56) 24 (12.49)
Males 14 15 12
Females 13 16 12
Excluded
Fussiness 3 0 3
Equip. Failure 0 0 2
Play (Truck)
Total N (Age) 28 (6.55) 31 (9.56) 25 (12.51)
Males 14 15 13
Females 14 16 12
Excluded
Fussiness 2 0 2
Equip. Failure 0 0 2
The primary variables of interest were percentage of time looking, touching, grasping, lifting, mouthing, and bimanually interacting with the toy. A second coder recoded a random subset of a fourth of the videos (20 of 80 videos for the duck, 21 of 82 videos for the truck). Reliability was calculated by comparing percentage of time the infant was coded as looking (92% for duck, 90% for truck), touching (97% for duck, 98% for truck), grasping (88% for duck, 96% for truck), lifting (91% for duck, 96% for truck), mouthing (99.8% for duck, 98% for truck), and bimanually interacting (95% for duck, 95% for truck) with the toys. Fingering was also coded but was not included in the data analysis due to poor reliability (10% for duck, 0.01% for truck).
Overall, no effect of sex was detected for looking, touching, grasping, lifting, mouthing, or bimanually interacting with either the duck or the truck (all F<3.02,
A large number of the play behaviors were significantly correlated within and between the duck and truck (Table 10). This is not surprising within a specific toy because many of the behaviors build off one another. For example, infants looking at a toy are more likely to touch the toy than infants not looking at it. Likewise, an infant touching a toy is more likely to grasp the toy than an infant not touching it, etc. The fact that play behaviors were highly correlated between toys suggests that the infants were playing with the toys in similar ways despite many perceptual, conceptual, and functional differences between the duck and truck.
Table 10: Correlations of Play Behaviors Between the Duck and Truck (r = Pearson Correlation, *= Significant at the p=0.05 level)
The percentage of time manually interacting with the sequential touching task objects was significantly and positively related to several play behaviors including touching the duck, grasping the duck, grasping the truck, lifting the truck, and mouthing the truck (all r>0.22, p<0.052), indicating that infants who manually interacted with one
Truck
Looking Touching Grasping Lifting Mouthing Bimanual
Interaction
Duck
Looking r
p n 0.49 0.00* 82 0.17 0.13 82 0.13 0.25 82 -0.23 0.04* 82 -0.12 0.29 82 -0.10 0.36 82
Touching r
p n 0.12 0.28 82 0.59 0.00* 82 0.55 0.00* 82 0.23 0.04* 82 0.36 0.001* 82 0.39 0.00* 82
Grasping r
p n 0.09 0.42 82 0.52 0.00* 82 0.51 0.00* 82 0.30 0.01* 82 0.32 0.003* 82 0.34 0.002* 82
Lifting r
p n 0.02 0.88 82 0.27 0.02* 82 0.28 0.01* 82 0.41 0.00* 82 0.28 0.01* 82 0.29 0.008* 82
Mouthing r
43
set of toys also manually interacted with other toys. Interestingly, percentage of time manually interacting with the sequential touching toys was significantly negatively correlated with looking at the truck (r=-0.22, 0.05). The reason for this relation is unclear.
Additionally, age significantly correlated with duck and truck mouthing (r=-0.30, p=0.01 and r=-0.36, p=0.001, respectively) and duck and truck bimanual interaction (r=-0.28, p=0.01 and r=-0.21, p=0.053). All four correlations suggest that mouthing and bimanual behavior decrease as the infant ages, likely due to the increased dexterity and reliance on visual exploration.
Similarly, the proportion looking time at the globally changed stimulus during the manual familiarization task test trials correlated significantly with bimanual interaction with the truck (r=-0.23, p=0.05). It is likely that age is a third confounded variable in this context. Age and bimanual interaction were negatively correlated, and 12-month-old infants showed a manual interaction preference that trended toward significance for the locally changed stimulus. It is possible that the infants preferring the locally changed stimulus are also the infants who do not show much bimanual interaction, thus causing a negative correlation between proportion of time looking at the globally changed stimulus during the manual familiarization test trials and bimanual interaction with the truck.
(r=0.36, p=0.002; r=0.40, p=0.00; r=0.27, p=0.02)5. Similarly, proportion of attention given to the globally changed stimulus during the manual familiarization task test trials and lifting and mouthing the duck were significantly positively correlated (r=0.30, p=0.008 and r=0.24, p=0.04, respectively). The meaning of these correlations is unclear, and future research should investigate the driving factors behind these relations.
However, these correlations do support the hypothesis that hierarchical processing is significantly related to play behaviors. Further research is necessary to understand the intricacies of this relation.
In the spirit of creative exploratory research, one additional statistically
significant and challenging-to-understand correlation was observed. The proportion of time looking at the changing stream during the change detection task negatively
correlated with visually looking at the truck (r=-0.26, p=0.03). Future research will need to explore the meaning of this relation and potential third variables that might be driving the correlation.
CHAPTER 4
DISCUSSION
This dissertation included four paradigms in a multi-method, cross-sectional design aimed at understand visual hierarchical processing and its possible generalizability to more realistic and natural experiences with objects as well as relations with play and exploratory behavior for 6-, 9-, and 12-month-old infants. The results provided by each task individually as well as collectively have provided exciting results that advance our understanding of hierarchical processing and open new avenues for research to continue to understand infant development.
The visual familiarization task addressed aim 1, which was to clarify the pattern of typical visual hierarchical processing styles demonstrated by infants from 6 to 12 months of age. Counter to the hypothesized results, only the 12-month-olds showed a significant group preference during the test trials, and the group preference was for the test stimulus with the local change, not the global change as was predicted.
unexpected results are unlikely to reflect an error in methodology and can be interpreted as a reflection of infant perception.
One potential explanation addresses processing speed and attention to the familiarization stimulus, especially considering this paradigm was experimenter-controlled (familiarization) rather than infant-experimenter-controlled (habituation) and, thus, every infant was exposed to the familiarization stimuli for the same duration regardless of processing speed or attention.
Previous research has suggested that 4-month-old infants who spend more time looking at an image of a face demonstrate different patterns of looking on visual
hierarchical processing tasks than infants who spend less time looking at the image of a face (Colombo, et al., 1995). In that study, infants who looked at the face stimulus for longer periods of time showed no preference during the test trials of hierarchical tasks, regardless of how long they were familiarized to a specific hierarchical stimulus. Infants who looked at the face stimulus for shorter periods of time, in contrast, showed a global preference with short familiarization times and a local preference with long
familiarization times (Colombo, et al., 1995). In that particular study, a “long
46
not show a significantly different looking pattern in comparison with the 6- or 9-month-old infants, making this explanation challenging if not improbable.
A second possible explanation is that these results support previous findings that a local bias, which is thought to be demonstrated first in infancy, continues through the first year before transitioning to the adult global bias (Elkind, et al., 1964; Neiworth, et al., 2006; Poirel, et al., 2008, Scherf, et al., 2009). It may be that the younger infants do not yet have an organized processing style that emerges until later in the first year and that the processing style that emerges first is the local bias.
Following the visual familiarization task, the infants participated in a change detection task, which served to support the results of the visual familiarization task by evaluating the infants’ ability to visually parse and distinguish the local elements. As predicted, all of the age groups showed a significant preference for the changing stream, and all but 4 of the 80 infants demonstrated a preference of at least 10% for one of the streams. These results indicate that the vast majority, if not all, of the infants had the visual acuity needed to detect, parse, and discriminate between the local elements of the familiarization and test stimuli.
After the visual tasks, the infants participated in the manual familiarization task that addressed aim 2, which was to understand if infants would demonstrate the same hierarchical information processing styles in a more naturalistic situation. The same paradigm was used as in the visual familiarization task, but in this case, the infants were familiarized to, and tested with, objects containing both global and local elements.
the test trials, but 12-month-olds tended to prefer manual interaction with the locally changed test stimulus. A within-subjects ANOVA supported this finding by revealing an interaction between looking time at the globally changed stimulus during the visual familiarization test trials, manual interaction with the globally changed stimulus during the manual familiarization test trials, and age. As was discussed in the Results section, this interaction suggests that infants have, on average, a processing style or underlying cognitive mechanism that is accessed across visual and manual familiarization tasks and that the nature and / or utilization of this mechanism may change as the infant develops through the second half of the first year. The fact that the same patterns of preference emerge for looking time at the visual familiarization task and manual interaction with the manual familiarization task test trials, particularly for the 12-month-old infants, offers compelling support that hierarchical processing represents a more overarching cognitive style rather than a domain specific phenomenon.
Considering hierarchical processing styles as representing a more overarching cognitive style has significant ramifications for the way we can begin to approach both typical and atypical developmental questions. As previously discussed, individuals with autism spectrum disorders (ASD) commonly demonstrate atypical hierarchical processing styles and a preoccupation with parts. It is not unreasonable to suggest that the
atypicality demonstrated in hierarchical processing could greatly influence the
48
manual domains can be seen as early as 12 months of age, when many other early
indicators of ASD have been detected (e.g., Gomez & Baird, 2005; Ozonoff, et al., 2008; Watson, Baranek, Crais, Reznick, Dykstra, & Perryman, 2007).
Finally, the infants participated in a sequential touching task and a free-play task with a duck and truck to address aim 3, which was to explore the relation between hierarchical information processing styles and object exploration and play behaviors. The results from these tasks support the hypothesis that hierarchical processing is related to object exploration and are in line with previous claims that hierarchical perceptual processing may be related to behavioral output (Happé, 1999; Happé & Frith, 2006; Happé & Booth, 2008; Mottron, et al., 2006).
This dissertation had several limitations that should be addressed in future research. The first limitation was the relatively small sample size. Although this study had very low attrition rates within and across participants, each age group was composed of approximately 30 participants. When individual task attrition is considered, sample sizes were typically between 20 and 30. Power analyses indicate that smaller effect sizes, which are not unreasonable to predict in infancy perception, may not have been detected. Because 20 to 30 participants in each age group is not significantly different from many of the previous sample sizes from infant perceptual research, I find this limitation to be minimal but worth mentioning. Future studies should consider larger group sample sizes.
A second limitation was this study’s reliance on the use of
experimenter-controlled familiarization rather than infant-experimenter-controlled habituation. In an effort to make the visual and manual familiarization tasks as similar as possible, I utilized a
the live manual paradigm. Therefore, both tasks were constrained to familiarization so that the results could be compared reasonably. However, assumptions about novelty preferences during the test trials that are considered standard for infant-controlled habituation have been brought into question for experimenter-controlled familiarization because novelty preferences do not appear to be consistently demonstrated if the infant does not completely habituate to the familiarization stimuli (e.g., Aslin, 2007; Hunter, Ames, & Koopman, 1983; Sirois & Mareschal, 2002). If an experimenter chooses an exposure criterion that ends prior to an infant’s habituation, the infant will likely not be displaying a novelty preference at test, and it is challenging to detect when this is the case using an experimenter-controlled familiarization. Despite this concern, the infants in the present study did show a decrease in looking time and / or manual interaction to the stimulus over the familiarization periods, indicating that some habituation had occurred. Similarly, when individual infants that showed a decrease in looking were the focus in the analyses, the results did not change. Thus, the decision to utilize familiarization to maximize the similarities between visual and manual familiarization tasks likely outweighed the criticism that could emerge for using familiarization rather than habituation in this study. If future research could accommodate habituation during a manual task, researchers should consider using infant-directed exposure to the stimuli so that the novelty assumptions are more explicitly appropriate.