Data Center Energy Efficiency
and Productivity
The largely invisible costs of providing power, cooling and environmental site support infrastructure are increasing far faster than the performance gained from buying new servers. In raw dollars, that means the net value to a corporation of adding new servers is far less than several years ago, and the trend line points to even lower returns on investment in the future.
This chain of events hasn’t gone unnoticed inside IT hardware companies. Chip and server makers are working to restore the net productivity gains of Moore’s Law by boosting energy efficiency per cycle and per transaction. In the short term, however, corporations need to take a number of steps to significantly reduce their operating costs and extend the capacity of their data operations. The required actions range from utilizing new IT technology, such as server virtualization and data-storage tiering, to implementing new computer room best practices. The good news is the majority of these short-term initiatives are self-funding. They can be accomplished with little or no capital investment. All companies can recover existing site infrastructure capacity and many may defer the need for costly new data center investment. The bad news is these are one-time fixes. Hopefully, by the time the steps identified by The Uptime Institute (the Institute) are implemented, new and radically more power-efficient chips and other technologies will be available.
By Kenneth G. Brill
Background
Data centers consume large amounts of electricity, of which there is an increasing shortage at escalating prices. While the total magnitude of data-center energy consumption is currently unknown, estimates place it in the range of 1.5 percent to 3 percent of total electricity generated. As a result, energy consumption in data centers has drawn the attention of politicians. In fact, on December 20, 2006, President Bush signed Public Law 109-431, which mandates the Environmental Protection Agency study data center and server energy consumption and report back to Congress in 90 days.
This White Paper:
! Breaks data-center energy consumption into two separate but interrelated components, with IT being responsible for IT Productivity per Embedded Watt (IT-PEW) and Facilities/Corporate Real Estate being responsible for the Site Infrastructure Energy
Efficiency Ratio (SI-EER)
! Identifies Integrated Critical EnvironmentTM (ICE) Teams as a necesary organizational breakthrough
required to holistically address energy effiency,
while at the same time improving IT productivity and reliability
! Shows how C-suite strategy, systems/data architecture, and equipment selection decisions dramatically affect a data-center’s composite IT Productivity per Embedded Watt
! Discusses how turning off “dead servers,” virtualizing servers, archiving or “tiering” data storage, and enabling server power saving features not only reduces power consumption (saving on utility bills) but more importantly, recovers environmental infrastructure capacity to support newer, more power intensive IT equipment
! Identifies how technical and operational choices
for cooling equipment significantly affects energy
consumption via the Site Infrastructure Energy
Efficiency Ratio
! Presents an illustrative case study of how a four-quadrant ICE Team can harvest multiple gold nuggets to achieve up to a 50 percent reduction in electric consumption while at the same time deferring—perhaps permanently—the need to build a new $100 million data center
Editor’s Note: This paper is part of an ongoing collaborative process of a group known as the Fellows’ Working Group of the High-Den-sity Computing Symposium. This paper will be part of the theoretical underpinnings of the 2007 Symposium and will be published in full in the e-Journal on High-Density Computing, available to all members of the HDC e-Community of Practice and at The Uptime Institute Symposium 2007: The Invisible Crisis in the Data Center, March 4-7 in Orlando. (www.uptimeinstitute.org/symposium)
As described in much greater detail in the Institute’s white paper entitled, The Economic Meltdown of Moore’s Law, the 3-year cost of powering and cooling servers (OpEx + amortized CapEx) is currently 1.5 times the cost of purchasing server hardware. Future projections extending out to 2012 show this multiplier increasing to 22 times the cost of the hardware under worst case assumptions and to almost three times under even the best-case assumptions. The best-case assumptions are double the ratio of today (See Figure 1).
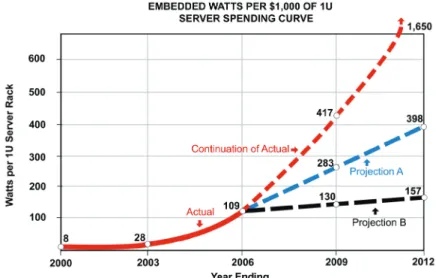
Another way of understanding the economics underlying this trend is to look at Embedded Watts per $1,000 of 1U Server Spending (See Figure 2). In just 6 years, the power consumption of servers per $1,000 of acquisition cost has almost invisibly risen from 8 Watts to 109 Watts. Over the next 6 years, this trend is projected to continue rising. Continuation of historical trends results in 1,650 embedded Watts in 2012. Projections A and B are informed conjecture and more accurate projections will be discussed at the Institute’s 2007 Symposium. The lowest projection (which is an informed guess!) still results in 157 Watts. Using this most optimistic assumption, the same spending level in 2006 for a server technology refresh brings with it 13.6 times more power consumption than in 2000.
Figure 1: Site infrastructure costs (OpEx + amortized CapEx) for data-center power and cooling are a growing percentage of the cost of buying a server
Figure 2: Purchase of $1,000 of 1U server hardware brings with it rapidly rising IT power consumption.
In practical terms, consider a data center in 2006 that has an IT capacity of 1,000,000 Watts and is only 50% loaded. Of the existing IT load, 60% is servers (including mainframes) and the remaining balance is data storage and communications. Now assume a $10 million server technology refresh occurs in 2006 (down by $2 million from a previous $12 million refresh in 2003). A purchase of new 1U servers embeds 1,090,000 Watts of new IT power consumption (109 Watts/$1,000 x $10,000,000) which replaces 336,000 Watts (28 Watts/$1,000 x $12,000,000) in 2003 equipment — assuming the old equipment will be turned completely
off, which field experience shows is questionable.
Doing the math, a technology refresh that costs 17 percent less in 2006 than in 2003 consumes 2.2 times the power, or 754,000 Watts. When this increase is added to the 200,000 Watts of other IT loads (1,000,000 Watts IT Capacity x 50 percent loaded x 40 percent non-server load), this data center is suddenly very close to being out of site infrastructure capacity and now needs to be scheduling a major multi-million dollar capacity upgrade.
Note: This is a real example, but similar issues are occurring with greater and greater frequency.
Implementation of New Technology and
Best Practices Can Save Millions
Fortunately, new technology and research by the Institute and many others has resulted in new best
practices and technology that can create significant savings. This is like finding gold nuggets lying on the computer room floor and is labeled by the Institute
as “The Five Gold Nuggets.” (For more information, please refer to the High-Density Computing: The Path Forward 2006 white paper on the Institute’s web site). Ultimately, organizational and governance changes will be required to re-orient the way organizations make IT hardware decisions, which historically have “baked-in” rapidly increasing site costs. This white paper provides a theoretical basis for CIOs, CFOs, and other C-suite executives and their direct reports to understand and respond to these issues by implementing the new best practices just now becoming available. The costly interdependencies between IT technology decisions and critical physical layer facility operations are often overlooked or poorly understood. Similarly, corporate real estate executives are puzzled that 30,000 square foot data centers that previously cost $20 million may now cost $100 million with $200 million and even
$300 million in sight (all of the largest financials currently
have between $500 million and $1,000 million data center
construction budgets). The rate at which change is occurring exceeds the ability of most organizations to adapt and cope. The result is confusion, delay, increased downtime risk, and sub-optimal decisions. .
New Organizational Best Practices
The Institute has identified at least five significantopportunities for harvesting “energy gold” (for up to a 50% reduction in annual energy costs and the deferral of new data center construction). These opportunities will be described later in this white paper after the conceptual framework for understanding and managing them has been presented. Four of these opportunities occur within IT and one is within Facilities. All of this gold will be captured much faster with the adoption of a new planning methodology and functional team approach called Integrated
Critical Environment (ICE) Team, which were first
explored during the Institute’s 2006 High-Density Computing Symposium. When properly constituted and empowered, ICE Teams become an essential part of an overall strategy for reducing computer-room power consumption and optimizing overall IT performance.
In addition to the economic benefit of reducing
energy consumption and deferring new data center construction, the cross-boundary cooperation between
IT and facilities also has other significant benefits.
IT’s layout of the computer room dramatically affects the amount of hardware that can be cooled consistently (poor layout choices can cut usability by 50 percent), which directly supports business continuity by avoiding intermittent ghosts and other reliability problems. Installation of blanking plates and other best practices also can reduce equipment temperatures dramatically. As densities continue to rise, these issues will become more and more important to assure computer hardware receives optimal critical environment conditioning.
The following four-quadrant table outlines the new organizational model for identifying the energy
efficiency and productivity interests of each data
Three New Metrics Produce New Best
Practices
The Institute has developed three new metrics to monitor up-front and after-purchase costs to maximize IT return on investment.
1. Data Center Energy Efficiency and Productivity Index (DC-EEP Index)
The Data Center Energy Efficiency and Productivity
Index (DC-EEP Index) is the composite result at the data center level of multiplying two independent but
interrelated ratios. The first is the IT Productivity
(network transactions, storage, or computing cycles) per Embedded Watt (IT-PEW). The second is the
Site Infrastructure Energy Efficiency Ratio (SI-EER). The first component is primarily the responsibility of
IT, while the second is primarily the responsibility of Facilities. The resulting DC-EEP Index can be thought of as the delivered IT Productivity “out” to information users per watt of site infrastructure
energy “in.” It can be benchmarked against other IT organizations separately by the two individual components or by the end-to-end composite to determine best practices and the areas of potential improvement. 2. IT Productivity Per Embedded Watt (IT-PEW) IT–PEW is the responsibility of the Information Technology organization. It is the result of data architecture and reliability decisions made in Q1 and operating decisions made in Q2. Q1 and Q2 refer to Figure 3 which graphically presents a four-quadrant ICE Team. At the enterprise level, the CIO or his direct reports make strategic data and systems architectural and design decisions as to how they will achieve the required level of information availability that is acceptable to business users. These Q1 choices ultimately are expressed in how much equipment is required to achieve a given response time and availability service level, how many data copies to keep, fail-over strategies, Figure 3: Empowered, fully formed, four quadrant, boundary-less ICE Teams can save
millions in OpEx and CapEx while improving uptime performance
INTEGRATED CRITICAL ENVIRONMENT
TM(ICE) TEAM STAKEHOLDERS
CFO/Corporate Real Estate/Facilities Information Technology
Quadrant 4 (Q4)
Understanding the strategic implications of high-density on the data center real estate portfolio and subsequent capital budgeting and lifecycles for investment
Managing Corporate Social Responsibility initiatives which must include data center energy efficiency
Chartering of ICE Teams to optimize
performance and minimize CapEx and OpEx costs
•
• •
Quadrant 1 (Q1)
Understanding the long term implications of data center facility costs becoming 5 percent to 15 percent of IT’s budget
Incorporating site costs into the economic analysis of new application decisions
Mandating consideration of IT Productivity per Embedded Watt (IT-PEW) in system architecture and equipment selection decisions
Chartering of ICE Teams to optimize performance and minimize CapEx and OpEx costs
• • • •
Quadrant 3 (Q3)
Managing the site infrastructure’s Critical Layer Dashboard (Actual loads, Remaining Capacity, Projected Exhaustion Point)
Understanding computer room cooling science and implementing best practices
Understanding the Site Infrastructure Energy Efficiency Ratio (SI-EER) and working with Q3, implement best practices
Tactical Critical Physical Layer implementation and best practices
ICE Team operations • • • • • Quadrant 2 (Q2)
Managing the site infrastructure’s Critical Layer Dashboard (Actual loads, Remaining Capacity, Projected Exhaustion Point)
Implementing IT-PEW best practices
Tactical Critical Physical Layer implementation and best practices
ICE Team operations • • • •
Strategic
Operations
back-up strategies, disaster recovery strategies, etc. From a macro perspective, these decisions involve intentional duplication and redundancy to assure the required availability. Depending upon their objectives and the business consequences of not achieving them, different companies will use more or less IT equipment to accomplish a certain amount of processing, storage, or transactions. Benchmarking of IT-PEW at the level of Q1 strategy only can be done against organizations with similar reliability and availability requirements.
In addition to strategy decisions that have very significant
energy consumption implications, the Q1 quadrant also
makes vendor choices about what specific hardware to
buy. These choices have embedded energy consumption/ productivity metrics, which can be benchmarked more easily. The Institute, along with many other users, manufacturers, and interested parties, has contributed to the development of such a standard called the Server Measurement Protocol, which was released Nov. 3, 2006, and is available at www.uptimeinsititute.org/ symposium. This protocol for servers allows benchmark comparisons between different models within a hardware manufacturer’s product line and between the
manufacturers of different products. It is the first step in
creating an objective measurement of IT Productivity per Embedded Watt or IT-PEW at the individual product or hardware level (which is different than the composite data center strategy or availability level as discussed earlier). Additional product benchmarking protocols are required for data storage, network, and other IT functions. These will be discussed at the Institute’s upcoming Spring Symposium on The Invisible Crisis in the Data Center.
The composite hardware choices resulting from Q1 decisions (which may have been made 12 to 18 months earlier) ultimately must be housed in a data center that has physical space, power and cooling constraints.
Oftentimes, the first time Q2 and Q3 quadrants
learn about Q1 initiatives is when new hardware shows up on the data center loading dock and must be installed. Increasingly, this equipment can’t be installed because Q1 technology decisions (strategy and product) were made without adequate consideration of their energy consumption and density implications. Unless the data center’s remaining power and cooling constraints are being tracked (a responsibility of Q2 and Q3 in the new ICE Team concept), a career-limiting surprise can occur. The classical case is an Institute client that made a $22 million investment in blade servers that couldn’t be installed without a $54 million upgrade in
power and cooling capacity. Instead of the new application
needing a Return on Investment (ROI) sufficient to
justify a $22 million decision, the real economic payback required recovering an investment of $76 million. Additional factors that must be considered in the overall composite IT-PEW are Q3 operational decisions, which
fly well below the radar of the C-suite. These include
whether the new power save features in servers are enabled, whether old servers are turned off at the end of a technology refresh, and whether inactive data is archived
to slower, but more energy-efficient data storage.
3. Site Infrastructure Energy Efficiency Ratio (SI-EER)
The Institute recently developed the Site Infrastructure
Energy Efficiency Ratio (SI-EER) as a simple tool Q4
and Q3 executives can employ to determine how well
they are managing the efficiency of their data center’s
site infrastructure systems. These power and cooling systems (which are the operational responsibility of Q3) supply the IT load. They bring power into the data center, condition it, supply the IT load, and then remove the resulting heat by exhausting it to the outside environment. Simply explained, the SI-EER ratio is power “in” to the data center as measured at the utility electric meter divided by the conditioned power “out” to run the IT equipment for computing. The difference between output and input
are transformation losses, equipment inefficiencies,
and user operational choices on control setpoints – particularly on use of outside air, computer room
temperatures, relative humidity, bypass air flow, dueling
cooling units, use of blanking plates, computer room layout, and other factors that are under the full control of the Mission Critical Facilities function (Q2 and Q3). Site operating data from many of the 85 corporate members of the Institute’s Site Uptime Network® indicates an actual SI-EER of 2.5. This means that for every 2.5 watts “in” at the data center service meter, only 1 Watt is delivered “out” to the IT critical load. The very best ratio possible is 1.6 assuming the most
energy efficient components, no-over provisioning of
capacity, and no free-cooling at any time during the year (i.e. for every 1.6 Watts “in,” 1 Watt is delivered “out” to the IT critical load. These sites could achieve a 40% energy reduction if they knew how and were
motivated to accomplish an energy efficiency ”tune-up.”
For many large data centers (>30,000 ft2), improving the SI-EER from 2.5 down to 2.0 (and some sites
will start from greater than 2.5) in high rate utility regions will save close to a million dollars annually on utility bills with no impact on reliability – in fact, cooling reliability is likely to be improved. Further more, tune-up improvement does not require building a new data center employing more energy efficient
components. Institute research has developed new
best practices which will result in significant SI-EER
improvements using the equipment already installed. Whether the existing ratio at a site is 2.8, 2.5, 2.0, or 1.8, measurement will inevitably lead to improvement. While the SI-EER concept is simple, successful harvesting of energy savings requires a very thoughtful, interactive,
sequential process, which first creates an engineering baseline and builds organizational confidence for
taking what will be counter-intuitive actions (raising setpoints to reduce computer room temperatures as being just one example). Very experienced, principal-level engineering is required because the reaction of mechanical systems to changes in setpoints is non-linear and the air turnover in a data center is once a minute. Making changes in an uncontrolled manner can result in cooking compute equipment within 5 minutes! Determining how, where, for how long, and with what
instruments to make the measurements is a significant
issue which unfortunately has stopped most sites. Once the measurement system begins to collect actual data, correlations need to be made between outside weather and regional seasonal conditions, computer room temperature and humidity, computer room
outside air turnover, computer room humidification and de-humidification, computer room pressurization and vapor barriers, bypass air flow, % hot racks, computer room floor layout, blanking plates, delivered
cooling unit performance, chilled water supply and return temperature, installed free cooling equipment,
mechanical plant configuration (chilled water, DX condenser water, DX refrigerant, and combinations),
topology of the electrical system, percentage of load on the infrastructure systems, and whether the total energy consumption for computer room cooling can be fully captured (this is a particular problem for data centers
located in office building(s) or campus sharing a common
mechanical plant - part of this study will be developing methods for allocating common costs incurred). The Institute’s recommended approach to these issues is for users (Q2 and Q3) to participate in a SI-EER Improvement Network (similar to the Institute’s Site Uptime Network) for the Q2 and Q3 quadrants of
companies wanting to achieve significant energy efficiency improvements quickly. Together, they
can get the necessary education, master the counter-intuitive engineering principals, run carefully controlled experiments demonstrating those principals, and
finally, using each other as sounding boards to build
the necessary internal back-home support for making
significant changes to their established historical ways
of doing things in the computer room.
Unlike electrical systems, which behave in ways that are almost totally predictable, mechanical systems are “squishy.” Well-intentioned changes can have perverse consequences. For example, almost every large data center in the Northeast has a plate and frame heat exchanger for doing free-cooling in the cold winter months. And, almost without exception, the free-cooling design was tried once early in the data center’s life and never attempted again because cooling in the computer room became unstable. Having experienced the consequences of severe cooling instability, the people involved did not want to take the career risk of ever trying again. (Free-cooling is not inherently unstable, but the cooling tower designs most commonly used are totally inappropriate for data centers.) Building
institutional knowledge and confidence is a significant
part of the energy
Implementing the New Best Practices
The following examples are used to illustrate and conceptually tie together the many different energy saving ideas outlined in this white paper. No single company is known to have done all of the initiatives that will be illustrated. However, each of the individual
benefits (with one exception which is noted) has
been separately demonstrated multiple times.
Benefit responsibility is assigned to the initiating
quadrant of an ICE Team that must start the ball rolling and provide the organizational push to ensure progress is made. For each saving, an estimate is made of its
relative difficulty to achieve, the potential energy
saving relative to the hardware category (i.e. servers, including mainframes, typically constitute 50 to 60 percent of total IT energy consumption. A 10 percent server energy saving translates to a 5 to 6 percent reduction in total data center energy consumption), the investment required, and the time required for payback. Note that the savings are not cumulative.
Once a saving has been captured, the benefit remaining
for other initiatives may be reduced. Cumulative data center energy savings of up to 50 percent are possible if all gold nuggets are harvested.
Q1. Quadrant 1: Responsibility of CIO or their direct reports (IT Productivity per Embedded Watt)
Low-hanging fruit (no IT hardware investment required, low cost to implement, rapid payback) A.Benchmark IT Productivity per Embedded
Watt and similar metrics against other peer organizations having similar scale, availability, and reliability goals to identify best practices and opportunities for improvement
B. Change user charge-back systems to incorporate the true total costs of IT to motivate selection
of more energy efficient solutions and the
turning off of equipment no longer needed C. Adjust the economic hurdle rate in the new application
justification process to include both CapEx and OpEx
facility and site infrastructure costs
D. Kill dead servers (10 percent to 30 percent server energy savings, three months)
E. Kill dead storage (10 percent or more storage energy savings, three months)
F. Enable laptop like server power saving features (large-scale data center implementation of this feature should reduce the peak data center power demand and thereby recover data center capacity. However, the Institute doesn’t know of any sites that have implemented this feature on a large scale. Controlled studies are required. If implemented, in addition to reducing peak load and thus data center capacity, this feature should have off peak energy savings of 15 percent and perhaps much more, requires 3 months for internal technical feasibility evaluation that service levels can still be achieved if the feature is enabled and then 3 months for implementation)
Intermediate (requires some IT equipment investment, rapid payback)
A. Consolidate and virtualize servers (10:1 energy savings common, i.e. 90 percent savings, requires fewer, bigger servers, 6 to 9 months) B. Implement tiered data storage moving inactive
data to less power intensive storage (10 percent or more savings, 6 to 9 months)
•
•
C. Use IT Productivity per Embedded Watt benchmarking to make vendor selection decisions for IT equipment (5 percent to 10 percent energy savings, but must be buying new equipment in order to realize savings)
Strategic (requires major investment, implementation
likely to be very difficult and time consuming)
A. Change IT reliability and availability strategy
to be more energy efficient (unknown energy benefit and years to implement)
Q2. Quadrant 2: Responsibility of Data Center Operations (Site Infrastructure Energy Efficiency Ratio)
Low-hanging fruit (no IT hardware investment required, low cost to implement, rapid payback) A. Install internal cabinet blanking plates, reduce
bypass airflow to 10 percent by blocking cable
cutouts and relocating perforated tiles from the hot to cool aisles, reduce number of perforated tiles to match heart load (Requires training and organizational commitment, implementation can be within weeks)
B.Fully implement all 28 requirements of hot and cold aisle cooling (Requires training and organizational commitment, full implementation can take years)
Strategic (requires major investment, implementation
likely to be very difficult and time consuming) A. Reconfigure computer room IT and facility
equipment layout to follow hot and cold aisle rules (If laid out incorrectly, this mistake may require 5 to 10 years to remedy, depending on the frequency of future technology refresh cycles) Q3. Quadrant 3: Responsibility of Mission-Critical Facilities (Site Infrastructure Energy Efficiency Ratio)
Low-hanging fruit (no IT hardware investment required, low cost to implement, rapid payback) A. Re-calibrate sensors to prevent dueling cooling
units, once bypass airflow is reduced by Q2, turn
off unneeded cooling units, raise chilled water loop temperatures, identify and repair malfunctioning cooling equipment, reduce outside air input, •
•
•
eliminate or radically reduce humidification/de-humidification, and reduce average computer
equipment air inlet temperature to 70°F. (Requires
training, education, and organization confidence
building)
B. Benchmark Site Infrastructure Energy Efficiency
Ratio and similar metrics against other organizations having similar scale, availability, and reliability goals to identify best practices and opportunities for improvement
Intermediate (requires mechanical plant piping investment, rapid payback)
•
A. Re-pipe plate and frame heat exchanger
and cooling tower configuration to control
chilled water temperatures when making
seasonal configuration changes. (Engineering is
straightforward, but implementation may require downtime for piping changes)
Strategic (requires major investment, implementation
likely to be very difficult and time consuming) A. Install more energy efficient UPS, chillers, cooling
units, etc •
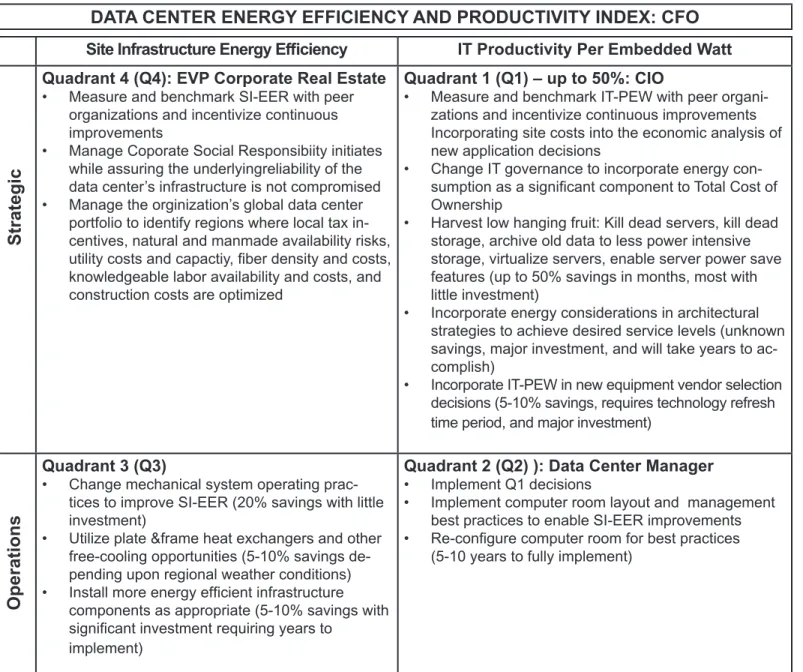
Figure 4: Estimate of Potential Energy Efficiency Improvements by Organizational Quadrant
DATA CENTER ENERGY EFFICIENCY AND PRODUCTIVITY INDEX: CFO
Site Infrastructure Energy Efficiency IT Productivity Per Embedded Watt Quadrant 4 (Q4): EVP Corporate Real Estate
Measure and benchmark SI-EER with peer organizations and incentivize continuous improvements
Manage Coporate Social Responsibiity initiates while assuring the underlyingreliability of the data center’s infrastructure is not compromised Manage the orginization’s global data center portfolio to identify regions where local tax in-centives, natural and manmade availability risks, utility costs and capactiy, fiber density and costs, knowledgeable labor availability and costs, and construction costs are optimized
• • •
Quadrant 1 (Q1) – up to 50%: CIO
Measure and benchmark IT-PEW with peer organi -zations and incentivize continuous improvements Incorporating site costs into the economic analysis of new application decisions
Change IT governance to incorporate energy con-sumption as a significant component to Total Cost of Ownership
Harvest low hanging fruit: Kill dead servers, kill dead storage, archive old data to less power intensive storage, virtualize servers, enable server power save features (up to 50% savings in months, most with little investment)
Incorporate energy considerations in architectural strategies to achieve desired service levels (unknown savings, major investment, and will take years to ac -complish)
Incorporate IT-PEW in new equipment vendor selection decisions (5-10% savings, requires technology refresh time period, and major investment)
• • • • • Quadrant 3 (Q3)
Change mechanical system operating prac-tices to improve SI-EER (20% savings with little investment)
Utilize plate &frame heat exchangers and other free-cooling opportunities (5-10% savings de-pending upon regional weather conditions) Install more energy efficient infrastructure components as appropriate (5-10% savings with significant investment requiring years to
implement) •
• •
Quadrant 2 (Q2) ): Data Center Manager
Implement Q1 decisions
Implement computer room layout and management best practices to enable SI-EER improvements Re-configure computer room for best practices (5-10 years to fully implement)
• • •
Strategic
Q4. Quadrant 4: Responsibility of CFO or EVP/ SVP of Corporate Real Estate (Data Center Energy Efficiency and Productivity Index)
Low-hanging fruit (no IT hardware investment required, low cost to implement, rapid payback)
A. Benchmark the Data Center Energy Efficiency
and Productivity Index, IT Productivity per embedded Watt and Site Infrastructure Energy
Efficiency Ratio and similar metrics against other
organizations having similar scale, availability, and reliability goals to identify best practices and opportunities for improvement
B. Work with Q1 to change user charge-back systems to incorporate the true total costs of computing to motivate selection
of more energy efficient solutions and the
turning off of equipment no longer needed C. Work with Q1 to adjust the economic hurdle
rate in the new application justification process
to include both CapEx and OpEx facility and site infrastructure costs
Summary
Performance per dollar of IT equipment continues to increase dramatically. Less obvious is that the power consumed per computer rack or cabinet has also jumped dramatically. The operating and capital expense (OpEx and CapEx) of providing the associated physical space and, more importantly, the power, cooling, and environmental support site infrastructure also has risen rapidly. In fact, the rise in site infrastructure costs has been so great and so rapid that it now largely offsets the
net productivity benefits of buying new servers.
The Institute calls this effect The Economic Meltdown of Moore’s Law. This transformation and its implications are just now being fully recognized. It has profound
business ramifications because it alters the fundamental
economics of IT. The consequences of this change are typically invisible to C-suite executives until the capacity of their data centers has been consumed without their being aware, triggering an unanticipated multi-million expense.
In the long run, chip and hardware manufacturers
must restore the historical net productivity benefits of
Moore’s Law by becoming dramatically more energy
efficient per cycle, per storage unit, or per transaction
in their products. In the short term, there fortunately are
•
significant energy and productivity savings available
that are just waiting to be harvested. These gold nuggets can be realized with a combination of new IT technology (server virtualization and data storage tiering) plus new research by the Institute and others on new computer room best practices. The combination of new technology and new best practices provides CFOs, CIOs, and other senior executives with bottom-line responsibility with
a concrete basis for expecting significant data center
energy savings with no reduction in IT performance. Harvesting these gold nuggets requires a new organizational structure called Integrated Critical
Environment (ICE) Teams because the inefficiencies
fall outside traditional functional responsibilities. The majority of these savings are self-funding, i.e. they can be done with little or no capital investment. All will recover site infrastructure capacity and defer the need for new data center investment. Hopefully, by the time all these one-time nuggets are harvested, new, radically
more power efficient chips and other technologies will
be available.
This white paper along with other new Institute white papers (High Density Computing: The Path Forward 2006, The Economic Meltdown of Moore’s Law, Organizing and Utilizing ICE Teams) will be presented at the Institute’s Spring Symposium The Invisible Crisis in the Data Center to be presented March 4-7, 2007 in Orlando, FL.
About the Author
Mr. Brill is the Founder and Executive Director of The Uptime Institute and the 85-corporate member Site Uptime Network. He holds an undergraduate degree in electrical engineering and an MBA from the Harvard Business School. Many industry innovations, such as dual power topology and Tier level trace back to his original work. In 1999, recognizing that heat density would become critical to IT availability; Mr. Brill worked closely with the Thermal Management Consortium to publish the white paper 2000-2010 Heat Density Product Trends. This foundational industry document predicting many of the problems now facing the industry was updated for the Institute’s High-Density Computing Symposium held in April 2006. He has authored or contributed to many white papers and is a frequent commentator in business and technology media on data center and site infrastructure design, engineering, and management issues. His current focus is on strategic and business impact of The Economic Meltdown of Moore’s Law.
About The Uptime Institute
Since 1993, The Uptime Institute, Inc. (the Institute) has been a respected provider of educational and consulting services for Facilities and Information Technology organizations interested in maximizing data center uptime. The Institute has pioneered numerous industry innovations, such as the Tier
Classifications for data center availability, which
serve as industry standards today. At the center of the Institute’s offering, the 85 members of the Site Uptime® Network represent mostly Fortune 100
companies for whom infrastructure availability is a serious concern. They collectively and interactively learn from one another as well as from Institute -facilitated conferences, site tours, benchmarking, best practices, and abnormal incident collection and analysis. For the industry as a whole, the Institute publishes white papers, offers a Site Uptime Seminar Series and a Symposium Series on critical uptime-related topics. The Institute also conducts
sponsored research and product certifications for the
industry’s manufacturers.
Also see the Institute white pape entitled The Path Forward: 2006 and the proceedings from the 2006 High-Density Computing Symposium
Building 100
2904 Rodeo Park Drive East • Santa Fe, NM 87505 Fax (505) 982-8484 • Phone (505) 986-3900 [email protected] • www.uptimeinstitute.org
This white paper is posted and maintained on The Uptime
Institute, Inc.’s website at www.uptimeinstitute.org/ whitepapers. Permission is hereby granted to reproduce or distribute this white paper in its entirety.
© 1996, 2007 The Uptime Institute, Inc.
TUI3004C
The results of this work will be presented at the
Uptime Institute Symposium 2007
The Invisible Crisis in the Data Center How IT Performance is Driving the Economic
Meltdown of Moore’s Law
March 4-7, Swan & Dolphin Resort, Orlando
Hear industry leaders discuss the impact of the Economic Meltdown of Moore’s Law
in the on-demand video e-Symposium
The Invisible Crisis in the Data Center.
Go to:
www.accelacomm.com/jlp/TTOutreach/0/2945/
to watch it today.
For more information and to register an ICE Team: http:www.UptimeInstitute.org/symposium or call Lars Strong, PE, at (505) 946-3472