structural instabilities in tissues
by
Somiealo Azote
Dissertation presented for the degree of Doctor of Philosophy
in the Faculty of Science at Stellenbosch University
Supervisor: Prof. Kristian Müller-Nedebock
Declaration
By submitting this dissertation electronically, I declare that the entirety of the work contained therein is my own, original work, that I am the sole author thereof (save to the extent explicitly otherwise stated), that reproduction and publication thereof by Stellenbosch University will not infringe any third party rights and that I have not previously in its entirety or in part submitted it for obtaining any qualication.
December 2018
Date: . . . .
Copyright © 2018 Stellenbosch University All rights reserved.
Abstract
Mechanical properties of cells and modelling of structural instabilities
in tissues
Somiealo Department of Physics, Stellenbosch University,
Private Bag X1, Matieland 7602, South Africa. Dissertation: PhD
August 2018
Cells have inherent mechanical properties that can be modelled physically. Statistical physics approaches permit the understanding of deformation dependence by modelling the various el-ements of the cytoskeleton and combining these with the constraints and physical properties of the cell membrane. When cells combine to form more complex structures, including, for example, epithelial structures, the resulting structure also needs to be understood. We wish to understand the mechanical contribution to the elastic properties and stability of the cell within the tissue when branching actin cytoskeletal network emerge or grow and their structure, spa-tial organisation and orientational ordering geometrically constrained by the cell membrane. Based on a grand canonical ensemble formalism by Frisch et al. [1] and Müller-Nedebock et al. [2], we model the structure of branching actin networks of living cell cytoskeletal l-aments when these are rigidly contained with geometrical conning regions. The formalism allows a thermodynamic equilibrium calculation of density and orientational order density for laments and branch points. We nd distinct local orientation, order parameter and density proles for network lament segments, as the degree of branching and the ratio of persistence lengths of the laments to the conning region size are varied. These results suggest the role of the connement in the structural properties and organization of branching actin networks inside the conning region. We next investigated the contribution of the elastic properties of the networks to the elastic properties and stability of the cells within tissues by computing
ABSTRACT iii the free energies and forces of networks system. we nd that tissue cells are stable against compression while cell under shear become unstable beyond a critical angle.
Uittreksel
Mechanical properties of cells and modelling of structural instabilities
in tissues
Somiealo Fisika Departement, Stellenbosch Universiteit,
Privaatsak X1, Matieland 7602, Suid Afrika. Proefskrif: PhD
Augustus 2018
Selle het inherente eienskappe wat met die sika gemodelleer kan word. Statistiese ska be-naderingspunte laat toe om die vervormingsafhankliheid te verstaan deur die modellering van verskillende elemente van die sitoskelet en om dit met die randkondisies en siese eienskape van die selmembraan te kombineer. Wanneer selle gekombineer word om meer komplekse strukture te vorm, insluitende, byvoorbeeld, epitele strukture, dan moet die resulterende struktuur ook ondersoek word. Ons wil die meganiese bydrae tot die elastiese eienskappe en die stabiliteit van die sel as deel van die weefsel verstaan, wanneer vertakkende aktien netwerke ontstaan en groei, en hulle struktuur, organisasie in die ruimte deur die geometrie van die sel ingeperk word. Gebaseer op n grootkanoniese formalisme van Frisch, et al., en van Müller-Nedebock et al. modelleer ons die struktuur van vertakkende aktien netwerke van dinamiese selle se sitoskelet-lamente wanneer hierdie tot starre geometriese gebiede beperk word. Die formalisme laat n berekening in die termodinamiese ewewig toe van die digtheid and orde in uitrigtings vir die lamente and vertakkingspunte. Ons bepaal duidelike lokale orientasie-, orderparameter- en digtheidsproele vir netwerk lamente, in afhanklkheid van hoe die graad van vertakking en die verhouding van die lamente se persistensielengte tot die grootte van die ingrensende gebied varieer. Hierdie resultate dui aan wat die rol van die ingrensing op die strukturele eienskappe en organisasie van die vertakkende aktien netwerke is binne die ingrensende gebied. Ons het ook ondersoek wat die bydrae van die elastiese eienskappe van die netwerke tot die elestiese eienskappe en stabiliteit van van die selle binnekant n weefsel is, deurdat die vrye energië en
UITTREKSEL v kragte van die netwerkstelsel bepaal is. Ons vind dat weefsel stabiel teen samepersing is, terwyl dit onder skuifkragte bokant n kritieke hoek onstabiel raak.
Acknowledgements
I would like to express my special appreciation and thanks to my supervisor Professor Kristian K. Müller-Nedebock for all his advices, patience, motivation and support of my Ph.D research. I would like to thank Dr. Kriel for some helpful discussions we had during my thesis.
I am so grateful to the Organisation for Women in Science for the Developing world (OWSD) and to the Swedish International Development Cooperation Agency (SIDA) who have funded this work, a big thank you. I thank also the National Research Foundation of South Africa (NRF) for their support.
I thank the African Instite for Matematical Sciences (AIMS) for opening me the doors of mathematical science researches.
To my AIMS's supervisor Professor Jean-Francois Joanny and to Doctor Rhoda Hawkins, I say thank you for having introduced me to the eld of biophysics.
I would like to take this opportinuty to thank Professor Banna Magolmeena for his motivation and support. I thank also M. Kokou Gawonou N'Tsouaglo for the stimulating discussions about how to learn fast the programing languages, especially C/C++.
A special thank you to my oce mates, Doctor Stanard Mebwe Patchong and Ishmael Takyi for the interesting discussions, and their support.
A big gratitude goes to my parents, family and family-in-law whom have always been by my side, for their love, prayers and support, a big thank you.
I am so grateful to my husband Hassikpezi Florent, thank you for your patience, motivating and loving heart.
I can not conclude without giving all the honor and glory to the Mighty God who has permitted this dream to become true!
Contents
Declaration i Abstract ii Uittreksel iv Acknowledgements vi Contents vii List of Figures x List of Tables xxxI Introductory chapter
1
1 Introduction and background 2
1.1 Introduction and motivation . . . 2
1.2 Basic concepts about the physics of cell and their cytoskeleton . . . 5
1.3 Conclusion . . . 18
II Density eld theory for conned branching cytoskeletal
net-works
21
2 Introduction of monomer ensemble formalism for semiexible linear poly-mer chains and connement 22 2.1 Introduction . . . 222.2 Description of the model: Grand canonical partition function . . . 23
2.3 Average numbers and average density distribution functions . . . 30
2.4 Connement . . . 34
2.5 Denition of the radial order parameter eld . . . 40
2.6 Conclusion . . . 41 vii
CONTENTS viii
3 Branching cytoskeletal networks in conning region 42
3.1 Introduction . . . 42
3.2 Description of the model . . . 43
3.3 Average density distributions . . . 56
3.4 Numerical method . . . 57
3.5 Conclusion . . . 63
4 Densities proles and ordering of laments of branching actin networks in conning cells 64 4.1 Introduction . . . 64
4.2 Domain of validity of the model . . . 66
4.3 Result and discusions . . . 67
4.4 Conclusion . . . 107
5 Self-consistent and mean eld theory for conned branching cytoskeletal networks 109 5.1 Introduction . . . 109
5.2 Density distributions . . . 116
5.3 Results and discussion . . . 120
5.4 Conclusion . . . 138
III Contribution of conned branching cytoskeletal actin networks
to the mechanical properties of tissue cells.
139
6 From structural equilibrium properties of actin networks to the elastic stability of cells 140 6.1 Introduction . . . 1406.2 Stability and force balance of branching actin networks conned by rigid cell wall 142 6.3 Networks growing inside cells with elastic membrane . . . 146
6.4 Are our tissue cells stable against shear? . . . 160
6.5 Conclusion . . . 168
7 Modelling of cells as a reinforced composite material: an alternative mean eld approach 171 7.1 Introduction . . . 171
7.2 Green function formalism: bre-bre and bre-matrix Interactions . . . 171
7.3 Calculation of the eective elastic Green of the system of elastic cell reinforced by a composite of star bers . . . 179
CONTENTS ix
8 Conclusion and outlook 193
8.1 Conclusion . . . 193
A Details for calculations in chapters 196
A.1 Denitions of a functional and functional derivative . . . 196 A.2 Density and order proles for branching actin networks conned in others
ge-ometries . . . 202 A.3 Semiexible laments under compressive forces: Derivation of equation (6.33) . . 206 A.4 Cell as ber reinforced composite material . . . 208
List of Figures
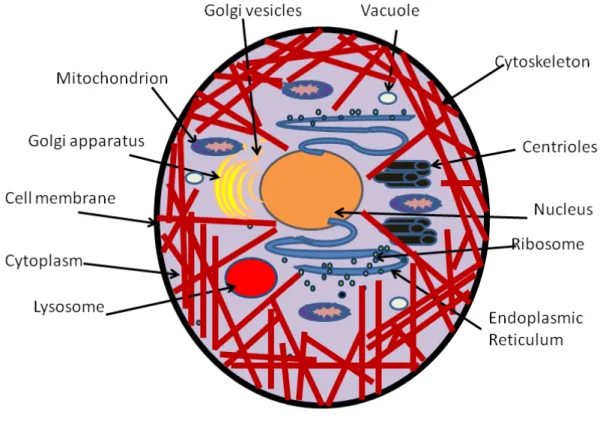
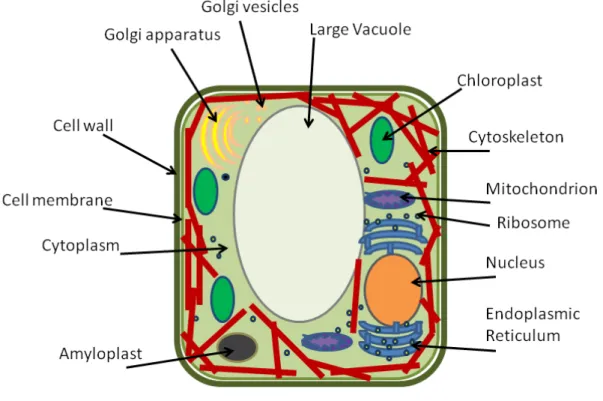
1.1 Depiction of an eukariotic cell of animals showing its dierents components. . . 7 1.2 Depiction of an eukariotic cell of plants showing its dierents components.. . . 8 1.3 Image of eukaryotic cells cytoskeleton (Wikipedia). The networks in red represent
the actin networls, in green we have the microtubule, the nucleus is reported in blue in the middle of the cytoskeleton. . . 9 1.4 Cartoon of the cell cytoskeleton. The cartoon shows more clearly some of the
dif-ferents components of the cell cytoskeleton. The laments in red color are actin laments (A), microtubules (M) are in green and the intermediate laments are in black (IF) , the violet dots are the Arp2/3 protein complex, and motor proteins in orange color (MM). Actin network present a highly branched architecture at the leading edge of the cell called lamellipodium. The Arp2/3 protein complex are the nucleotors of the branching. We have the nucleus in the middle (which is not part of the cytoskeleton) . . . 10 1.5 Intermediate lament modelled as freely jointed exible polymer of N monomers.
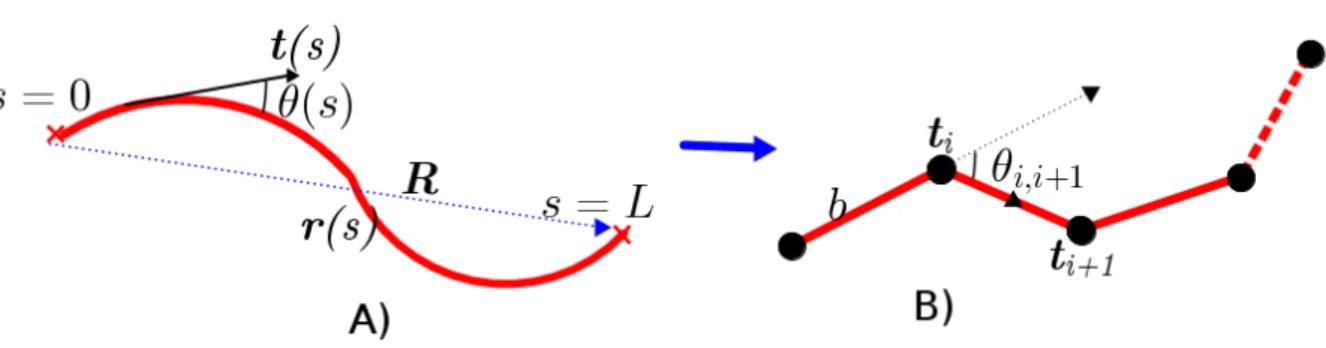
aaai =RRRi−RRRi−1 are the chain bond vectors with size |aaai| where RRR is the end-to-end vector of the chain. . . 12 1.6 Actin modelled as semiexible polymer. A)r(s)r(s)r(s)is the space curve of the chain where
s is the arc length of the lament,RRR the end-to-end vector of the chain. ttt(s) is the
tangent unit vector at arc lengthsof the chain and the angleθ(s)is the angle between
pair of tangent vectors of the chain. B) Discrete version of semiexible chains. The chain is described as made up of consecutive connection of monomers or segments where each segment is of length b and orientationttti, the tangent unit vector. . . 13 1.7 Microtubule modelled as rigid polymer. . . 14
LIST OF FIGURES xi 2.1 Depiction of a grown semiexible polymer chain of ordered monomers or bonds in
the ensemble. The monomers or bonds that belongs to the chain are in red colour. Each monomer has two ends with the starting end starting at a positionrrr and the
other end at positionrrr0 and each end has an orientationnnˆn. G is the propagator or
the Green function that characterises the segments of the chain as straight line of size ` and ensure that both ends of a segment have the same orientation. z is the
monomer activity called fugacity and w is the Boltzmann weight factor associated
to the pairwise bending stiness between monomers of the chain. The red dots are the starting points of each monomer or bond of the chain and the dots in brown colour are the starting points of neighbours monomers. . . 24 2.2 Visual depiction of the action of the propagator G. G applies to each segment of the
semiexible chain and transform it into a straight segment of length ` (rrr0i =rrri+`ˆnnni) and orientationnnnˆ= ˆnnni = ˆnnn0i. . . 25 2.3 Depiction of a semiexible chain of one bond. The monomer of the chain is in
red colour. It has two ends with the starting end starting at a position rrr and the
other end at position rrr0 and each end has an orientation nnnˆ. G is the propagator or
the Green function that characterises the segments of the chain as straight line of size ` and ensure that both ends of a segment have the same orientation. z is the
monomer activity called fugacity and wis the Boltzmann weight factor associated to
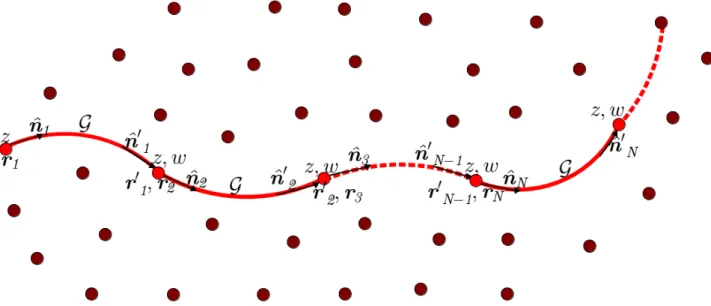
the pairwise bending stiness between monomers of the chain. The red dots are the starting points of each monomer or bond of the chain and the dots in brown colour are the starting points of neighbours monomers. . . 25 2.4 Depiction of a semiexible chain of two bonds. . . 26 2.5 Depiction of a semiexible chain consisting of N bonds. The monomers or bonds
that belongs to the chain are in red colour. Each monomer has two ends with the starting end starting at a positionrrr and the other end at positionrrr0 and each end
has an orientation nnnˆ. G is the propagator or the Green function that characterises
the segments of the chain as straight line of size ` and ensure that both ends of a
segment have the same orientation. z is the monomer activity called fugacity andw
is the Boltzmann weight factor associated to the pairwise bending stiness between monomers of the chain. The red dots are the starting points of each monomer or bond of the chain and the dots in brown colour are the starting points of neighbours monomers. . . 26 2.6 Diagram for linear Ψ function. The cross circles on this diagram are the roots of
the chains and we do not integrate over the position and oriention of the root. It indicates that a lament can grow starting from the root. We distinguish the root from the leave due to the fact that laments are oriented. . . 33
LIST OF FIGURES xii 2.7 Diagram for linear Φ function. The cross circles on this diagram are the leaves of
the chains and we do not integrate over the position and oriention of the leaves. It indicates that a lament can grow starting from the the leave. . . 33 2.8 A very long semiexible polymer chain discretized like a freely jointed chain on a 2D
triangular lattice. The black dots represent the monomers (bonds) positions and the red segments along vectors ttt represente the monomers orientations . . . 36
2.9 Plot of the persistence length of a polymer chain living on the 3D cubic plus digonals lattice as function of . . . 39
3.1 Depiction of the growth and branching of the actin lements via the Arp2/3 protein complex inside a spherical cell with rigid membrane. We have inside the sphere which we represent here on the gure by a circular shape in black, G-actin monomers in red that link linearly and form a linear lament with orientationnnnˆ. The model and
formalism we have introduced in Chapter 3 of this thesis applies to the linear actin chain formation. Inside the sphere, we have also branching actin laments. As the lament grows in the directionnnnˆ, the Arp2/3 in violet protein complex attach to the
lament and nucleate the binding of the G-actin monomer in orientation nnnˆ0 leading
to the growth of new lament on existing one at 70◦ angle. The arrow with the
plus indicate the adding of G-actin monomer at the actin lament growing end to ensure its linear elongation or at the top of the Arp2/3 protein at the side of the old lament to ensure the growth of the branching lament. A branching or tree-like network thus grows and possibly lls the conning spherical cell. . . 44 3.2 Mathematical representation of a grown branching actin network. It contains various
congurations of branched laments and linear laments. The monomers or bonds that belongs to the chain of the networks are in red color. Each monomer has two ends with the starting end starting at a position rrr and the other end at position rrr0 and each end has an orientation nnnˆ. G is the propagator or the Green function
that characterises the segments of the chain as straight line of size` and ensure that
both ends of a segment have the same orientation. z is the monomer activity called
fugacity and w is the Boltzmann weight factor associated to the pairwise bending
stiness between monomers of the chain. The red dots are the starting points of each monomer or bond of the chain and the dots in brown colour are the starting points of neighbours monomers. The proteins in violet represent the binding proteins (Arp2/3 protein complex) that ensure the branching of the laments . . . 45
LIST OF FIGURES xiii 3.3 Depiction of a branched lament consisting of 3 bonds. The monomers or bonds
that belongs to the chain of the networks are in red color. Each monomer has two ends with the starting end starting at a position rrr and the other end at position rrr0 and each end has an orientation nnnˆ. G is the propagator or the Green function
that characterises the segments of the chain as straight line of size` and ensure that
both ends of a segment have the same orientation. z is the monomer activity called
fugacity and w is the Boltzmann weight factor associated to the pairwise bending
stiness between monomers of the chain. The red dots are the starting points of each monomer or bond of the chain and the dots in brown colour are the starting points of neighbours monomers. The proteins in violet represent the binding proteins (Arp2/3 protein complex) that ensure the branching of the laments . . . 47 3.4 Depiction of a branched lament consisting of 4 bonds. The monomers or bonds
that belongs to the chain of the networks are in red colour. Each monomer has two ends with the starting end starting at a position rrr and the other end at position rrr0 and each end has an orientation nnnˆ. G is the propagator or the Green function
that characterises the segments of the chain as straight line of size` and ensure that
both ends of a segment have the same orientation. z is the monomer activity called
fugacity and w is the Boltzmann weight factor associated to the pairwise bending
stiness between monomers of the chain. The red dots are the starting points of each monomer or bond of the chain and the dots in brown colour are the starting points of neighbours monomers. The proteins in violet represent the binding proteins (Arp2/3 protein complex) that ensure the branching of the laments . . . 48 3.5 Depiction of a branched lament consisting of 6 bonds. The monomers or bonds
that belongs to the chain of the networks are in red color. Each monomer has two ends with the starting end starting at a position rrr and the other end at position rrr0 and each end has an orientation nnnˆ. G is the propagator or the Green function
that characterises the segments of the chain as straight line of size` and ensure that
both ends of a segment have the same orientation. z is the monomer activity called
fugacity and w is the Boltzmann weight factor associated to the pairwise bending
stiness between monomers of the chain. The red dots are the starting points of each monomer or bond of the chain and the dots in brown colour are the starting points of neighbours monomers. The proteins in violet represent the binding proteins (Arp2/3 protein complex) that ensure the branching of the laments . . . 49
LIST OF FIGURES xiv 3.6 Depiction of a branched lament consisting of N bonds. The monomers or bonds
that belongs to the chain of the networks are in red color. Each monomer has two ends with the starting end starting at a position rrr and the other end at position rrr0 and each end has an orientation nnnˆ. G is the propagator or the Green function
that characterises the segments of the chain as straight line of size` and ensure that
both ends of a segment have the same orientation. z is the monomer activity called
fugacity and w is the Boltzmann weight factor associated to the pairwise bending
stiness between monomers of the chain. The red dots are the starting points of each monomer or bond of the chain and the dots in brown colour are the starting points of neighbours monomers. The proteins in violet represent the binding proteins (Arp2/3 protein complex) that ensure the branching of the laments. . . 50 3.7 Diagrammatic represention of the grand canonical partition functionZfor branching
cytoskeletal networks. . . 54 3.8 Diagram for Ψfunctional . . . 54
3.9 Diagram for Φfunctional . . . 55
3.10 example of conguration of branching network on 2d triangular lattice. We have the lattice sites that are in the conning domain in black and those out of the conning domain in grey. The polymer chain bonds are in red and their orientation in blue. 59 4.1 Prole of the circular conning region in the absence of any actin polymer chain. . . 68 4.2 The graph is the three dimensional plot of the density prole of the actin networks
dominated by short laments (L < D) with little branching conned in sphere. This
type of network is modelled in 2d and obtained for growth or chain elongation pa-rameter z0 = 0.5 values, and for the branch formation parameter ζ0 = 0.001. We
observe a convex-shaped density distribution of the chain segments with a plateau towards the middle of the sphere. . . 69 4.3 Three dimensional plots of the density proles of network segments for ζ0 = 0.001
and values, z0 = 0.6. Here we still have the networks dominated by short laments
(L < D). However the laments are longer and a high concentration of chain
seg-ments is observed in the middle of the sphere (higher than the one we have obtained in Figure 4.2). We observe a distribution of lament segments with higher density in the centre of spherical conning cell. . . 70 4.4 Plot of the densty prole of segments through the centre of the sphere inxdirection of
the network dominated by short linear laments (L < D) modelled on 2d triangular
lattice. The laments elongation and branching parameter values are z0 = 0.5 and ζ0 = 0.001. The inset is a cartoon representing the spherical geometry conning the
network of actin laments in red on the graph and it is there to illustrate the type of the networks for which the this density prole is obtained. . . 71
LIST OF FIGURES xv 4.5 Plot of the densty prole of segments throught the centre of the sphere inx direction
of the network dominated by short linear laments (L < D) modelled on 2d
triangu-lar lattice. The prole of the network we show is obtained for laments elongation and branching parameter values z0 = 0.6 and ζ0 = 0.001. . . 71
4.6 Three dimensional plot of the density prole of the segments of the networks in which the length of the laments are comparable to the seize of the conning region (L ∼ D). We plot this density prole for ζ0 = 0.001 and z0 = 0.69. The small dip
in the middle of the density prole suggessts a decrease of segment distribution in the centre of the sphere. . . 73 4.7 Density prole through the centre of the sphere in x direction of the segments of the
networks in which the length of the laments are equal to the seize of the conning region (L∼D). We plot this density prole forζ0 = 0.001 andz0 = 0.69. The small
dip in the middle of the density prole suggessts a decrease of segment distribution in the centre of the sphere. The inset is a cartoon representing the spherical geometry conning the network of actin laments in red on the graph and it is there to illustrate the type of the networks for which the this density prole is obtained. . . 74 4.8 Three dimensional plot of the density prole of the segments of the networks
dom-inated by long linear laments with little branching. The length of the laments in this networks are greater than the seize of the conning region (L > D). We plot
this density prole for ζ0 = 0.001 and z0 = 0.75. We observe a huge decrease of the
average density of segments in the middle of the spheres while the prole shows a high density distrisbution at the periphery of the conning spherical cell. . . 75 4.9 Graph of the density prole of the segments of the networks dominated by long linear
laments with few branching through the centre of the sphere in x direction. The length of the linear laments are greater than the seize of the conning region (L > D). We plot this density prole for ζ0 = 0.001 and z0 = 0.75. We observe a huge
decrease of the average density of segments in the middle of the spheres while the prole shows a high density distribution at the periphery of the conning spherical cell. The inset is a cartoon representing the spherical geometry conning the network of actin laments in red on the graph and it is there to illustrate the type of the networks for which the this density prole is obtained. It shows the laments of the networks wrapped around the cell. This drawing becomes more understandable when we look at the radial order parameter eld prole of this type of networks in the Figure 4.23. . . 76 4.10 Three dimensional plot of the density prole of the segments of the branched
net-works. It is obtained for (1−z0)2 ∼ 4ζ0. We plot this density prole for ζ0 = 0.06
and z0 = 0.516. We observe a huge decrease of the average density of segments in
the middle of the spheres while the prole shows a high density distribution at the periphery of the conning spherical cell. . . 77
LIST OF FIGURES xvi 4.11 Graph of the density prole of the segments of a branched network through the
cen-tre of the sphere in x direction. It is obtained for (1−z0)2 ∼ 4ζ0. We plot this
density prole for ζ0 = 0.06 and z0 = 0.516. The prole shows a high increase of
the average density of segments as we go from the centre to the periphery of the conning spherical cell suggesting an inhomogeneous distribution of chain segments of the branched conned networks. The inset is a cartoon representing the spherical geometry conning the network of actin laments in red on the graph and it is there to illustrate the type of the networks for which the this density prole is obtained. It shows the laments of the networks that are highly branched at the vicinity of the cell and pointing straight to the cell membrane and with very few bent laments at the edge. This drawing becomes more understandable when we look at the radial order parameter eld prole of this type of networks in the Figure 4.25. . . 78 4.12 The graph is the three dimensional plot of the density prole of 3d actin networks
dominated by short laments (L < D) with few branching conned in sphere. It
is obtained for growth or chain elongation parameter z0 = 0.31 values, and for
the branch formation parameter ζ0 = 0.001. We observe a convex-shaped density
distribution of the chain segments with a plateau in the middle of the sphere. . . . 79 4.13 Plot of the density prole of segments through the centre of the sphere inx direction
of the 3d network dominated by short linear laments (L < D) modelled on 3d
triangular lattice. The laments elongation and branching parameter values are
z0 = 0.31andζ0 = 0.001. The inset is a cartoon representing the spherical geometry
conning the network of actin laments in red on the graph and it is there to illustrate the type of the networks for which the this density prole is obtained. . . 80 4.14 Three dimensional plot of the density prole of the segments of the networks
dom-inated by long linear laments with few branching. The length of the laments in this networks are greater than the seize of the conning region (L > D). We plot
this density prole for ζ0 = 0.00001 and z0 = 0.71. We observe a huge decrease of
the average density of segments in the middle of the spheres while the prole shows a high density distrisbution at the periphery of the conning spherical cell. . . 81
LIST OF FIGURES xvii 4.15 Graph of the density prole of the segments of the networks dominated by long linear
laments with few branching through the centre of the sphere in x direction. The length of the linear laments are greater than the size of the conning region (L > D). We plot this density prole for ζ0 = 0.00001 and z0 = 0.71. We observe a huge
decrease of the average density of segments in the middle of the spheres while the prole shows a high density distribution at the periphery of the conning spherical cell. The inset is a cartoon representing the spherical geometry conning the network of actin laments in red on the graph and it is there to illustrate the type of the networks for which the this density prole is obtained. It shows the laments of the networks wrapped around the cell. This drawing becomes more understandable when we look at the radial order parameter eld prole of this type of networks in the Figure 4.29. . . 82 4.16 Three dimensional plot of the density prole of the segments of the branched
net-works. It is obtained for(1−z0)2 ≥4ζ0 . We plot this density prole for ζ0 = 0.0049
and z0 = 0.5. We observe a huge decrease of the average density of segments in the
middle of the spheres while the prole shows a high density distribution at the pe-riphery of the conning spherical cell. . . 83 4.17 Graph of the density prole of the segments of a branched network through the
cen-tre of the sphere in x direction. It is obtained for (1−z0)2 > 4ζ0. We plot this
density prole for ζ0 = 0.0049 and z0 = 0.5. The prole shows a high increase of
the average density of segments as we go from the centre to the periphery of the conning spherical cell suggesting an inhomogeneous distribution of chain segments of the branched conned networks. The inset is a cartoon representing the spherical geometry conning the network of actin laments in red on the graph and it is there to illustrate the type of the networks for which the this density prole is obtained. It shows the laments of the networks that are highly branched at the vicinity of the cell and pointing straight to the cell membrane. This drawing becomes more understand-able when we look at the radial order parameter eld prole of this type of networks in the Figure 4.31. . . 84 4.18 Three dimensional plot of the radial order parameter eld prole of the 2d actin
networks dominated by short laments (L ≤ D) with few branching under sperical
connement. It is obtained for growth or chain elongation parameterz0 = 0.5values,
and for the branch formation parameterζ0 = 0.001. The graph shows a positive order
parameter prole at the vicinity of the spherical cell indicating a parallel alignment of segments that are close to the wall while the order prole toward the centre of the cell is 0. This indicates that the laments are isotropically distributed in the middle of the sphere. . . 87
LIST OF FIGURES xviii 4.19 Plot of radial order parameter eld prole of segments throught the centre of the
sphere in x direction of 2d networks dominated by short linear laments (L≤ D )
modelled on 2d triangular lattice. The laments elongation and branching parameter values are z0 = 0.5andζ0 = 0.001. The inset is a cartoon representing the spherical
geometry conning the network of actin laments in red on the graph and it is there to illustrate the type of the networks for which the radial order parameter eld prole is obtained. . . 88 4.20 Three dimensional plot of the radial order parameter eld prole of the networks
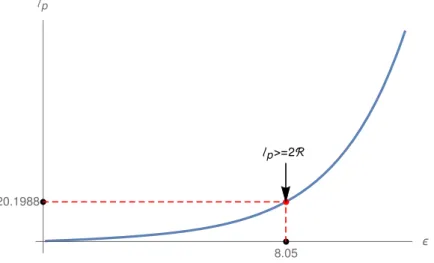
with comparable length scales (L ∼ D ∼ `p). The prole we present here obtained
for z0 = 0.69 and ζ0 = 0.001. The order eld is positive at the very edge of the cell,
negative as we move towards the centre and 0 in the middle. . . 89 4.21 Plot of radial order parameter eld prole of segments throught the centre of the
sphere in x direction of the networks with comparable length scales (L ∼ D ∼ `p).
The prole we present is obtained for z0 = 0.69 and ζ0 = 0.001. The inset is a
cartoon representing the spherical geometry conning the network of actin laments in red on the graph and it is there to illustrate the type of the networks for which the radial order parameter eld prole is obtained. . . 90 4.22 The graph of the three dimensional plot of the order parameter eld prole of 2d
networks dominated by long linear laments L > D. The graph is obtained for z0 = 0.75 and ζ0 = 0.001. The order parameter eld is positive at the periphery of
conning region while 0 in the centre of the sphere. This indicates that long linear laments bend and wrap around the cell while the few shorter laments that are in the middle of the cell are isotropically distributed. . . 91 4.23 Plot of radial order parameter eld prole of segments through the centre of the
sphere in x direction. This graph of the of 2d networks dominated by long linear
actin laments is obtained for z0 = 0.75 and ζ0 = 0.001. The inset is a cartoon
representing the spherical geometry conning the network of actin laments in red on the graph and it is there to illustrate the type of the networks for which the radial order parameter eld prole is obtained. . . 92 4.24 Radial order parameter eld prole of 2d branched networks plotted in three
dimen-sion. The prole we show is obtained forz0 = 0.516andζ0 = 0.06. We have negative
order parameter eld with very small positive values at the vicinity of the cell. This indicate that laments of segments of the branched networks align perpendicular or point straight to the conning. Only very few lament bent. The chain segments are isotropically distributed in the middle of the sphere. . . 93
LIST OF FIGURES xix 4.25 Plot of radial order parameter eld prole of 2d branched networks segments through
the centre of the sphere in x direction. The graph is obtained for z0 = 0.516 and ζ0 = 0.06. The inset is a cartoon representing the spherical geometry conning the
network of actin laments in red on the graph and it is there to illustrate the type of the networks for which the radial order parameter eld prole is obtained. . . 94 4.26 Three dimensional plot of the radial order parameter eld prole of the 3d actin
networks dominated by short laments (L ≤ D) with few branching under sperical
connement. It is obtained for growth or chain elongation parameter z0 = 0.31
values, and for the branch formation parameter ζ0 = 0.001. The graph shows a
pos-itive order parameter prole at the vicinity of the spherical cell indicating a parallel alignment of segments that are close to the wall while the order prole toward the centre of the cell is 0. It indicates that the laments are isotropically distributed in the middle of the sphere. . . 95 4.27 Plot of radial order parameter eld prole of segments through the centre of the sphere
in x direction of 3d networks dominated by short linear laments (L ≤ D). The
laments elongation and branching parameter values are z0 = 0.31 and ζ0 = 0.001.
The inset is a cartoon representing the spherical geometry conning the network of actin laments in red on the graph and it is there to illustrate the type of the networks for which the radial order parameter eld prole is obtained. . . 96 4.28 The graph of the three dimensional plot of the order parameter eld prole of 3d
networks dominated by long linear laments L > D. The graph is obtained for z0 = 0.71andζ0 = 0.00001. The order parameter eld is positive at the periphery of
conning region while 0 in the centre of the sphere. This indicates that long linear laments bend and wrap around the cell while the few shorter laments that are in the middle of the cell are isotropically distributed. . . 97 4.29 Plot of radial order parameter eld prole of segments through the centre of the
sphere in x direction. This graph of the of 3d networks dominated by long linear
actin laments is obtained for z0 = 0.71 and ζ0 = 0.00001. The inset is a cartoon
representing the spherical geometry conning the network of actin laments in red on the graph and it is there to illustrate the type of the networks for which the radial order parameter eld prole is obtained. . . 98 4.30 Radial order parameter eld prole of 3d branched networks plotted in three
dimen-sions. The prole we show is obtained for z0 = 0.5 and ζ0 = 0.0049. We have
negative order parameter eld at the vicinity of the cell and 0 order close and in the middle of the conning sphere. This indicate that all laments of 3d branched networks align perpendicular or point straigh to the conning sphere. The chain segments are isotropically distributed in the middle of the sphere. . . 99
LIST OF FIGURES xx 4.31 Plot of radial order parameter eld prole of 3d branched networks segments through
the centre of the sphere in x direction. The graph is obtained for z0 = 0.5 and ζ0 = 0.0049. The inset is a cartoon representing the spherical geometry conning
the network of actin laments in red on the graph and it is there to illustrate the type of the networks for which the radial order parameter eld prole is obtained. . . 100 4.32 Phase diagrams (ζ0, z0) for 2d networks. It shows the domains of the three studied
type of networks. The number densities of laments segments are plotted as we vary the lament elongation parameter z0 and the branching parameterζ0. On this phase
diagram, the yellow dots zone corresponds to the domain of the branching networks that are dominated by short actin laments with few branching. The black triangle domain is mainly composed of long linear actin chains formation with few branching. In the red squares domain, we have very branched networks. The points of the line separating the dierent domain correspond to (ζ0, z0) values for which we obtain
the transition networks. The blue zone indicate the domain in which our numerical result is valid (domain of validity) given by the equation (4.3). . . 102 4.33 Phase diagrams (ζ0, z0) for 3d networks. It shows the domains of the three studied
types of networks. The number densities of laments segments are plotted as we vary the lament elongation parameter z0 and the branching parameter ζ0. On this
phase diagram, the yellow dots zone corresponds to the domain of the branching networks that are dominated by short actin laments with few branching. The black triangle domain is mainly composed of long linear actin chains formation with few branching. In the red squares domain, we have very branched networks. The points of the line separating the dierent domain correspond to (ζ0, z0) values for which
we obtain the transition networks. The blue zone indicate the domain in which our numerical result is valid (domain of validity) given by the equation (4.3). . . 103 4.34 Plot of the polarization for the eld η = 0. It shows the direction in which the
networks grow in the absence of external eld. The networks grow from the centre towards the boundary of the conning cell. . . 105 4.35 The polarization of the branching networks in the presence of the external eld, with
η= 0.4. We observe that the networks grow in the orientation of the external eld. 105
4.36 Plot of the response of the networks as function ofη and for three dierent growth
parameter z0 values, ζ0 being xed at 0.1. The sharp changes in the curves is
correspond to the valueη for which our numerical calculation diverges. . . 106
4.37 Plot of the response of the networks as function ofηand for three dierent stiness ζ0 values, z0 being xed at 0.2. The sharp changes in the curves is correspond to
LIST OF FIGURES xxi 5.1 Graph of the density prole of the branched actin networks conned in a spherical
cell without any mutual monomers interactions, V0 = 0.0. z = 0.516 and ζ = 0.06.
The density prole shows a deection near the centre of the sphere meaning that the lament segments of the network inside the conning sphere are inhomogeneously distributed. We have a hight density at the cell periphery and a low distribution as we go from the vicinity of the cell to the middle of the cell. The inset is a cartoon representing the spherical geometry conning the network of actin laments in red on the graph and it is there to illustrate the type of the networks for which the this density prole is obtained. . . 121 5.2 Graph of the radial order parameter eld prole of the branched actin networks
conned in a spherical cell without any mutual monomers interactions,V0 = 0.0. z= 0.516and the branching parameter ζ = 0.06. The order parameter eld prole shows
that the lament branch and align radially to the cell wall i.e they point perpendicular to the cell wall or membrane. The inset is a cartoon representing the spherical geometry conning the network of actin laments in red on the graph and it is there to illustrate the type of the networks for which the this density prole is obtained. . 121 5.3 Graph of the density prole of the branched actin networks conned in a spherical
cell in the presence of attractive mutual monomers interaction potential with strength
V0 =−1, z0 = 0.516 and ζ0 = 0.06. The deection in the middle of the prole of the
density has decreased meaning that in the presence of the small attractive interactions between monomers, the laments concentrated initially close to the cell membrane attract each other and start becoming homogeneously distributed. . . 122 5.4 Graph of the radial order eld prole of the branched actin networks conned in a
spherical cell in the presence of attractive mutual monomers interactions, V0 =−1.
The lament elongation parameter z = 0.515 and the branching parameter ζ = 0.06.
The order parameter eld prole becomes positive on average. The graph shows that the laments of branched networks close to the cell membrane have preference of aligning parallel to the cell wall as we introduce a small attractive interaction while the laments near the centre stay radial or perpendicular to the wall. This prole is similar to the prole of the networks with comparable length scales (L∼D∼`p). . . 122
5.5 Graph of the density prole of the branched actin networks conned in a spherical cell at high attractive interaction strength |V0|, V0 = −5. The lament elongation
parameter z = 0.516 and the branching parameter ζ = 0.06. Here the density prole
of lament segments of the branched networks becomes relatively at near the centre of the spherical cell at high attractive interaction potential strength. . . 123
LIST OF FIGURES xxii 5.6 Graph of the radial order eld prole of the branched actin networks conned in a
spherical cell at high attractive interaction strength |V0|, V0 = −5. The lament
elongation parameter z = 0.515 and the branching parameter ζ = 0.06. The order
parameter eld prole become on average positive at the cell periphery and isotropic in the middle of the conning cell meaning that laments close to the cell membrane or wall wrap arround the cell edges. . . 123 5.7 Graph of the density prole of the branched actin networks conned in a spherical
cell in the presence of repulsive interaction with strengthV0 = 0.00098. The lament
elongation parameterz = 0.516and the branching parameter ζ = 0.06. At this value
of interaction strength V0 >0, the lament segments of the branched networks start
becoming more concentrate near the centre of the sphere while less close to cell wall. This suggest that the laments or the lament segments repel from the cell membrane and occupy the middle of the sphere. . . 124 5.8 Graph of the radial order eld prole of the branched actin networks conned in a
spherical cell as we increase the interaction strength V0 > 0, V0 = 0.00098. The
lament elongation parameter z = 0.515 and the branching parameter ζ = 0.06. At
this value interaction strength, the order parameter eld prole become positive near the centre and stay negative close the cell membrane. So, the lament segments that are near the centre align parallel to the membrane while those close to membrane stay perpendicular to the cell membrane. . . 124 5.9 Graph of the density prole of the branched actin networks conned in a spherical
cell in the presence of interaction with strength V0 = 0.001. The lament
elonga-tion parameter z = 0.516 and the branching parameter ζ = 0.06. At this value of
interaction strength, the lament segments of the branched networks show a high concentration of the lament segments near the centre of the sphere while very little close to cell wall. This suggest that most of the conned laments or the lament segments of the network occupy the middle of the sphere. . . 125 5.10 Graph of the radial order eld prole of the branched actin networks conned in
a spherical cell as we increase the repulsive interaction strength, V0 = 0.001. The
lament elongation parameter z = 0.515 and the branching parameter ζ = 0.06. At
this value of interaction strength V0 >0, the order parameter eld prole become on
average positive. It indicates that the lament segments at high concentration near the centre are aligned parallel to the membrane only very few stay perpendicular or radial to the cell membrane. . . 125
LIST OF FIGURES xxiii 5.11 Graph of the density prole of the branching actin networks dominated by long linear
laments conned in a spherical cell without any mutual monomers interactions,
V0 = 0. z = 0.75 and ζ = 0.0016. The density prole shows a deection near the
centre of the sphere meaning that the lament segments of the network inside the conning sphere are inhomogeneously distributed. We have a hight density at the cell periphery and a low distribution as we go from the vicinity of the cell to the middle of the cell. The inset is a cartoon representing the spherical geometry conning the network of actin laments in red on the graph and it is there to illustrate the type of the networks for which this density prole is obtained. . . 127 5.12 Graph of the radial order paramenter eld prole of the branching actin networks
dominated by long linear laments conned in a spherical cell without any mutual monomers interactions, V0 = 0. z = 0.75 and ζ = 0.001. The order parameter eld
is positive at the periphery of conning region while 0 in the centre of the sphere. This indicates that long linear laments bend and wrap around the cell while the few shorter laments that are in the middle of the cell are isotropically distributed. The inset is a cartoon representing the spherical geometry conning the network of actin laments in red on the graph and it is there to illustrate the type of the networks for which the this density prole is obtained. . . 127 5.13 Graph of the density prole of the branching actin networks dominated by long linear
laments conned in a spherical cell in the presence of attractive monomers inter-actions potential with strength V0 = −1. z = 0.75 and ζ = 0.001. The deection
in the middle of the prole of the density has decreased meaning that the networks segments are becoming homogeneously distributed inside the cell. . . 128 5.14 Graph of the radial order eld prole of the branched actin networks conned in a
spherical cell at high attractive interaction strength |V0|, V0 = −1. z = 0.75 and ζ = 0.001. The order parameter eld prole near the centre of the sphere becomes
negative while positive near the cell wall indicating that there is a competition between parallel and perpendicular alignment of the laments. This prole is similar to the prole of the networks with comparable length scales (L∼D∼`p). . . 128
5.15 Graph of the density prole of the branching actin networks dominated by long linear laments conned in a spherical cell in the presence of attractive monomers inter-actions potential with strength V0 = −5. z = 0.75 and ζ = 0.001. The prole of
the density of segments shows that the network segments becomes more dense near the centre of the cell. This prole is similar to the density prole of the networks dominated by short laments. . . 129
LIST OF FIGURES xxiv 5.16 Graph of the radial order eld prole of the branched actin networks conned in a
spherical cell at high attractive interaction strength |V0|, V0 = −5. z = 0.75 and ζ = 0.001. The order parameter eld prole is positive close to spherical cell wall
or membrane and 0 near the centre indicating that lament segments near the cell membrane align parallel to the membrane and those near the centre are isotropically distributed. . . 129 5.17 Graph of the density prole of the branched actin networks conned in a spherical
cell at high attractive interaction strength |V0|, V0 = 0.001. The lament elongation
parameter z = 0.75 and the branching parameter ζ = 0.001. Here the density of
lament segments of the branched networks is convex-shaped at high short-range aligning interaction. . . 131 5.18 Graph of the density prole of the branching actin networks dominated by long linear
laments conned in a spherical cell in the presence of attractive monomers inter-actions potential with strength V0 = 0.001. z = 0.75 and ζ = 0.001. The order
parameter eld prole is positive. This shows that the long linear laments with actin monomers mutual interactions stay wrapped around the cell. We predict that this is due to the fact that, the repulsive forces between monomers sum up to the re-pulsive force from the cell membrane to keep the long linear laments of the networks bent in order to minimize the free energy of the system. . . 131 5.19 Graph of the density prole of networks dominated by short laments conned in a
spherical cell without any mutual monomers interactions i.e here we set the interact-ing potential to 0 (V0 = 0). z = 0.5 and ζ = 0.001. We have relatively at average
density distribution of network segments near the centre of the spherical cell. The inset is a cartoon representing the spherical geometry conning the network of actin laments in red on the graph and it is there to illustrate the type of the networks for which the this density prole is obtained. . . 133 5.20 Graph of the radial order eld prole of networks dominated by short laments
con-ned in a spherical cell without any mutual monomers interactions i.e here we set the interacting potential to 0 (V0 = 0). The lament elongation parameter z= 0.515
and the branching parameter ζ = 0.06. The order parameter eld prole shows that
the laments that are close to the cell wall are aligned parallel to it while those near the centre of the conning sphere are isotropically distributed. . . 133 5.21 Graph of the density prole of networks dominated by short laments conned in a
spherical cell in the presence of V0 <0mutual monomers interactions withV0 =−5. z = 0.5 and ζ = 0.001. We have convex-shaped average density distribution of
the network segments. There is no signicant change compared to the case of no monomers mutual interactions. . . 134
LIST OF FIGURES xxv 5.22 Graph of the radial order eld prole of networks dominated by short laments
con-ned in a spherical cell in the presence of attractive mutual monomers interactions with V0 = −5. The lament elongation parameter z = 0.515 and the branching
pa-rameter ζ = 0.06. The order parameter eld prole shows that the laments that are
close to the cell wall are aligned parallel to it while the laments close to the centre are isotropically distributed. The networks is thus not inuenced by the presence of the V0 <0 interaction between laments segments. . . 134
5.23 Graph of the density prole of networks dominated by short laments conned in a spherical cell in the presence of repulsive mutual monomers interactions with V0 = 13. z = 0.5 and ζ = 0.001. We have homogeneous average density distribution
prole of the network segments. There is no signicant change compare to the case of no mutual interaction. . . 136 5.24 Graph of the radial order eld prole of networks dominated by short laments
con-ned in a spherical cell in the presence ofV0 >0mutual monomers interactions with V0 = 13. The lament elongation parameter z = 0.515 and the branching parameter ζ = 0.06. The order parameter eld prole shows that the laments that are close
to the cell wall are aligned parallel to it while the laments close to the centre are isotropically distributed. . . 136 6.1 2D Depiction of branched actin networks (in red) growing inside two square-shaped
cells separated by a rigid wall or membrane. Actin lament laments segment occupy the two triangular lattice. The black dots are the sites of the lattice and they indicate the position of the networks segments. The dots in grey are the lattice sites that are not occupied. The wall of the cells are in green. . . 142 6.2 Movable partition membrane. It can be interpreted as a piston between separating
the content of the two cells. Small displacement of this partition compresses the cytoskeletal networks at the right hands while the networks in the left cell lls the larger volume. . . 143 6.3 Plot of the Gibbs free energy of the system of branching cytoskeletal networks under
compressive strains. We have obtained this graph for the ratio between the persistence length of the laments and the square side length `p/L = 1.2, z0 = 0.54 and ζ0 = 0.064. We observe an the increase of Gibbs free energy meaning that the system is
stable against compressions. . . 144 6.4 Plot of the dierence in force between compressed and stretched cell as function strain
δ. The networks behave like spring under compression. . . 146
6.5 Plot of the young modulus of the networks, showing a slow variation as we increase the branching strength ζ. E(ζ) varies about7% from0.0512 to0.0530. . . 147
6.6 The wall of the cell in the x directions are semi-exible. State A: cell in the
LIST OF FIGURES xxvi 6.7 Graphs showing the work done by the branching actin networks and the cell
mem-brane. The result is obtained for `p/L= 1.2, z0 = 0.5andζ0 = 0.06. As we increase
the value of κ, the work done by both the network and the membrane quickly reach
the maximum without inducing signicant change in the cell membrane curvature. So the minimum energy cost for which the cell stay at equilibrium is obtained for large value of bending modulus κ. . . 150
6.8 This is the density prole of the networks through the centre of the cell for h0 = 0, κ= 100, `p/L= 1.2,z0 = 0.5 and ζ0 = 0.06. . . 150
6.9 Order eld of the networks for h0 = 0, κ= 100, `p/L= 1.2, z0 = 0.5 and ζ0 = 0.06. 150
6.10 density prole of the networks for h0 = 1,κ= 100,`p/L= 1.2,z0 = 0.5andζ0 = 0.06.151
6.11 Order eld of the networks for h0 = 1, κ= 100, `p/L= 1.2, z0 = 0.5 and ζ0 = 0.06. 151
6.12 density prole of the networks for h0 = 5,κ= 100,`p/L= 1.2,z0 = 0.5andζ0 = 0.06.151
6.13 Order eld of the networks for h0 = 5, κ= 100, `p/L= 1.2, z0 = 0.5 and ζ0 = 0.06. 151
6.14 density prole of the networks for h0 = 10, κ = 100, `p/L = 1.2, z0 = 0.5 and ζ0 = 0.06. . . 151
6.15 Order eld of the networks for h0 = 10, κ= 100, `p/L= 1.2,z0 = 0.5 and ζ0 = 0.06. 151
6.16 density prole of the networks for h0 = 15, κ = 100, `p/L = 1.2, z0 = 0.5 and ζ0 = 0.06. . . 152
6.17 Order eld of the networks for h0 = 15, κ= 100, `p/L= 1.2,z0 = 0.5 and ζ0 = 0.06. 152
6.18 density prole of the networks for h0 = 20, κ = 100, `p/L = 1.2, z0 = 0.5 and ζ0 = 0.06. . . 152
6.19 Order eld of the networks for h0 = 20, κ= 100, `p/L= 1.2,z0 = 0.5 and ζ0 = 0.06. 152
6.20 Tissue cells conning branching cytoskelatal networks: A) in unperturbed state, B) in perturbed state causing the membranes to bent in the two opposit directions of x
about h(y) leading to the increase of the size of a cell against its neighbour, C) Two
neighbouring deformed cells: stretched cell and compressed cell . . . 154 6.21 Shape of the cell with no network or chains. . . 154 6.22 Shape of the compressed cell with no chains, the cell is compressed by neighbour cells
leading it to take a concave shape. . . 154 6.23 Prole in the presence of laments in the convex cell. The graph is a three
dimen-sional representation of the density prole of the convex cell. . . 155 6.24 The graph is obtained for a concave cell in the presence of laments inside the cell.
It is a three dimensional representation of the average density prole of segments. . 155 6.25 Graph of the Gibbs free energy as a function of the amplitude of the bending
curva-ture. The graph shows an increase of the free energy as we increase the perturbation. So this type of deformation applied to of cell conning the branching networks does not impact on the stability of the cell and their networks within the tissue. Here
LIST OF FIGURES xxvii 6.26 Depiction of a collection of cells in which branching cytoskelatal lament network
is conned: A) unperturbed state, B) Cell are bent in the same direction under a compressive force. . . 156 6.27 The bent cell shape with no chains. . . 157 6.28 The density prole in three dimensional representation for`p/L= 1.2, z0 = 0.5and
ζ0 = 0.06, κ= 100 . . . 157
6.29 We plot the Gibbs free energy of the system of tissue cell bent or deformed in the same direction as function of the amplitude of the bending curvature. The graph shows that the cells are stable against the type of deformation. This calculation is obtained for `p/L= 1.2, z0 = 0.5 and ζ0 = 0.06, κ = 100 . . . 158
6.30 The graphs of pressure in the stretched cellPsc andPcc the pressure in the compressed cell. We obseve that, while the pressure is decreasing inside the stretched cell, it is highly increasing inside the compressed. This ensure the elastic stability of cells under compression with the tissue. . . 159 6.31 Dierence in force between the compressed and stretched cell as function of h. It
becomes non linear as the membrane curvature increases. The non ane response of the networks due to the eect of the membrane elasticity with. However, the compressed networks exhibit an elastic spring-like behaviour. . . 159 6.32 Total pressure exerted by a collection ofN cells deformed in the same direction. The
pressure decreases as the curvature of the bending amplitude increases. This can be explained by the fact that the bending of the cells in the same direction favour the network growth and branching in the direction which may lead to a non reversible deformation of the tissue. The decrease in system free energy thus pressure allows the tissue cells and their tissues to keep a nite size or shape. . . 160 6.33 Graph of the Young modulus of the network system (Figure 6.20 C)). The graph
shows a slow variation of the the Young modulus for the degree of branching param-eter ζ between 0 and 0.06. Beyong ζ = 0.06 the Young modulus increases strongly
and non anely , suggesting that beyond this value there is an excess branching of laments making the networks very sti. So this strong increase come from the increase of the networks stiness. And beyond ζ = 0.063 there is a failure in our
networks system, leading to divergence of our model. The non ane increase of the Young modulus may be due to the elastic behaviour of the cell membrane. . . 161 6.34 Depiction of the conned branching cytoskeletal networks inside square cell under
shear strain . . . 161 6.35 Prole of the non deformed square cell with no chains . . . 162 6.36 Prole of the shear square cell (rhombus cell) with no chains . . . 162 6.37 Three dimensional-representation or plot of the density prole of lament segments
LIST OF FIGURES xxviii 6.38 Three-dimensional representation of the density prole of lament segments conned
in square cell under shear, `p/L= 1.2, z0 = 0.5 and ζ0 = 0.06. . . 162
6.39 Graph of the free energy from numerical calculations for `p/L= 1.2, `p/d= 1.4 for
square and rectangular cell, z0 = 0.5 and ζ0 = 0.06. As the shear strain increases,
the free energy show the stability of the conned actin networks up to a value of strain of π/6. It means that there exists a transition between the stability and the
instability of the cell at shear angle π/6 . . . 163
6.40 we plot the prole of the average density of segments along the long diagonal versus short diagonal of the sheared square cell for`p/L= 1.2, z0 = 0.5and ζ0 = 0.06. The
graph in blue respectively red dots are the proles of the segments density distribution along the long diagonal respectively the short diagonal. We see an heterogeneous and high density of lament segments along the longer diagonals while the segment density is low along the shorter diagonals. laments are more dense close to the cell wall due to the laments branching . . . 164 6.41 The graph in blue respectively red are order parameter eld proles along the long
respectively short diagonal. The order proles show that lament branches and point perpendicular to the cell wall. . . 164 6.42 Depiction of semiexible lament pinned at both ends along the diagonal of sheared
square by compressive force due to the applied shear forcef, Lcis the contour length of the chain . . . 165 6.43 Depiction of two semi-exible laments conned along the diagonal of a square under
shear strain. We model the laments as springs where each lament has an eective spring coecient kef f . . . 167 6.44 Graph of the free energy from analytical calculations. We observe an instability of
the system occurring above a shear angle of π/4. . . 169
6.45 Red: eective bending modulus of the lament along the shorter diagonal of the box as function of shear angle. Green: eective bending modulus of the lament along the the longer diagonal of the box as function of shear angle. The graph of the bending rigidities shows that the eective bending rigidity of the lament along the shorter diagonal increases with increasing of the shear strain or shear angle up to a critical angle of π/4 then start decreasing. While the rigidity of the lament along
the longer diagonal decrease with increasing of the shear strain. This implies that the lament along the shorter lament contribute most to the free energy, ensuring thus the stability of the system. . . 169 7.1 a displacement of a bre-matrix composite under an external force . . . 172
LIST OF FIGURES xxix 7.2 An example of star-like branched semiexible polymer made up of four linear bre
or polymer chains is embeded in the cell matrix. n = ni are the units vectors of each lament in the star, laments are of same length and have one of their end connected at the same points forming thus a star lament with e = the centre
of mass of the star. s is the arclength, R(s) is the initial position of the star of
laments in the medium which undergo a displacement U(s)when an external force
is applied . . . 179 A.1 Three dimensional plot of the density prole of the segments of the branched
net-works. It is obtained for (1−z0)2 ∼ 4ζ0. We plot this density prole for ζ0 = 0.06
and z0 = 0.516. We observe a huge decrease of the average density of segments in
the middle of the square while the prole shows a high density distribution at the periphery of the conning square cell. . . 203 A.2 Radial order parameter eld prole of 2d branched networks plotted in three
dimen-sion. The prole we show is obtained forz0 = 0.516andζ0 = 0.06. We have negative
order parameter eld with very small positive values at the vicinity of the cell. This indicate that laments of segments of the branched networks align perpendicular or point straight to the conning. Only very lament bent. The chain segments are isotropically distributed in the middle of the square. . . 204 A.3 Three dimensional plot of the density prole of the segments of the branched
net-works. It is obtained for (1−z0)2 ∼ 4ζ0. We plot this density prole for ζ0 = 0.06
and z0 = 0.516. We observe a huge decrease of the average density of segments in
the middle of the square while the prole shows a high density distribution at the periphery of the conning triangular cell. . . 205 A.4 Radial order parameter eld prole of 2d branched networks plotted in three
dimen-sion. The prole we show is obtained forz0 = 0.516andζ0 = 0.06. We have negative
order parameter eld with very small positive values at the vicinity of the cell. This indicate that laments of segments of the branched networks align perpendicular or point straight to the conning. Only very lament bent. The chain segments are isotropically distributed in the middle of the triangular cell. . . 206 A.5 Descete description of the semi-exible lament, of contour length Lc. R is the
List of Tables
1.1 Table summarizing the dierent length scales of cytoskeletal laments. . . 12 4.1 For each couple of points (ζ0, z0), we calculate the total average number of bonds
hNi and the ratio r of the number of bonds that are involved in branching points
over the total number of the bonds of the networks modelled in 2d. The rst values in each cell stand for hNi and the second values are r . The bold values are the
values at which we start observing the inhomogeneity in the networks either because the the degree of branching has increased and thus the branching start increasing at the cell periphery or the laments are at transition points values (ζ0, z0) which
correspond to the points for which L=hNi=D. . . 85
4.2 For each couple of points (ζ0, z0), we calculate the total average number of bonds
hNi and the ratio r of the number of bonds that are involved in branching points
over the total number of the bonds of the networks modelled in 3d. The rst values in each cell stand for hNi and the second values are r . The bold values are the
values at which we start observing the inhomogeneity in the networks either because the the degree of branching has increased and thus the branching start increasing at the cell periphery or the laments are at transition points values (ζ0, z0) which
correspond to the points for which L=hNi=D. . . 85
4.3 Summary of the description of the phase diagrams . . . 101
Part I
Introductory chapter
Chapter 1
Introduction and background
1.1 Introduction and motivation
Living cells are constantly changing shape, interacting with their neighbouring cells, prob-ing, pushprob-ing, pulling and crawling on their surrounding extracellular matrix. Most biological processes and functions, organ development, plants growth, wound healing and most cellular diseases are based on these mechanical activities that each cell of a tissue provide [3]. Known as the basic fundamental unit of life, an eukaryotic living cell (cell that make up animal and plants tissues) constitutes a whole system on its own. Initially thought of being a chemical liquid boundary by most of biologists [4, 5], cells possess a cluster of proteinic networks and organelles at their inner space which help to ensure most of their biological and mechanical functions. Cells can undergo mechanical instability or deformation when subjected to external geometrical constraints or force, in a similar manner as engineering materials [6], though they are way more complex. The mechanics of a typical living eukaryote cell is proven to generally originate from the structure, spatial organisation, alignment and elastic properties of its inter-nal proteinic networks, called cytoskeleton [710].
Cryo-electron microscopy and uorescent imaging techniques are often used to visualize the internal space of the cell in order to label the components that make up the cytoskeleton and determine their structural composition and properties [11, 12]. The cell cytoskeleton is constituted of actin laments, microtubules and intermediate laments. Also, diverse binding proteins exist inside the cell and serve as cross-linkers in the cytoskeletal networks formation. The function and mechanical properties of biopolymer laments constituting the cell cytoskele-tal networks are dictated by their structure, conformation, spatial organisation, orientational ordering and physical properties which, in turn, are considerably modied in geometrically conned or crowded spaces [1316]. These biopolymer laments under the eect of cell mem-brane connement work in concert to contribute to the cell functions and to the elastic or mechanical stability of the cell. However, it is shown that the networks of actin laments are most abundant proteins inside the cell and contribute most to the mechanical properties of the
CHAPTER 1. INTRODUCTION AND BACKGROUND 3 cell. In fact, various drugs inuence the mechanical integrity of dierent components of the cytoskeleton. This has been investigated using elasticity measurements with an atomic force microscope (AFM). Disaggregation of actin laments causes the loss of the cell elasticity, while this does not happens for microtubules. This shows the importance of the actin network for the mechanical stability of living cells [17]. Actin laments are directed and are semiexible with persistence length similar to the cell dimension. They self-assemble into higher order structure inside the cell. In fact imaging of the interior of cell (crawling cell) shows a highly branched lamentous networks of actin at the cell periphery where branching via binding proteins such as the Arp2/3 protein complex, which initiate the branching of new actin laments on existing ones at an angle of about70◦. It is shown that normal eect of cell membrane connement on
the structure, architecture, spatial organisation and orientational ordering of these branching actin networks under is fundamental for the cell mechanical stability [13, 18, 19].
Many cellular diseases, such as cancer and spreading of infected cell by viruses, as for ex-ample in cells infected by HIV, often originates from the abnormalities in the mechanics of the actin cytoskeleton which in turn is based on the structure, spatial organisation and orienta-tional ordering of branching actin networks [2023]. The structure, spatial organisation and orientational ordering of laments of branching actin networks are in turned controlled by the geometrical connements eects that the cell membrane introduce. Experimental researches showed that abnormal structural and spatial organization of actin and thus of the mechanics of cell can also lead for example to development and progression of atherosclerosis in adherent endothelial cells and non adherent leukocytes (white blood cells) [2427]. Some authors found that genetic alteration in the structure of actin networks can lead to signicant immunopatho-logic consequences and even to diseases such us alzheimer's diseases [27]. More, disruption of actin laments and lack of their convenient spatial and orientational ordering aects multiple cell functions including motility, signal transduction and cell division, ultimately culminating in cell death [28] or in cancer cell formation and invasion [2123]. Also the loss of contractility of heart muscle cells due to the lack of actin structural and spatial arrangement often cause heart failure [6, 29]. Actin networks are said to play a key role in establishing and spreading the HIV infection [20]. Therefore, failure in the cell actin networks structural and spatial organization under the eect of connement can lead to the loss of the cells mechanical integrity, and this is unfavourable for the good functioning of cells within the tissue.
We are interested in investigating the contribution of conned branching actin cytoskeletal networks to the mechanical and structural properties and stability of tissue cells at thermody-namic equilibrium. The ability to model and understand how the cell membrane controls the structure, spatial organization and orientational ordering of the components that make up the cytoskeleton can allow to bring more light in the understanding of the elastic properties and stability of tissue cells.