Procedia Engineering 15 (2011) 1585 – 1589 1877-7058 © 2011 Published by Elsevier Ltd. doi:10.1016/j.proeng.2011.08.295 Procedia Engineering 00 (2011) 000–000
Procedia
Engineering
www.elsevier.com/locate/procediaAdvanced in Control Engineering and Information Science
Study on Traffic Status Threshold Based on Floating Taxi
Xin-sheng Yao
a∗, Ji-Lai Ying, Cai-xia Zhang, Li-xin Cao
aCollege of Mechanical and Electrical Engineering, Henan Agricultural University, Henan Zhengzhou 450002, China
Abstract
The applications of floating car in road traffic condition identification are taken seriously and gradually developed. The paper studies the variables threshold in traffic condition information based on the floating taxi: section traffic information update cycle, data sampling interval, section covering ratio, floating taxi sample size. The optimization idea of floating taxi sample size is given. The traffic condition identification algorithm based on the floating taxi is put forward. The practice in two road sections shows that the algorithm is feasible which can offer useful reference for urban traffic management and resident trips decision.
© 2011 Published by Elsevier Ltd.
Selection and/or peer-review under responsibility of [CEIS 2011]
Keywords: Floating taxi; traffic condition; information threshold; sample size
1. Introduction
There are some research about the floating car and its application [1], but the achievement on floating taxi is comparatively rare. Most floating cars are public transport vehicles based on fixed routes [2]. There are some blind spots of road traffic information collection for the areas with low transit density, including fast roads, branch roads and the roads in the living or business areas. As an important component of urban public transportation, the taxi is also a supplementary traffic data collection mode. The paper studies the variables threshold in traffic status based on the floating taxi: section traffic information update cycle, data sampling interval, section coverage ratio, floating taxi sample size.
∗Corresponding author. Tel.:+8613803835204
E-mail address: [email protected]
Open access underCC BY-NC-NDlicense. Open access underCC BY-NC-NDlicense.
Since the 1980s, the information system of Floating Car (FC) has been researched and implicated actively in the world [3]. The typical projects include the ADVANCE in United States [4], the DDG in Germany, The SINERGIT in France [5], the Trafficmaster in England, and The JARI in Japan. The Trafficmaster is the most typical GPS floating car data (FCD) system, which application has covered the main road network in England [3]. Those systems have played a tremendous role in the travel time detect, route guide, traffic management and jam precaution.
In China, the research for floating car is still at an elementary stage, which main application is in speed monitoring, without large-scale application of dynamic traffic information gathering and real time traffic information service based on the floating car. In recent years, there are part work about traffic information collection based on the floating car in some large cities, such as Beijing, Shanghai, Guangzhou and Chengdu [6]. There is some difficulty in floating car system application, where the most complex includes floating car sample size and road covering ratio. The Institute of Transportation Engineers (ITE) originated the method for minimum sample size in the analysis of the schedule and the delay [1]. In 2004, Matthew W. Green and Michael D. Fontaine put forward the algorithm for dynamic floating sample size based on the central limit theorem, which sample size is changing with the traffic condition [7]. There lacks concrete and pertinent research on floating car sample size for the traffic character in China.
2. Key variables in the road traffic real-time information
In the data collection and information service based on floating taxi, some parameters configuration has an important effect on the real-time performance and reliability of traffic status detection. The parameters include section traffic information update cycle, data sampling interval, section covering ratio, and floating taxi sample size, which are concerned with the traffic condition, vehicle type, and traffic flow status. In certain condition, they all have threshold.
2.1. Road traffic real-time status
There have two interpretations for road traffic real-time status in this paper. The first, it is the real traffic state, presented as the average speed of all vehicles in the section, which operation is very hard and unnecessary. Then, the average speed of part vehicles in section can express this parameter. In this paper, the taxi speed v and speed gradient a represent the road traffic real-time status.
∑
= = n i i v n v 1 0 1 (1)∑
= Δ Δ = n i i i t v T a 1 2 0 1 (2)Where, v is the real-time speed, a is speed gradient, n is the valid floating taxi number in the section,
Δti is time terminal, vi0is the real-time speed of taxi i,Δvi0is the speed change in Δti.
Δti may be a given time interval, for instance 30 seconds. It can also be the section traffic information update cycle tC, then
∑
= − = n i i i C v v t a 1 0 1 | | 1 (3)2.2. Section traffic information update cycle
For a road section, the information parameters are changing with the real-time traffic status in different traffic flow. There, the control parameter is the section traffic information update cycle, presented as tC. Theoretically, the shorter cycle times, the more real to reflect the road traffic, but this will need mass data collection, transfer, processing and dissemination [1] [8].
a t v a dt v t n i i i n i i C
∑
∑∫
= = Δ = = 1 0 1 0 (4)The period that can fully reflect the real-time road traffic condition is taken as the cycle threshold. This cycle is a variable. In practice, this cycle may be a reasonable value between 5 seconds to 300 seconds.
2.3. Traffic data sampling interval
The traffic information update cycle decides the data sampling interval tI, defined as the time interval between the two serial times traffic data acquisition. Theoretically, the shorter the sampling interval, the more real to reflect the section traffic condition and the information processing system load is larger. At the same time, if the interval is too small, traffic flow change is little, which has no signification for the traffic condition identification.
Considering some influencing factors: road traffic information update cycle, data processing cost, data processing cycle, data reliability, and the sampling interval can be expressed as:
a P C d r I p t t r p t = ( − ) (5)
Where: tp is data processing average cycle; rd is data reliability, ranged from 0.9 to 1, pr is data processing real cost, including communication cost, equipment depreciation etc, pa is acceptable unit cost. In practice, the data sampling interval is determined by user requirements. The sampling interval can be ranged from 5 seconds to 30 seconds, not less than 1 second and more than 10 minutes. The sampling interval may be adjusted by above parameters. In principle, only when the interval less than the road traffic information update cycle, the real-time transport condition can be reflected and the system effectiveness can be ensured, namely,
C I t
t < (6)
2.4. Floating car road covering ratio
Floating car road covering ratio is a ratio of the distance sum of the effective floating cars to the section length in an information update cycle or data sampling interval [8].
Floating car road covering ratio in data sampling interval is expressed as: L d m i Ii I / 1
∑
= = β (7)Floating car road covering ratio in section traffic information update cycle is expressed as: L d m i Ci C / 1
∑
= = β (8)Where, n is the valid floating car number in the section, dIi,dCi indicate the valid traveled distances of single car in the sampling interval and information update cycle respectively, dpi is space headway between vehicle i and its previous one, Lis the length of the section.
⎪⎩ ⎪ ⎨ ⎧ > < = I i pi I i I i pi pi Ii v t d v t t v d d d 0 0 0 (9) ⎪⎩ ⎪ ⎨ ⎧ > < = C i pi C i C i pi pi Ci v t d v t t v d d d 0 0 0 (10)
Based on the analysis of the dynamic character of section traffic and the information update demand,
βC can only ensure the availability of information, it must satisfied:
C I β
β > (11)
3. Optimization of the floating taxi sample size threshold
Taxi has the characters of wide service range, high mobility and flexibility, which is very suitable for floating car data collection. In order to obtain the real-time status of road traffic network, there must have enough flexible floating taxis to meet the demand of traffic information collection precision. The minimum sample size is a key parameter in the road traffic status identification based on floating car. If the valid floating taxi number is below the minimum, the floating car data can not support the identification.
Traditional method to calculate the sample floating car number is based on probability and statistics theory [1] [8]. The algorithms have some faultiness and limitation, which neither fully considered the nature of the road traffic, and the sampling standard need demarcated in advance.
The paper has studied that the floating taxi sample size can be optimized and adjusted by the actual traffic flow situation dynamically. The optimization variables include section traffic information update cycle, data sampling interval, section covering ratio. The optimization objective is to minimize the floating taxi sample size Ns, expressed as min Ns = n, the constraint functions include the equality (1), (2), (3), (4), (5), (6), (8), (9), (10), and the inequality (7), (11).
4. Road traffic condition identification based on the floating taxi
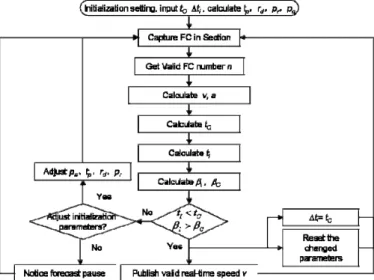
Floating taxi traffic information collection system is aimed at to get the real-time speed of the given section as far as possible by analyzing the collected data from floating car, to support the reliable traffic management and travel decision. In practical application, to find the minimum of the sample size threshold is needless, the optimization idea and constraint conditions can be implemented in dynamic information processing [7] [9]. The system process is shown in Fig. 1.
The initialization finishes the data preprocessing. Where,tC,Δti can be set a smaller value, which is 30 seconds in the case. The obtained valid real-time speed v can be published as the speed value directly or traffic status by the predefined speed section.
5. Case and conclusion
The algorithm has been experimented on two road section (Fengqing LU which is 1.7 Km long, and Dongfeng LU which is 3.9 Km long) in China Zhengzhou. The result shows that when the floating taxi number exceeded 3, 5 respectively, the road section traffic condition identification is valid in most cases. That is, 3, 5 were the threshold of the floating taxi sample size for this two road section. In most cases, the random distributed taxis can satisfy the threshold demand, which demonstrated that the algorithm could be successfully used in the city traffic condition identification and traffic jam judgment, which can provide useful reference for the city traffic management and travel decision support.
Fig. 1. Traffic condition identification process based on floating taxi
In future, combining with the traffic information project, the study will transfer to the data analysis and traffic status forecasting in larger road network, and focus on the complex road traffic areas to improve the suitability of the algorithm and to promote the application.
References
[1] Neumann, T. Efficient queue length detection at traffic signals using probe vehicle data and data fusion, 16th ITS World Congress, 21-25 September 2009, Stockholm, Sweden.
[2] Bejan, A., Gibbens, R., Evans, D., etc. Statistical modelling and analysis of sparse bus probe data in urban areas, 13th International IEEE Annual Conference on Intelligent Transportation Systems Madeira Island, Portugal, September 19-22, 2010. pp. 1256-1263.
[3] “Floating Car Data Methods” are Gaining Momentum Worldwide;
http://www.ivsource.net/archivep/2003/nov/031112_FCD.html.
[4] Boyce, D., Rouphail, N., and Kirson, A. Estimation and measurement of link travel times in the ADVANCE project. In Proceedings of the IEEE-IEE Vehicle Navigation & Information Systems Conference, Ottawa. Ont., 12-15 October 1993. IEEE, Piscataway, N.J. pp.62-66.
[5] Laurent B., Sodit. Real-time information on road traffic based on Floating Car Data http://www.pdfxx.com/f1/f1b9147a359bbe3b-download.pdf.
[6] Zhang, C., Yang, X., Yan, X., methods for floating car sampling period optimization, Journal of Transportation Systems Engineering and Information Technology, Vol.7 (3), pp.100-104, 2007.
[7] Green MW, Fontaine MD, Smith BL. 2004. Investigation of dynamic probe sample requirements for traffic condition monitoring. Transportation Research Record 1870: pp.55-61.
[8] Travel time data collection handbook, fhwa report, chapter 5, ITS Probe Vehicle Techniques, 1998. http://www.fhwa.dot.gov/ohim/handbook/chap5.pdf.
[9] Fastenrath,Ulrich. Floating car data on a larger scale. 4th World congress on intelligent transport systems. October 21-24, 1997, Berlin. http://www.ddg.de/pdf-dat/ddgfcd.pdf.