EXAMINING CHARTER SCHOOL POLICY AND PUBLIC SCHOOL DISTRICT RESOURCE ALLOCATION USING MULTIPLE QUASI-EXPERIMENTAL DESIGNS
BY
MATTHEW ALLEN LINICK
DISSERTATION
Submitted in partial fulfillment of the requirements
for the degree of Doctor of Philosophy in Educational Policy Studies in the Graduate College of the
University of Illinois at Urbana-Champaign, 2013
Urbana, Illinois
Doctoral Committee:
Associate Professor Christopher Lubienski, Chair Professor Jennifer Greene
Professor William Trent
ii
ABSTRACT
This project incorporates three different examinations of the relationship between charter schools and public school districts and district-run public schools. Charter schools, publically funded and privately run, are thought to improve performance in district-run public schools through a variety of forces. This project focuses on the competitive pressure, or the threat of competitive pressure, generated by charter schools and charter school policies and how those pressures do, and do not, impact district-run public schools. The first paper, a literature review of how charter schools induce competition in district-run public schools, examines quantitative and qualitative analyses of how charter schools may or may not compel public school districts to respond. The second paper uses longitudinal district-level data to examine the relationship between Ohio charter school policy and changes in public school district instructional resource allocation. The third paper is an examination of how, in the quantitative literature, competition is measured in examinations of the second-level effects of charter schools, and a critique
of existing approaches to that measurement. The findings from this project highlight the various potential influences that may induce or mitigate a response from a public school district. One such influence is charter school policy itself, and this study demonstrates that some Ohio charter school policies may be associated with increased level of instructional resource allocation. These findings are problematized by inconsistent findings in other, similar charter school policies and methodological concerns; further, other studies of charter school competition are problematized by inconsistent definitions and metrics of competition.
iii
ACKNOWLEDGMENTS
I would like to acknowledge the tireless mentorship, guidance, and support provided by Dr. Christopher Lubienski throughout my experience at University of Illinois. I will carry his example of scholarship with me the rest of my career. I would also like to thank Dr. Joseph Robinson for his insightful and helpful methodological guidance and suggestions. I would like to thank Dr. Jennifer Greene and Dr. William Trent who served as committee members and
invested time and energy to the successful completion of this project. Dr. Kern Alexander, Dr. Debra Bragg, and Dr. Julia Makela provided helpful feedback and insightful guidance in the conception and completion of this project. My experiences in the Educational Policy Studies department, the Office of Community College Research and Leadership, and the Forum on the Future of Public Education provided me with the skills and knowledge needed to shine the light of knowledge on the darker corners of education policy outcomes, and for that I will always be grateful.
I would also like to thank my parents (Gary and Andi), my siblings (John and Sara), and my friends for much-needed guidance, support, and distraction throughout this experience. Particularly, I would like to thank Laura Linick for her never ending love, remarkable insight, infinite patience, helpful edits, and (emotional and fiscal) support. The number of friends and colleagues that offered insight and guidance on this project and throughout my studies are too numerous to list, but they know who they are.
iv
TABLE OF CONTENTS
PAPER 1 HOW CHARTER SCHOOLS DO, AND DON’T, INSPIRE CHANGE IN
TRADITIONAL PUBLIC SCHOOL DISTRICTS ... 1
REFERENCES ... 13
PAPER 2 EXAMINING CHARTER SCHOOL POLICY AND PUBLIC SCHOOL DISTRICT RESOURCE ALLOCATION IN OHIO ... 16
REFERENCES ... 45
TABLES ... 48
FIGURES ... 58
PAPER 3 MEASURING COMPETITION: INCONSISTENT DEFINITIONS, INCONSISTENT RESULTS ... 59
REFERENCES ... 74
1
PAPER 1
HOW CHARTER SCHOOLS DO, AND DON’T, INSPIRE CHANGE IN TRADITIONAL
PUBLIC SCHOOL DISTRICTS
In 1991, the state of Minnesota succeeded in proposing and passing the first charter school legislation in the United States. Soon after, in 1992, California passed its own charter school legislation. Now, charter school legislation has passed in over 40 states and has enjoyed bi-partisan support from conservatives and liberals, and from some teachers unions and
entrepreneurs (Lubienski & Weitzel, 2010). Throughout the United States, school districts, non-for-profits, universities, and other organizations have sponsored charter schools in urban,
suburban, and rural communities. One result of this proliferation is an increase in the competitive pressures that district-run public schools face.
Considering the growing numbers of charter schools and the continued effort to expand charter school legislation (Fact Sheet: Race to the Top, 2009), it is important for teachers, school leaders, teacher educators, students, families, and policymakers to understand the impact of charter schools. The wide-ranging and multi-faceted effects of charter school competition on district-run public schools have been studied in a variety of ways. Such studies have shown that the climate of the school, the nature of district leadership, and the motivation of teachers are directly related to a district’s ability to respond to competitive pressure (Hess, 2001; Hess, Maranto, & Merriman, 2001a). Understanding what aspects of this competition provoke
responses and what those responses bring can be of great benefit to those working in and leading district-run public schools and charter schools alike. If charter schools are to be viewed as an opportunity to improve student learning, rather than an obstacle to be overcome, teachers and
2
school leaders should be aware of why and how districts typically respond to charter school competition.
Charter schools, like run public schools, receive public funding. Unlike district-run public schools, however, charter schools operate outside the traditional public education system and so are able to avoid much of the bureaucracy of the traditional system. In exchange for this freedom, charter schools are held to high accountability standards. Charter schools also typically circumvent traditional geographic school districts by opening themselves to students from across district boundaries; students who leave the district-run public school bring their public funding with them. Therefore, if a charter school fails to attract or retain students, it loses its funding and is forced to close. At the same time, district-run public schools are forced to compete with the charter schools for local students. In other words, both charter schools and district-run public schools are striving to attract the same students and families. This competition between the charter school and the district-run public school, many believe, will result in
increased efficiency and effectiveness in both institutions (Chubb & Moe, 1990; Freidman, 1955; Hoxby, 2000).
For some, charter schools represent the hope of improved student learning and
performance. One way charter schools can improve student learning is by leveraging competitive pressure to improve the performance of district-run public schools. Unfortunately, studies
examining whether increased charter school competition has improved achievement at district-run public schools show mixed results. Some studies found small, positive results for charter school competition (Booker, Gilpatric, Gronberg, & Jansen, 2008; Sass, 2006), and some studies found no effects (Bettinger, 2005; Bifulco & Ladd, 2006).
3
Ideally, the introduction of a charter school, and the resulting increase in competitive forces in the local education market, may compel a public school district to respond to the
potential loss of funding in terms of per-pupil dollars, or the loss of human capital—as the higher SES and more likely to be successful students are motivated to exit the district-run system. This response has been seen in New Zealand (Fiske & Ladd, 2000). Yet public school districts may respond to this perceived threat in a variety of ways. The type and strength of the competitive pressures may determine how, or if, the district responds. The assertions of those promoting choice as a method of improving performance and efficiency seem to expect uniform responses from schools based on non-uniform influences in varying contexts. Consequently, it becomes crucial to understand the factors generated by the emerging charter school sector that can lead to different types of changes in public schools. In particular, we hope to understand the theory of change underlying charter schools relative to the actual evidence on their impact.
In order to address this issue, we examine the logic of organizational change and
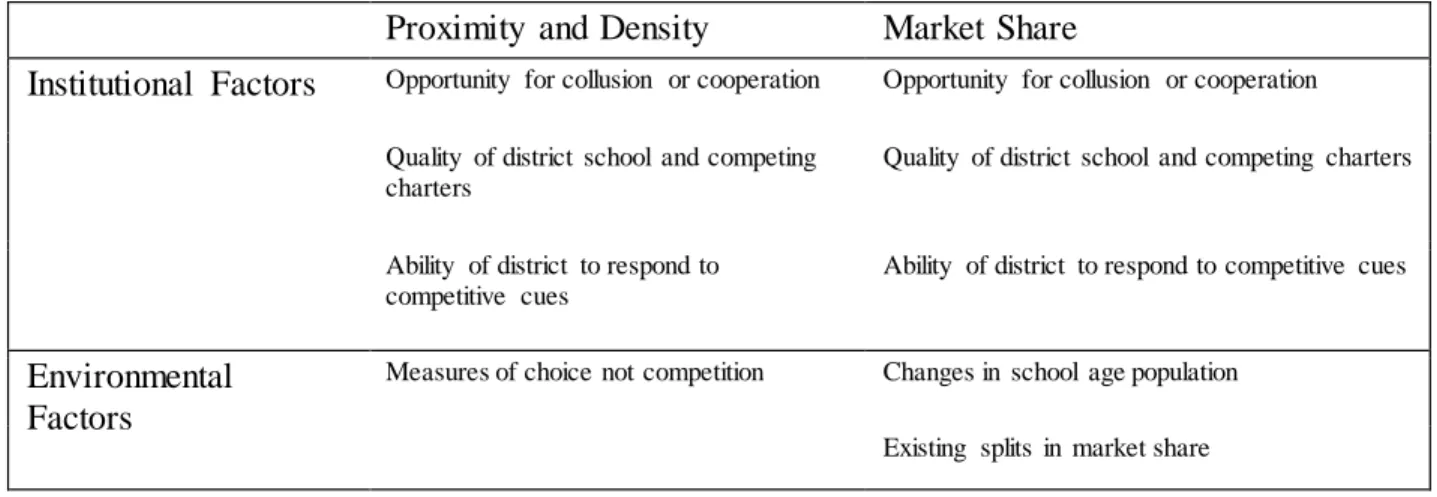
competitive options, drawing on evidence about the competitive effects of charter schools. First, this paper explores external factors that may induce or mitigate the pressure of a public school district to respond to competition from charter schools; these factors include the market share of charter schools, the degree of loss to these competing schools, the size of the student population, or the quality of the competing schools. Analyzing existing research that identifies these factors and how they relate to the response of the public school district demonstrates how and if external pressures mitigate or induce a competitive response from the traditional school district. Next, we focus on how internal factors relate to the ways in which a public school district might respond to competitive pressure. Such factors include the knowledge, attitude, and beliefs of the district leadership and the organizational behavior of the public school district.
4
How Might Outside Forces Affect Public School Districts’ Responses to Charter School Competition?
According to economic theorists, competition should make schools more efficient by pressuring them to perform at a level that was not previously attained in the organization (Friedman, 1955). The pressure of this competition should prompt the district to become more efficient and therefore more appealing to families. However, this is not always the case. There are three key findings in any study of non-charter public schools’ response to competition: 1) school districts systematically respond to competition in some measurable or observable way, such as shifting financial resources from one area to another; 2) because districts respond to competitive situations in different ways, there is no systematic response pattern; and 3) most schools do not respond to competition and therefore any response is difficult, if not impossible, to measure using traditional methods (Arsen & Ni, 2012). Economists have developed a variety of models for studying strategic behavior under competitive pressure, but little of this type of study has been applied to school systems (Hoxby, 2003; Ni & Arsen, 2010); the studies that have been conducted, largely interviews and case studies (e.g., Hess, 2002; Teske, Schneider,
Buckley, & Clark, 2001), show mixed results.
Ni and Arsen (2010) outline how a charter school can create a change in behavior at the public school district level and what that change might entail. First, charter schools must exert enough competitive pressure so that public school district administrators notice a change in enrollment. Some point to 6% student attrition to the charter schools as the threshold for igniting a district response (Hoxby, 2003). However, there are multiple methods for measuring strength of competition, including proximity of charter schools, number of charter schools, or type of charter school policy (Booker, Gilpatric, Gronberg, & Jansen, 2008). Next, the administrator
5
must understand and interpret the competitive pressures. Finally, the administrator must decide that the increased competitive pressure warrants a response, of which there are three options: accommodate the charter school by passively responding or working with the charter school; compete with the charter school by improving academic quality, differentiating services, or employing marketing strategies; or create barriers for the charter school through political actions or by restricting access to networks, such as extracurricular organizations. Considering the financial and administrative limitations facing the public school district, some of the most common responses include: changing school or district leadership, creating new curricular programs (such as Montessori or a gifted program), expanding instructional time (such as instituting all-day kindergarten or lengthening the school day), offering child care, adding extracurricular activities, or using marketing strategies to try to entice new student enrollment (Ni & Arsen, 2010).
The type of charter school also can affect the level of competitive pressure. A conversion charter, which is a public school that has been converted into a charter school, likely will be more dependent on public funds than mission or market charters, which are typically start-ups and rely more on private funding (Huerta & d’Entremont, 2010). Conversion charters tend to more closely resemble district-run public schools or be run by the public school district itself, while mission or market charters are run by external organization and rely less on public funds. Therefore, the type of charter school can affect whether and how a public school district
responds to the generated competition, as schools with the same bureaucratic restraints as public school districts may not be able to exert the same competitive pressure.
As charter school reforms grow in popularity, the consequent impact has received increasing levels of attention from scholars and policymakers. Ericson, Silverman, Berman,
6
Nelson, and Solomon (2001) found that state and local conditions, external factors outside the public school district, affected the way district leaders perceived charter school impact; namely, states with similarly constructed charter laws tend to have similar perceived impacts by district leaders. This finding indicates that the way charter laws are constructed can influence how and if school districts respond. Also, the charter authorizing agency was found to affect district leaders’ perceptions of the charter school; when the school district authorized the charter school, as opposed to an outside agency, the district was much less likely to perceive the charter school as a threat. If outside authorizers were coupled with declining enrollments, district leaders were much more likely to perceive the charter school as a challenge and respond with market-oriented strategies. Smaller districts also were more likely to perceive the charter school as a threat, as even a small number of exiting students had a profound effect on the district budget. Public school districts that perceived the charter school as a challenge, rather than an opportunity, were more likely to respond with administrative or market-oriented strategies (Ericson et al., 2001). Other studies have examined how school choice policies affect the impact of charter schools.
Given the finite financial resources available to a public school district to utilize in a response to increasing competition, Arsen and Ni (2012) assert that measuring changes in resource allocation is a way to determine how and if public school districts are responding to increasing competitive pressures from charter schools. Economic theory states that the increasing levels of competition should lead to improved efficiency in the district-run system. Conventional wisdom then indicates that public school districts, when exposed to increased competition, should transfer funds from support services (operations, maintenance, administration, and business) into instructional programs (Arsen & Ni, 2012). Logically, instruction is the expenditure most directly linked to student achievement and increased investment in
7
instructional programs should lead to increased achievement and efficiency. By measuring both the magnitude and duration of competition, these researchers attempt to identify school districts most affected by competitive pressure and measure whether schools that have been exposed at different levels for different lengths of time respond differently to the competitive pressures exerted by the charter school. They found that, contrary to conventional wisdom, public school districts do not increase their investments in instructional programs. In fact, school districts that have been exposed to charter school competition for a short or medium period of time do not alter resource allocation behaviors at all (Arsen & Ni, 2012). While those public school districts exposed to significant competition for a long period do shift resources, they tend to shift those resources away from instructional programs and into business and administration expenditures (Arsen & Ni, 2012). These findings support those of other scholars, who found, using more qualitative methods, that increased exposure to competitive pressures induce public school districts to invest in marketing strategies (Lubienski, 2005). However, this more recent evidence elaborates on prior research with the discovery that these investments are made at the cost of instructional programs. This finding is of specific concern to those focused on student learning and instructional spending.
While increasing duration and magnitude of charter school competition is likely to induce a response from the public school district, many external factors may mitigate a response and lighten the pressure. Teske et al. (2001) discuss the factors that might lessen a possible response. For example, many charter schools are located in or near metro areas with large numbers of students; therefore, even if a significant number of students choose to exit the public school district in favor of the charter school, the effects may be dispersed enough throughout the entire area that it does not pose a threat to the public school district. Some districts may welcome the
8
exit of vocal, disaffected families. Also, if the population of school-age children is growing, public school district enrollment may remain level even if families are choosing the charter school. While the characteristics of public school district leadership may mitigate a response when leadership is unsure or unwilling to respond, leaders who are particularly entrepreneurial and looking to take advantage of the increased competition or innovations produced by the charter school may be more likely to respond—although even leaders may be further hindered by the inability of charter schools to disseminate said innovations (Teske et al., 2001).
Smaller districts may be more exposed to the competitive pressure of charter schools than larger districts. In an effort to study this, Hess, Maranto, and Milliman (2001b) looked at four small Arizona school districts that had experienced significant enrollment losses, ranging from 10-33%. Smaller districts facing intense and extended competitive pressure were more likely to respond than districts not exposed to the same competitive pressures. Even given this somewhat similar context (the same state with the same laws), district responses were not uniform. The responses depended on such external factors as the size of the student population, the changes in the educational market place, and the quality of the charter school. In one school district, the opening of the charter school resulted in leadership changes at the public school district; another school invested in community outreach and inter-district communication; and one district began making moves towards assimilating the charter school. It was clear that certain factors led to certain responses; for example, the public school district that minimally responded was not threatened by the charter school due to the poor quality of the charter, while the public school district that changed leadership did so based on parental preferences about education (Hess et al., 2001b).
9
In one of the first studies done on public school district responses to charter schools, Rofes (1998) noted that change always occurs after a charter opens, but that the change is never predictable. He notes that several factors can induce a response: the overall ecology of choice, student performance, media attention, charter policies and laws, enrollment levels, and district leadership. Clearly, despite the variety in responses, public school districts do not respond randomly to increasing competitive pressure. Given accountability and legal restrictions, as well as a finite amount of financial resources, options are limited.
Based on the discussion above, it is clear that certain external factors can affect if and how a public school district responds to charter school competition. The size of the district can affect the response; smaller districts, possibly due to economies of scale, feel competitive pressures more sharply. Local policies and state laws also relate to how public school districts experience competition; because of this, the study of charter school effects is highly
contextualized. The duration and magnitude of charter school pressure also can provoke a response from the public school district; as districts feel more pressure for a longer period of time, they become more likely to respond. The response of a particular public school district can be difficult to predict, but long-term pressure was related, in one case, to shifting resources away from instructional programs and toward business and administration expenses.
What Internal Forces Affect How and If Public School Districts Respond to Charter School Competition?
As stated above, many factors can affect how and if a school district responds to an increase in competition, and many of those factors are controlled by forces outside of the public school district. Some organizational and leadership behaviors from within the school district also
10
can affect how the school district responds; however, the district leadership must recognize, interpret, and actually respond to competition in order for a researcher to make such an observation.
Clearly, the organizational structure of public school districts can influence a potential response. However, the employees of the public school district ultimately determine how and if the response occurs. Public school district leadership and teachers employed by the district have the most direct interaction with students and ultimately must be the ones to recognize, interpret, and react to competitive pressures. Hess (2001) argues that because teachers enjoy no additional benefit from attracting additional students, unless they feel their employment is threatened, the competitive pressure of charter schools is diffused throughout the faculty, thereby lessening the pressure on the entire system. Metaphorically, he likens the competitive effects of charter schools to a pickaxe rather than a bulldozer. This assertion is supported by Arsen and Ni ’s (2012) finding that resource allocation changes occurred only after a long-term exposure to competition. Hess argues that, in addition to the extent of the external threat, the results of competition will be shaped by three internal elements: the sensitivity of administrators to market pressures, the incentives and sanctions the administrators can utilize to improve performance of educators, and the temperament and skills of educators (Hess, 2001). Further examinations of these issues by Hess, Maranto, and Milliman (2001a) support that argument. They found that schools with uncooperative cultures had no significant changes based on charter competition. In schools with cooperative cultures, however, charter competition spurred changes in the behavior of district leadership. This would indicate that while the leadership must recognize, interpret, and respond to the increasing charter competition, the culture of the entire school may mitigate possible responses.
11
Conclusion
By studying the external and internal factors that lead to if and how a public school district responds to increasing levels of charter school competition, it becomes clear what such a response might entail. This is significant because it speaks to the limited potential of the change to be achieved from the competitive effects of charter schools—to predict and explain the types of responses actually embraced by district-run schools. It suggests that charter schools, while they may have many advantages for the students who choose to enroll in them, are limited in the impact they may have on other public schools, particularly in shaping the types of improvement policymakers hope to see at the classroom level. While students enrolled in charter schools remain a minority of the student population as a whole, understanding how a charter school relates to student learning also involves understanding how charter schools affect district-run public schools.
Even a cursory look of the existing literature calls attention to the need for future research on the relationship between charter schools and public school districts. The factors that lead to a certain response in one arena may lead to a completely different response in another arena. Certain external and internal factors are certainly related to an increase in the likelihood of a response, such as: the magnitude and duration of the competitive pressure, the local and state policies, the climate of the public school district, and the ability and desire of the public school district leadership to respond to competitive pressures. Studies, such as those discussed here, have had small and mixed findings, leading most to refrain from drawing definitive conclusions. Perhaps the most significant lesson learned from this review is that further research utilizing
12
rigorous quantitative and qualitative methods is needed to examine these problems and contribute to the culmination of knowledge in this important field.
13
REFERENCES
Arsen, D., & Ni, Y. (2012). The effects of charter school competition on school district resource allocation. Educational Administration Quarterly, 48(1), 3-38.
doi:10.1177/0013161X11419654
Bettinger, E. P. (2005). The effect of charter schools on charter students and public schools. Economics of Education Review, 24(2), 133-147. doi:10.1016/j.econedurev.2004.04.009 Bifulco, R., & Ladd, H. (2006). The impacts of charter schools on student achievement:
Evidence from North Carolina. Education Finance and Policy, 1(1), 50-90. doi:10.1162/edfp.2006.1.1.50
Booker, K., Gilpatric, S. M., Gronberg, T., & Jansen, D. (2008). The effect of charter schools on traditional public school students in Texas: Are children who stay behind left behind?
Journal of Urban Economics, 64(1), 123-145. doi:10.1016/j.jue.2007.10.003
Chubb, J., & Moe, T. (1990). Politics, Markets, and America's Schools. Washington, DC: The Brookings Institution.
Ericson, J., Silverman, D., Berman, P., Nelson, B., & Solomon, D. (2001). Challenge and opportunity: The impact of charter schools on school districts. (No. RC95196001). Washington, DC: RPP International.
Fact sheet: The race to the top. (2009). Retrieved September 24, 2011, from www.whitehouse.gov/the-press-office/fact-sheet-race-top
Fiske, E., & Ladd, H. (2000). When schools compete: A cautionary tale. Washington, DC: Brookings Institution.
Friedman, M. (1955). The role of government in education. In R. Solo (Ed.), Economics and the public interest (pp. 123-144). New Brunswick, NJ: Rutgers University Press.
14
Hess, F. (2001). Hints of the pick-axe: Competition and public schooling in Milwaukee. In P. Peterson & D. Campbell (Eds.), Charters, vouchers & public education (pp. 163-175). Washington, DC: Brookings Institution Press.
Hess, F. (2002). Revolution at the margins: The impact of competition on urban school systems. Washington, DC: Brookings Institution Press.
Hess, F., Maranto, R., & Milliman, S. (2001a). Responding to competition: School leaders and school culture. In P. Peterson & D. Campbell (Eds.), Charters, vouchers & public education (pp. 215-238). Washington, DC: Brookings Institution Press.
Hess, F., Maranto, R., & Milliman, S. (2001b). Small districts in big trouble: How four Arizona school systems responded to charter competition. Teachers College Record, 103(6), 1102. Hoxby, C. (2000). Does competition among public schools benefit students and taxpayers? The
American Economic Review, 90(5), 1209-1238.
Hoxby, C. (2003). School choice and school productivity: Could school choice be a tide that lifts all boats? In C. Hoxby (Ed.), The economics of school choice (pp. 287-342). Chicago, IL: University of Chicago Press.
Huerta, L., & d’Entremont, C. (2010). Charter school finance: Seeking institutional legitimacy in a marketplace of resources. In C. Lubienski & P. Weitzel (Eds.), The charter school
experiment: Expectations, evidence, and implications (pp. 121-146). Cambridge, MA: Harvard Education Press.
Lubienski, C. (2005). Public schools in marketized environments: Shifting incentives and unintended consequences of competition-based educational reforms. American Journal of Education, 111(4), 464-486.
15
Lubienski, C. & Weitzel, P. (2010). Two Decades of Charter Schools. In C. Lubienski & P. Weitzel (Eds.), The Charter School Experiment: Expectations, Evidence, and Implications. Cambridge, MA: Harvard Education Press.
Ni, Y., & Arsen, D. (2010). The competitive effects of charter schools on public school districts. In C. Lubienski & P. Weitzel (Eds.), The charter school experiment: Expectations, evidence, and implications (pp. 93). Cambridge, MA: Harvard Education Press.
Rofes, E. (1998). How are school districts responding to charter laws and charter schools? A study of eight states and the District of Columbia. Berkeley, CA: Policy Analysis for California Education.
Sass, T. (2006). Charter schools and student achievement in Florida. Education Finance and Policy, 1(1), 91. doi:10.1162/edfp.2006.1.1.91
Teske, P., Schneider, M., Buckley, J., & Clark, S. (2001). Can charter schools change traditional public schools? In P. Peterson & D. Campbell (Eds.), Charters, vouchers & public education (pp. 188-214). Washington, DC: Brookings Institution Press.
16
PAPER 2
EXAMINING CHARTER SCHOOL POLICY AND PUBLIC SCHOOL DISTRICT RESOURCE ALLOCATION IN OHIO
In the United States, educational reform policies have continued to blur the distinction between public and private schooling by introducing a variety of market-based educational reforms such as charter schools, private school vouchers, open-enrollment schemes, and tuition tax credits. Advocates of choice-based reforms claim that such policies, in addition to offering alternative options, will improve the performance and efficiency of district-run public schools by exposing them to competitive pressure (Chubb & Moe, 1990; Friedman, 1955). Competition from charter schools is expected to open additional educational options for students and families and, through competitive effects, improve the of efficiency district-run public schoolsi. However, district leaders are sensitive to various inputs, and the threat of competition, inherent in charter school policies, may alone be sufficient to drive change in school district efficiency.
Much of the research on charter schools has focused on comparing charter schools to district-run public schools. Research into the effects of charter schools on district-run public schools, has returned mixed results (Arsen & Ni, 2012; Bettinger, 2005; Bifulco & Ladd, 2006; Booker et al., 2008; Hoxby, 2003; Sass, 2006). While these studies speak to the effect of charter school competition, they do not directly measure the effect of the threat of competition inherent in charter school policies. Despite these mixed results, and lack of focus by researchers on the policy threat, charter school policies continue to grow and are the fastest growing reform in the United States (Teske et al., 2001; National Alliance for Public Charter Schools, 2012). State policy makers have very little control over the day-to-day operations of a charter school, how that charter school is perceived by the district-run public school, or whether the charter school
17
will drive efficiency improvements; but, policy makers do have control over the types of policies implemented in their state.
While charter schools still only occupy a small share of the educational market in the United States, policy makers and educational reformers are embracing this movement. Given the recent expansion of charter schools and proliferation of charter school policies, many
communities that do not currently have charter schools could soon. Very little is known about the effects of charter school policy on district-run public schools, and understanding how existing publicly-run school districts may respond to these policies is important. Policies generating competition in public education, such as charter school policies, have been sold to the public as a rising “tide that lifts all boats” (Hoxby, 2003, p. 1), but evidence to support these claims are lacking, conflicted, or highly contextualized (Arsen & Ni, 2012; Bettinger, 2005; Bifulco & Ladd, 2006; Booker et al., 2008; Hoxby, 2003; Ni & Arsen, 2010; Sass, 2006). Additionally, these studies examine the effects of charter school competition, though do not directly examine the impact of charter school policy, which generates the threat of competition.
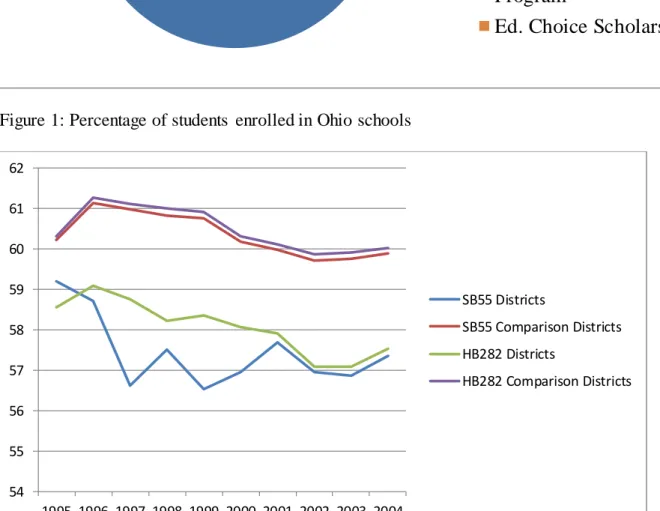
The vast majority of students still attend district-run schools. Even in Ohio, the subject of this study and a state with multiple choice programs, 79.80% of students attend district-run public schools and only 4.49% of students attend charter schools [see figure 1], which are known as “Community Schools.” This stresses the priority of understanding the effects of these policies on district-run public schools. There has long been pressure for public districts and schools to be more efficient, but in recent years that pressure has been building as state and local budgets diminish. This study proposes to examine the assertion that increasing competition for public school districts will lead to greater efficiency in said districts by examining an aspect of efficiency and an aspect of competition: resource allocation and charter school policies.
18
Resource Allocation and Policies as a Proxy for Efficiency
If we accept the contention, as made famous by Friedman (1955), that increasing
competition in the educational marketplace leads to greater efficiency, then the expected changes in efficiency should generate from the central district office where most resource allocation decisions are made. However, there is a finite amount of resources available to public school districts, typically determined through a combination of local, state, and federal contributions. These resources can be divided into different expenditure types including personnel, instruction, activities, infrastructure, transportation, and food service (Thompson, Wood, & Crampton, 2008).
The finite level of resources and the needs of the district constrain a district’s ability to become more efficient. In order to become more efficient, districts may focus on increasing achievement, and restrict themselves to spending money in areas that are most connected to student performance, namely instruction (Arsen & Ni, 2012). There is a growing literature that relies on the assertion that instructional expenditures are more productive, in terms of
contribution to student achievement, than administrative expenditures. As such, an increase in the proportion of a budget directed towards instruction can be interpreted as an attempted increase in efficiency (Arsen & Ni, 2012; Chakrabarti & Roy, 2012). Arsen and Ni (2012) examined the role of charter penetration — the market share of students that attend charter schools within a district — in public school district resource allocation. They found that though there were no immediate effects, public school districts exposed to high levels of competition for long periods of time shifted resources away from instruction and into administrative
expenditures. These findings indicate that high levels of competition, resulted in decreased efficiency — a finding that contradicts economic theory (Friedman, 1955). Whereas, Chakrabarti
19
and Roy (2012) found that Michigan’s Proposal A, a 1994 policy that centralized Michigan educational spending, resulted in decreased instructional expenditures. As local budgetary control is viewed as a generator of Tiebout competition in which residents seek out their
preferred tax-service package, Proposal A can be viewed as a policy that decreased competition in Michigan. While Arsen and Ni (2012) found that increased competition led to decreased instructional expenditures, Chakrabarti and Roy (2012) found that decreased competition also led to decreased instructional expenditures. This indicates that competition, as measured by the activation of Policy A or charter school penetration, resulted in conflicting findings when using instructional resource expenditures as a proxy for efficiency. Inasmuch as these studies
demonstrate the nuanced relationship between competition and efficiency, both studies take place in Michigan, a unique context with a unique combination of policies impacting competition between schools (Aresen & Ni, 2011; Chakrabarti & Roy, 2012).
Studies using resource allocation as a proxy for district efficiency have found conflicting evidence of competition’s effect on efficiency (Arsen & Ni, 2012; Chakrabarti & Roy, 2012). However, the use of resource allocation as a proxy for school district efficiency and the use of state policy as a proxy for competition (Chakrabarti & Roy, 2012) establish a useful theoretical framework for the study of competition and efficiency through the use of charter school policy and public school district resource allocation. Incorporating these most recent studies into the economic theory of competition as a driving force for improved efficiency (Chubb & Moe, 1990; Friedman, 1955), a district responding to potential or actual charter school competition by
attempting to become more efficient may shift resource allocation out of non-instructional expenditures and into instructional expenditures. Districts are expected to improve efficiency in order to retain parents, who, when given a choice, are expected to choose the most academically
20
effective school for their children (Alexander, 2012). Following this framework, this study tests whether charter policies impact resource allocation changes at public school districts, and
answers the following research question: what are the size and direction of the changes in public school district instructional resource allocation associated with changes in state charter school policy? This study contributes to the literature in that, unlike previously executed studies, it examines the threat of competition generated by charter school policies, further examines instructional resource allocation as a proxy for efficiency, and expands such an examination beyond Michigan.
Research Context and Data Sources
The expansion of charter schools throughout the country provides different opportunities to support research of charter schools as a market-based reform, but the educational and
legislative context in Ohio is particularly well-suited for this research. Ohio has instituted multiple market-based reforms including charter schools and vouchersii. In addition, charter school legislation has existed in Ohio for over 15 years. While this context is exciting for examining outcomes associated with charter school policies, this study only examines changes immediately following charter school policies, rather than examining changes over time, as I rely on the exogenous shock of policy activation to examine the changes in resource allocation
associated with the policies. Research Context
In 1997, Ohio passed Senate Bill 55 (SB55) which permitted conversion charter schools throughout the state, but only permitted start-ups in Lucas County and the ‘urban eight’iii city districts. In 1999, Ohio passed House Bill 282 (HB282), a similar bill that impacted an additional 13 districts: Cleveland Heights, East Cleveland, Elyria, Euclid, Hamilton, Lima, Lorain,
21
Mansfield, Middletown, Parma, South-Western, Springfield, and Warren (“Legislation for Community Schools”, n.d.).
Following SB55, community schools could be established as start-ups or conversion schools. Start-up community schools are new schools sponsored by external authorizers, while conversion community schools are sponsored by the local public school district. As conversion charters, authorized by the local school district, generate less competitive pressure, I focus on charter school policies related to start-ups, authorized by an outside entity. Previous research indicates that public school districts are more threatened or motivated to respond to charter school competition when the charter school is sponsored by an external agency (Hess et al., 2001; Ni & Arsen, 2010; Teske et al., 2001). Since Ohio policy specifically allows for start-up charter schools under different circumstances than district sponsored charter schools, the inclusion of this distinction better informs this study of the nature of competitive responses in educational markets.
Data Sources
The data for this analysis were collected from the National Center for Education Statistics (NCES) Common Core of Data. The financial data, including total expenditures, instructional expenditures, and support expenditures were organized by type, year, and district. The collected data ranges from 1995 to 2004. According to the NCES, instructional expenditures include teachers’ salaries and benefits, as well as instructional supplies and services. In addition to financial data, data related to district student demographics, district organization, and district size were also collected (National Center for Education Statistics, “N.D.”).
22
Analytical Samples, Plausibility of Inferences, and Models
There are over 600 publicly-run school districts in Ohio, of which SB55 impacted 8 and HB282 impacted 13. Despite the low number of affected districts, since the policies targeted the largest districts in Ohio, a significant proportion of students were impacted by these policies. Though only a total of 21 districts were directly affected by these policies, SB55 impacted 316,327 Ohio students (17.47% of Ohio students) in 1998, and HB282 impacted 118,983 Ohio students (6.67% of Ohio students) in 2000. In 2000, after the implementation of HB282, over 400,000 students attended a district that had been targeted by one of these policies.
Analytical Samples
District characteristics, including finance characteristics, number of students, grades of students, student demographics, Free Lunch Eligibility (FLE), and student Individualized Education Plan (IEP) status, are listed in Table 1. Student race, FLE, IEP status, and grade level are all reported as a proportion of the total district population. Unfortunately, these data were not collected for every school district and therefore the analytical sample is restrained to the 230 Ohio school districts from which reported data on these characteristics were collected. Lucas County school districts which, according to the Ohio Department of Education, were impacted by charter school legislation earlier than other SB55 school districts are removed from the dataset. Further, because treatment status (i.e. being targeted by charter school policy) is inherently associated with certain characteristics such as district size, an additional comparison group was created to test the robustness of the findings. The smaller dataset, referred to as the “restricted dataset,” only includes comparison districts that had total expenditures or total
23
sample, but offers some insight into the robustness of the findings. District characteristics, based on treatment status, are reported in Table 1.
Table 1. Mean District Characteristics by Treatment Status (1995-2004)
SB55 Districts (n=8) HB282 Districts (n=13) Comparison Districts (n=209) Restricted Comparison (n=27) %Instruction 57.44 (4.00) 58.06 (3.19) 60.48 (3.05) 60.33 (3.28) %Support 38.52 (3.61) 38.01 (3.81) 35.85 (3.25) 36.77 (3.43) Total Expenditures* 313.42 (190.45) 69.15 (28.02) 22.94 (17.22) 54.26 (12.32) Instructional Expenditures* 180.98 (111.05) 40.13 (16.18) 13.79 (10.27) 32.47 (6.40) Property Tax Revenue* 129.49 (92.49) 30.96 (19.78) 13.36 (13.75) 37.15 (12.72) Total Students 37402.99 (21504.98) 9178.30 (3808.58) 3333.68 (2180.40) 7636.00 (551.12) %Primary 48.56 (2.87) 47.11 (2.89) 43.97 (2.90) 42.61 (2.96) %Middle 22.44 (1.19) 22.84 (1.11) 23.23 (1.30) 22.63 (1.40) %Secondary 25.54 (2.17) 27.82 (2.74) 31.00 (2.48) 31.71 (0.75) %IEP 13.89 (5.30) 12.98 (4.94) 11.08 (4.65) 10.90 (3.53) %Free-Lunch Eligible 54.03 (14.20) 37.89 (15.66) 16.29 (11.83) 6.04 (2.73) %Black 57.15 (12.93) 35.15 (26.70) 6.49 (13.66) 2.53 (1.44) %Latino 3.23 (3.08) 3.21 (7.00) 1.32 (2.44) 1.06 (0.27) %Asian 0.92 (0.73) 0.69 (0.59) 1.18 (1.50) 2.49 (2.03) %Native American 0.16 (0.12) 0.13 (0.11) 0.11 (0.12) 0.14 (0.06) %White 36.50 (13.59) 58.98 (26.44) 89.92 (14.67) 92.71 (3.62) *Expressed in millions of dollars (22.1 = $22,100,000.00)
As seen in Table 1, there were obvious differences between SB55 districts, HB282 districts, and the comparison non-targeted school districts. These differences were implicit in the policies themselves, as SB55 targeted the eight largest school districts in Ohio and HB282 targeted the next 13 populous districts. For example, SB55 districts had a much larger total
24
student population and budget. HB282 districts also, though to a lesser extent, had larger student populations and budgets than the comparison districts. Other differences found between the policy targeted districts and comparison districts are typically associated with urban school districts such as higher proportions of minority students, FLE students, and IEP students. SB55 districts, and HB282 districts, allocated a larger proportion of their budgets to support
expenditures. Support expenditures include maintenance and operations, transportation, school district administration, business expenses, and other administrative or support expenditures (Common Core of Data, “N.D.”). This was expected as larger urban districts typically have a larger, more expensive infrastructure; an additional possible explanation for this difference was the higher proportion of students receiving services associated with FLE or IEPs in the more densely populated districts. This is not problematic for measuring the impact of SB55 and HB282 as the models account for these differences; of greater concern are pre-policy trends in instructional resource allocation, an issue discussed in greater detail in the following section. Plausibility of Inferences
In this study, I examined two charter school policies passed in Ohio through the use of difference-in-difference (DID), regression discontinuity (RD), and difference-in-regression-discontinuity (DRD) models, all considered quasi-experimental designs. Quasi-experimental designs allow researchers to make limited causal inferences provided certain assumptions are met (Shadish & Cook, 2009; Murnane & Willett, 2011); in addition, designs such as DID, RD, and DRD are appropriate for estimating the changes in instructional allocation associated with charter school policies.
In the parlance typically associated with random-control trials (RCTs), in the DID and DRD models the policy targeted districts are both the treatment and control group. Pre-policy
25
instructional expenditures, the control, are compared to post-policy instructional expenditures, the treatment. However, these districts are not randomly assigned and therefore, causal
inferences cannot be made from such an analysis. The non-impacted districts, the comparison group, provide the trend in instructional expenditures in districts not targeted by the policies, and by accounting for the trends in the comparison group, I am able to provide a more plausible estimate of the change in instructional allocation associated with the policy on policy targeted school districts. This model, through the incorporation of the comparison districts, accounts for secular trends in instructional expenditures in Ohio and allows for more plausible inferences than by examining these trends only using descriptive data (Murnane & Willett, 2011).
The goal of these models is to account for any variable that may relate to the subjects of analysis and the dependent variable, which is not feasible in most educational studies; however, a discrete shift in the policies impacting the subjects may provide such an opportunity when the studying the impact of the shifting policies (Dynarksi, 2003). In this case, the shift in charter school policies, which altered the eligibility of certain districts to compete with externally
sponsored charter schools, provides an opportunity to examine the impact of these policies on the policy targeted districts through the use of DID and DRD designs. These analyses rely on the assumption that the comparison school districts’ differences are a reasonable proxy for the differences that would have been experienced by the targeted school districts, had the policy not existed. I address this assumption by examining the similarity in trends, not similarity in levels, between targeted and comparison districts prior to the implementation of the policy—these concerns are addressed in Figure 2, which charts the trends of proportion of budgets dedicated to instructional expenditures by treatment type. Figure 2 shows pre-policy trends in HB282 districts are nearly identical to pre-policy trends in comparison districts. On the other hand, pre-policy
26
trends in the SB55 districts are not identical to comparison districts, and if these differences are due to omitted variable bias, it jeopardizes the models’ validity for making reliable inferences. It is possible that the differences between SB55 districts and comparison districts are due to district characteristics such as district size or student demographics. If that is the case, by accounting for those characteristics in the model, I have addressed any concerns related to pre-policy trends. The largest concern is the drastic drop in instructional resource allocation the year before the activation of SB55 in districts targeted by the policy. Examining each district’s change from 1996 to 1997, it seems most districts spent less in 1997 than in 1996. However, Cleveland spent 7.3% less in 1997 and Youngstown spent 5.4% less, decreases much larger than the average 1.7% in other districts with a decrease in instructional resource allocation. It is possible that pre-policy trends at Cleveland and Youngstown bias estimates related to SB55. For this reason, estimates related to SB55 may provide plausible estimates related to changes in resource
allocation associated with charter school policies, however, estimates based on HB282 are more reliable.
A further concern of the DID analysis is that it is only able to include observations from the year immediately before and immediately after the implementation of the treatment. I test the robustness the findings from the DID analyses, and address the weakness of limited time frames, by also conducting RD and DRD analyses. Through the RD model, I establish a relationship between a continuous measure of time and the proportion of the resources allocated towards a district. This produces estimates of the change in resource allocation associated with the policy, because the relationship is disrupted at the cut point, activation of the charter school policy. The RD analyses measure targeted districts’ instructional resource allocations over time, and estimate trends in resource allocation, which allows an examination of how those trends change at the
cut-27
point. These changes in the trend represent the effect of the policy on resource allocation the year the policy occurred. Conceptually, the difference in means of those just below the cut score and those just above the cut score represents the effect of the treatment on those at or near the cut score, which assumes that placement just above or below the cut score is just as random as the random assignment of a RCT. In fact, Cook, Shadish, and Wong (2008) compared within-study causal estimates from a RCT to the estimates produced by a quasi-experiment using the same treatment group. The study found that the RD models reproduced comparable results to the RCT when analyzed near the cut score. However, these methods also limit the scope in which
inferences can be made. Inferences are limited to the impact of the policies on the school districts directly affected during the years immediately following policy activation. The strongest
inferences can be drawn from a RD analysis when observations are normally distributed around the cut-score; however, these analyses place the cut point longitudinally on the X axis at the time of policy activation, with an equal number of observations across the included years.
Additionally, the RD analyses only contain the school districts targeted by the policy, therefore, the model is unable to absorb state-wide secular trends in resource allocation, an advantage of the DID and DRD models.
The DRD models incorporate the longer time frame used by the RD models while still accounting for the state-wide secular trends provided by the comparison group in the DID
models. The DID estimates are based on the interaction of dichotomous indicators of whether the district was targeted by the policy and whether the policy was activated, but requires the time frame included in the dataset to be limited to one year before and one year after the policy’s activation. The RD models estimate the effect of the policies based on the interaction of a dichotomous indicator of whether the observation occurred after policy implementation and a
28
continuous indicator of time, but only policy targeted districts are included in the analyses. Using the DRD models, I estimate the changes in instructional resource allocation associated with the policies based on the interaction of dichotomous indicators of whether the district w as targeted by the policy and whether the policy was implemented; however, because the dataset contains multiple years of data, the model also includes a continuous indicator for year. Through the use of several interaction terms and the year term, I estimate the changes in resource allocation in targeted districts associated with the activation of the policy immediately following the activation of the policy. The DRD exploits the strengths of the DID and the RD by comparing districts targeted by the policy after policy activation to districts targeted by the policy before policy activation while accounting for trends in districts not targeted by the policy, and including observations for multiple years before and after policy activation.
Each model has its own strengths and weaknesses, and by triangulating the measured effects through the use of multiple models, I am more confident in the overlapping estimates reported for the analyses. The DID analyses incorporate 230 districts and the secular trends in resource allocation across the state, but only include the year before and the year after policy activation. The RD analyses incorporate multiple years of observations, and thereby longitudinal trends, but are only able to include the districts which were impacted by the policies. The DRD analyses are able to include both multiple years of observations and 230 districts. While the DRD analyses capitalize on the strengths of the DID and RD models, including the DID and RD models triangulates my findings and consistency across analyses and reinforces any overlapping findings of the analyses.
29
The datasets contain annual observations nested within districts. In order to account for the within district variation of instructional expenditures over multiple years, I utilize
hierarchical linear modeling (HLM) to cluster annual observations for each district, and compar e the post-policy instructional expenditures to pre-policy instructional expenditures. HLM is appropriate for such analyses of longitudinal data (Snijders & Bosker, 1999).
According to Arsen and Ni (2012), there are several factors identified in the liter ature associated with school district resource allocation. I include the same factors as Arsen and Ni in these analyses: total district enrollment in logarithmic form, total district expenditures in
logarithmic form, property tax revenue per student in logarithmic form, and the percentage of district FLE studentsiv. Arsen and Ni also included measurements of student characteristics such as the percentage of students that receive special education services and indicators of racial characteristics, such measures are also included in these analyses.
The models are constructed beginning with policy related covariates, which differ based on model construction. Next, covariates related to district size are added, such as total number of students. Next, covariates related to district organization are added, which include the proportion of the district students in primary grades (kindergarten through fifth grade), middle grades (sixth through eighth grade), and secondary grades (ninth through twelfth grade). Next, covariates related to the characteristics of the student body are added, which include the proportion of the students that are identified as African-American, Latino, Asian-American, Native-American, and Caucasian, as well as FLE students or students eligible for IEP services. Finally, covariates related to district finances are added such as district expenditures and revenues. The dependent variable, instructional resource allocation, is calculated as the proportion of the total school district budget dedicated to instructional expenditures in a given school district ( ) for a given
30
year ( ): ⁄ . I use the DID, RD, and DRD models to examine if SB55 and HB282, which allowed start-up charter schools to open in public school districts, are
associated with changes in instructional resource allocation in targeted school districts.
In the DID models, the variables for each year are nested within a district, comprising the level one observations ( , ). Thus, the school districts are the
clustered variable and comprise the level two observations ( , )v. Level one covariates, observations pertaining to a single year, are included, however, the only level two covariate included is district treatment status, a dichotomous indicator of whether or not the district was targeted by charter school policy. In this manner, the HLM serves to cluster the standard errors of the school districts over time in the analyses. Level two covariates, such as district level means, and district centered measurements were examined, but not found to
improve model fit.
According to Meyer (1995), traditional DID designs are sensitive to variations in the functional form, meaning small changes in a single equation component may lead to skewed reporting of treatment effects. The use of HLM allows additional covariates and other tests of model fit. The independent variables in the DID models include a dichotomous indicator of whether the district was targeted by a policy ( ), a dichotomous indicator of whether the observation occurred before or after the activation of the policy
( ), and an interaction term indicating whether the district was targeted by the policy and the policy was activated [( )]. By estimating the change in instructional resource allocation for districts targeted by the policy when the policy was activated, these models estimate the degree to which charter school policies are associated
31
with changes in resource allocation in policy targeted districts. The models are displayed in equation 1 and equation 2.
Equation 1.
( )
Equation 2.
( )
Wherein measures the proportion of a school district’s budget dedicated to instructional
expenditures, is a matrix of district covariates, measures the level two residual, and measures the level one residual. The interaction variable, ) or(
), reports the size and significance of the changes in instructional resource allocation
associated with the charter school policies. In order to examine these changes, these models only include the years immediately before and after the policies were activatedvi.
The RD models include multiple years of observations before and policy activation. This accounts for pre- and post-policy trends in the targeted school districts; however, the RD datasets analyses only include policy targeted districts. In order to estimate changes in resource allocation associated with the charter school policies, I place the cut point along the X axis at the time of policy activation. By only including districts targeted by the policy, fewer level one observations are nested within the district ( = 48, = 130). Without the inclusion of comparison school districts, the level two observations are also fewer in number ( = 8, = 13). I estimate changes in the proportion of district budget allocated for instruction based on an interaction of a continuous measure of time and a dichotomous indicator of time of policy activation [( )]. Since only districts targeted by the policy are included in the analysis, there is no need for an indicator of whether the district was
32
targeted by the policy. However, a dichotomous indicator of whether the observation occurred after policy activation ( ) and a continuous indicator for year ( are
included. By estimating the change in instructional resource allocation for districts targeted by the policy when the policy was activated, but still accounting for trends occurring in the surrounding years, I attempt to measure the change in resource allocation at public school districts associated with charter school policies. These models are reflected in equation 3 and equation 4.
Equation 3.
( )
Equation 4.
( )
Wherein measures the proportion of a school district’s budget dedicated to instructional expenditures, is a matrix of district covariates, measures the level two residual, and measures the level one residual. The interaction term [ ),(
)] allows me to report the size and significance of changes in resource allocation associated with the charter school policies. An equal number of years before and after the implementation of the policies are included in both analysesvii.
The DRD models include multiple years before and after implementation, as well as a comparison group of non-targeted districts, but statistically isolate only the changes associated with the policies on the policy-targeted districts immediately following the activation of the policies. I estimate changes in resource allocation associated with the charter school policies at the time the policy was activated, while still accounting for any secular trends in instructional resource allocation. This is done by accounting for trends in time related measures and policy
33
targeted districts, as well as interactions of these measures, and by placing the cut point along the X axis at the time of policy activation. In the DRD models, a comparison group is included as well as multiple years of analysis leading to a larger number of level one observations ( , viii, and the same number of level two observations, as seen in the DID
models ( , ). Estimating the changes in the proportion of district budgets allocated to instruction associated with the activation of the policy is measured as a dichotomous indicator of whether the district was targeted by the policy and whether the observation occurred after the policy activated [( )]. These estimates are only reliable after accounting for additional measures, including: a
dichotomous indicator of whether the district was targeted by a policy ( ), a dichotomous indicator of whether the observation occurred after policy activation
( ), a continuous indicator for year ( , an indicator for year and whether the observation occurred after policy activation [( )], an indicator for year and whether the district was targeted by the policy [(
)], and an indicator for year, whether the district was targeted by the policy, and whether the observation occurred after policy activation [(
)]. These models are reflected in equation 5 and equation 6.
Equation 5.
( ) (
) ( ) ( )
34
( )
( ) ( ) ( )
Wherein measures the proportion of a school district’s budget dedicated to instructional expenditures, is a matrix of district covariates, measures the level two residual, and measures the level one residual. The interaction variable [ ),(
)] measures the change in district instructional resource allocation associated with the policy. The DRD models, like the RD models, include an equal number of years before and after the activation of the policies.
Results
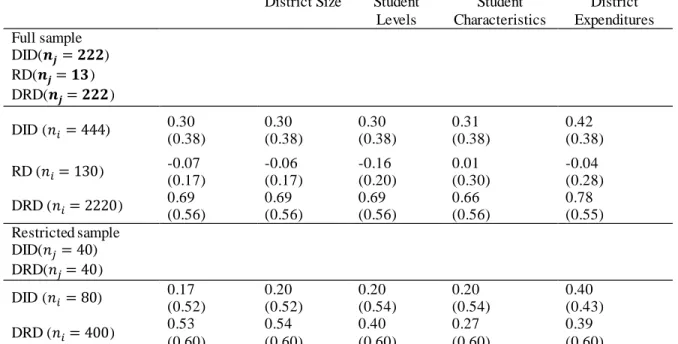
In order to examine the robustness of findings, three methods were used to examine each policy. Tables 2 and 3 report the findings from these analyses. Additional tables containing parameter estimates for the entire models are located in Appendix A. For each policy a nested DID and DRD analysis is reported examining the change in instructional resource allocation associated with the charter school policy using both datasets. The RD analyses, unlike the DID and DRD analyses, are already restricted to only policy-targeted districts and therefore, only one dataset is used to examine the outcomes associated with these analyses; as such, RD results are not reported for the restricted sample. The restricted sample comparison group more closely resembles SB55 and HB282 districts than the larger comparison group in terms of total expenditures, property tax revenue, and total students—three measures important to resource allocation (Arsen & Ni, 2012). While the restricted sample is quite dissimilar to the SB55 and HB282 districts in regards to percentage of students FLE, percentage of students with an IEP, and the racial makeup of the districts, the similarities in district size and finance characteristics
35
suggest that the estimates of changes in instructional resource allocation associated with charter school policies found using the restricted sample are more reliable than the estimates found using the full sample.
SB55 Outcomes Table 2. SB55 Outcomes Model 1: Model 2: Model 1 + District Size Model 3: Model 2 + Student Levels Model 4: Model 3 + Student Characteristics Model 5: Model 4 + District Expenditures Full sample DID( ) RD( ) DRD( ) DID ( ) 1.02* (0.51) 1.02* (0.51) 1.03* (0.51) 1.01* (0.51) 0.99* (0.50) RD ( ) 1.01~ (0.56) 1.04~ (0.57) 1.00 (0.62) 0.04 (0.87) 0.11 (0.93) DRD ( ) 2.29** (0.86) 2.29** (0.85) 2.32** (0.86) 2.46** (0.86) 2.39** (0.83) Restricted sample DID( ) DRD( ) DID ( ) 1.14* (0.56) 1.13* (0.56) 1.18* (0.58) 1.27* (0.56) 1.30* (0.51) DRD ( ) 2.18* (0.93) 2.16* (0.93) 2.54** (0.94) 2.80** (0.96) 2.85** (0.93) *p<0.05, **p<0.01, ***p<0.001
As seen in Table 2, I found in the DID analyses that the change in instructional resource allocation associated with SB55 in the districts targeted by SB55 ranged from 0.99% to 1.30%. Additionally, the standard errors of this estimate remained stable and slightly diminished with the introduction of additional covariates in models two, three, four, and five. The estimates of the changes associated with the policy were similar between both samples, despite the diminished degrees of freedom in the restricted dataset. The estimates are significant across al l models and both datasets (p<0.05). As seen in model five of both datasets, the activation of SB55 resulted in an increase in the proportion of the budget dedicated to instructional expenditures between