STANDARDIZED TEST SCORES OF AT-RISK MIDDLE SCHOOL STUDENTS by
Charles David Moore Liberty University
A Dissertation Presented in Partial Fulfillment Of the Requirements for the Degree
Doctor of Education
Liberty University July 2014
The Effects of a Direct-Instruction Math Intervention on Standardized Test Scores of At-Risk Middle School Students
by
Charles David Moore
A Dissertation Presented in Partial Fulfillment Of the Requirements for the Degree
Doctor of Education
Liberty University, Lynchburg, VA July 2014
APPROVED BY: Ralph Marino, Jr., Ed. D., Committee Chair
Jared Bigham, Ed. D., Committee Member
3 Abstract
Educators are seeking ways to improve student academic achievement in math and to increase math standardized test scores because of the requirements of the reauthorization of the Elementary and Secondary Education Act, known as the No Child Left Behind Act (NCLB), Individuals with Disabilities Education Act (IDEA), and Race to the Top initiative (RTTT). One such intervention in middle school is a direct-instruction math program. This causal-comparative study examined the relationship between a direct-instruction math intervention and math achievement on standardized test scores of at-risk middle school students. This study compared the differences in the mean scale scores for at-risk middle-school students who received a direct-instruction math
intervention and at-risk middle school students who did not receive a direct-instruction math intervention on the math subtest of the 2012 Georgia Criterion Referenced Competency Test, while using the 2011 scores as a control variable to control for
previous math ability using a one-way between-groups analysis of covariate (ANCOVA) statistical test. Further, this study compared the relationship, by gender, between a direct-instruction math intervention and math achievement on standardized test scores. The data from the study suggests that the direct-instruction mathematic intervention did result in the intervention group having a significantly higher mean scale score on the 2012 mathematic subtest of the Georgia CRCT than the control group for both genders.
Keywords: math intervention, theory of instruction, direct-instruction, extended
4 Dedication
This dissertation is dedicated to my family and the people in my life who believed in me, stood by my side, and enabled me to earn this doctoral degree.
First, I thank my Heavenly Father for being by my side during the entire journey and carrying me when necessary. His guidance during my darkest moments brought light to my life and enabled me to carry on.
My wife, Elizabeth, has stood by me during the entire process with love,
encouragement, support, patience, and understanding. Without her unwavering belief in me, I would never have finished this dissertation. I thank you from my heart and am forever grateful.
My son, Grant, believed in and supported me during the entire process. I missed many hours and opportunities to enjoy his humor and companionship. Thank you for your belief and understanding.
5 Acknowledgements
I want to acknowledge the support and advice I have received from Dr. Ralph Marino, Jr. during the process of writing my dissertation. I am deeply grateful for his guidance, patience, and understanding. I truly feel God led me to Dr. Marino, and I am forever thankful for Dr. Marino’s acceptance as Chair of my committee. Without Dr. Marino, I would never have finished the dissertation. Thank you Dr. Marino for all that you have done for me. I will never forget you.
I also want to thank my other committee members: Dr. Jared Bigham, and Dr. Lori Robertson. Your support was invaluable in completing the dissertation. Thank you.
God led me on this journey to Liberty University, where I found many wonderful teachers who were kind, patient, and understanding. Thank you all.
6 Table of Contents Abstract ... 3 Dedication ... 4 Acknowledgements ... 5 Table of Contents ... 6 List of Tables ... 10 List of Figures ... 12
CHAPTER ONE: INTRODUCTION ... 13
Background ... 15
Problem/Purpose Statement ... 18
Significance of the Study ... 19
Research Questions, Hypotheses, and Null Hypotheses ... 20
Identification of Variables ... 22
Definitions... 23
CHAPTER TWO: REVIEW OF THE LITERATURE ... 26
Theory ... 26
Math Interventions ... 32
Direct-Instruction ... 36
At-risk Students ... 42
7
Model of School Learning ... 44
Academic Learning Time ... 45
Gender ... 47
Standardized Test Scores ... 51
CHAPTER THREE: METHODOLOGY ... 56
Introduction ... 56
Design ... 56
Research Questions, Hypotheses, and Null Hypotheses ... 58
Participants ... 60
Setting ... 63
Instrumentation ... 66
Procedures ... 69
Data Analysis ... 71
CHAPTER FOUR: RESULTS ... 73
Hypothesis One ... 74
Hypothesis Two ... 82
Summary ... 94
CHAPTER FIVE: DISCUSSION ... 98
Summary of the Findings ... 98
8
Null Hypothesis One. ... 100
Null Hypothesis Two. ... 101
Theoretical Framework. ... 102
Implications... 103
Limitations ... 103
Recommendations for Future Research ... 107
References ... 109
APPENDIX A: INTERNAL REVIEW BOARD APPLICATION ... 124
APPENDIX B: IRB APPROVAL LETTER ... 137
APPENDIX C: LETTER REQUESTING SUPERINTENDENT OF SCHOOLS APPROVAL ... 138
APPENDIX D: APPROVAL LETTER FROM SUPERINTENDENT OF SCHOOLS 139 APPENDIX E: INTERVIEW CONSENT FORM ... 140
APPENDIX F: GUIDING INTERVIEW QUESTIONS ... 143
APPENDIX G: CONSENT FORM – PRINCIPAL OF INTERVENTION SCHOOL .. 144
APPENDIX H: GUIDING INTERVIEW QUESTIONS – PRINCIPAL OF INTERVENTION SCHOOL ... 146
APPENDIX I: CONSENT FORM – ACADEMIC COACH AT INTERVENTION SCHOOL... 147
APPENDIX J: GUIDING INTERVIEW QUESTIONS - ACADEMIC COACH AT INTERVENTION SCHOOL ... 149
9
APPENDIX K: CONSENT FORM – ACADEMIC COACH AT CONTROL SCHOOL ... 151 APPENDIX L: GUIDING INTERVIEW QUESTIONS - ACADEMIC COACH AT CONTROL SCHOOL ... 153
10 List of Tables
Table 2.1 Reliability Coefficients (Cronbach’s Alpha) and Raw Score SEM for Math by
Grade ……….55
Table 3.1 Demographics of Participating Schools ………62
Table 3.2 Participant Treatment Sample Breakdown by Grade Level ……….62
Table 3.3 Participating Gender Sample Breakdown for each Intervention by Grade Level ………63
Table 3.4 Rotating Connections Class Schedule ………..65
Table 3.5 Reliability Coefficients (Cronbach’s Alpha) and Raw Score SEM for Math by Grade ……….68
Table 4.1 Descriptive Statistics for 2011 Scores by Intervention ……….75
Table 4.2 Descriptive Statistics for 2012 Scores by Intervention ……….75
Table 4.3 Test of Normality for CRCT Scores by Intervention ………...77
Table 4.4 Test of Homogeneity of Slopes for Intervention Groups ……….79
Table 4.5 Levene’s Test of Equality of Variances for 2012 Scores ……….79
Table 4.6 Descriptive Statistics for 2011 Scores by Intervention ……….80
Table 4.7 Descriptive Statistics for 2012 Scores by Intervention ……….80
Table 4.8 Adjusted Means by Intervention ………...80
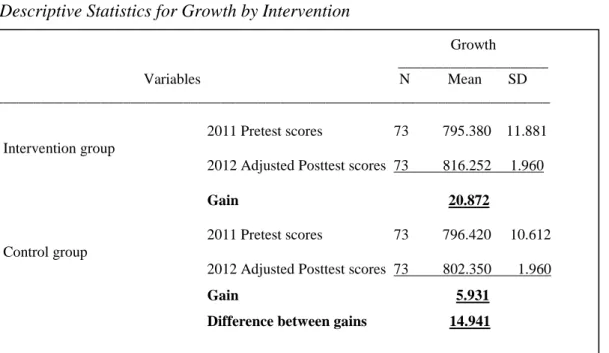
Table 4.9 Descriptive Statistics for Growth by Intervention ………81
Table 4.10 ANCOVA for Hypothesis One ………...82
Table 4.11 Descriptive Statistics for 2011 CRCT Scores by Intervention for each Grade Level ……….83 Table 4.12 Descriptive Statistics for 2011 CRCT Scores by Intervention for each Grade
11
Level ……….83
Table 4.13 Test of Normality for 2011 Scores by Gender ………86
Table 4.14 Test of Normality for 2011 Scores by Gender ………86
Table 4.15 Test of Homogeneity of Slopes by Gender ……….89
Table 4.16 Levene’s Test of Homogeneity of Variance by Gender ……….89
Table 4.17 Descriptive Statistics for 2011 Scores by Intervention ………...90
Table 4.18 Descriptive Statistics for 2012 Scores by Intervention ………...91
Table 4.19 Adjusted Means by Intervention for each Gender ………..91
Table 4.20 Descriptive Statistics for Growth, by Gender, for each Intervention …...…..92
Table 4.21 ANCOVA for Null Hypothesis Two ………...……...93
12 List of Figures
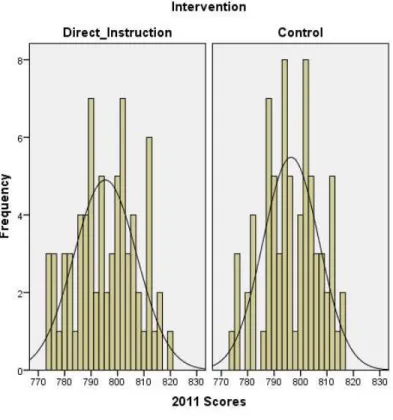
Figure 4.1 Histogram of 2011 CRCT Scores by Intervention ... 76
Figure 4.2 Histogram of 2012 CRCT Scores by Intervention ... 76
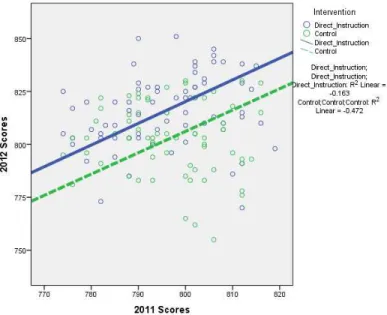
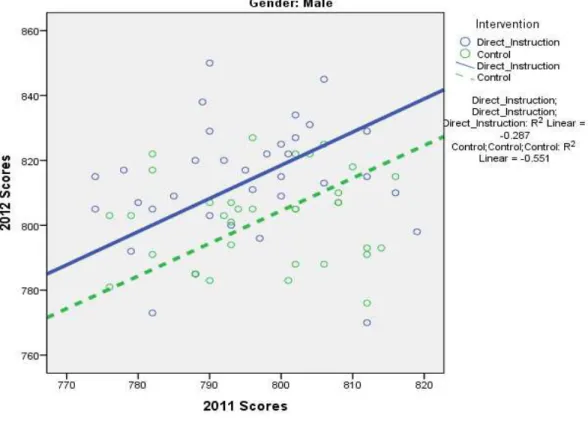
Figure 4.3 Scatterplot of 2011 and 2012 CRCT Scores by Intervention ... 78
Figure 4.4 Histogram of 2011 Scores by Intervention for Females ... 84
Figure 4.5 Histogram of 2011 Scores by Intervention for Males ... 84
Figure 4.6 Histogram of 2012 Scores by Intervention for Females ... 85
Figure 4.7 Histogram of 2011 Scores by Intervention for Males ... 85
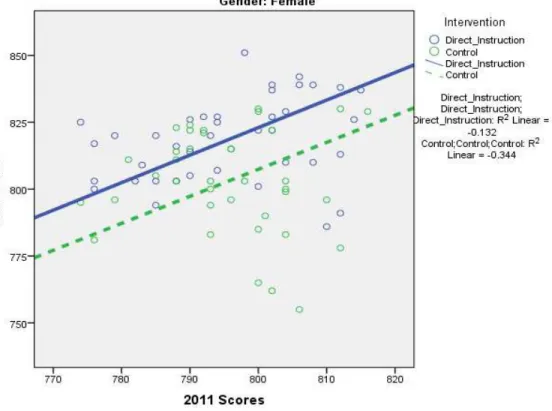
Figure 4.8 Scatterplot of 2011 and 2012 CRCT Scores by Intervention for Females ... 87
13
CHAPTER ONE: INTRODUCTION
The reauthorization of the Elementary and Secondary Education Act, known as the No Child Left Behind Act (NCLB) of 2001, and the renewal of the Individuals with Disabilities Education Act (IDEA) in 2004, resulted in the requirement that schools must demonstrate annual yearly progress (AYP) in student achievement by assessing students using standardized tests (No Child Left Behind Act of 2001, 2008). AYP is an annual measurement of student achievement on statewide assessments. The goal of these laws is to ensure all students, including all subgroups, are meeting the state’s content standards. NCLB provides a foundation for the Race to the Top initiative. The Race to the Top (RTTT) initiative is voluntary. RTTT provides incentives in the way of additional federal funding to states that reform their educational system in four areas: (1) enhancing
standards and assessments, (2) improving collection and use of data, (3) increasing teacher effectiveness and achieving equity in teacher distribution, and (4) turning around low-achieving schools (Lohman, 2010). RTTT still requires states to rely on
standardized testing to measure academic achievement to ensure students are progressing. Additionally, RTTT requires states to focus on teacher effectiveness (Lohman, 2010). In Georgia, individual schools are placed in achievement categories based on their students’ standardized test scores. Additionally, 50% of teachers’ annual evaluations are based directly on their students’ standardized test scores (House Bill 244, 2013).
Low standardized test scores are one of the characteristics of at-risk students, and are a good predictor of whether a student will graduate high school. A study of a
California school district found that fewer than half of the students who scored below the 50th percentile in either math or language arts in the sixth, seventh, or eighth grade
14
graduated high school (Silver, Saunders, & Zarate, 2008). Monrad (2007) found that dropouts are less likely to obtain stable jobs than in the past. Dynarski et al. (2008) found that each year more than half a million students drop out of high school, and earn an average of $9,000 a year less than students who graduate. Additionally, according to Niederle and Vesterlund (2010), “math test scores serve as a good predictor of future income. Although the magnitude of the effect of math performance on future income varies by study, the significant and positive effect is consistently documented” (p. 130). As a result, the importance of understanding how to close the math achievement gap and increase math standardized test scores continues to play an important role in educational reform.
In the examination of mathematic interventions, gender differences are an important factor to consider. A review of the literature suggests that students differ, by gender, in mathematic achievement and learning (Fryer & Levitt, 2010; Rosselli, Ardila, Matute, & Inozemtseva, 2009). In order to ensure a direct-instruction mathematic intervention is effective for both genders, it is important to understand the relationship that a direct-instruction mathematic intervention may have on male and female
mathematic achievement on standardized test scores. The purpose of this study is to examine the relationship between a
direct-instruction mathematic intervention and student achievement on mathematic standardized test scores for at-risk middle school students. Because research suggests students differ by gender in mathematic achievement and learning (Geist & King, 2008; Halpern, 2004; Kommer, 2006; Leanne, David, & Fien, 2008), this study will also
15
and math achievement on standardized test scores to determine if the intervention helps improve test scores for both males and females.
Background
On January 8, 2002, President Bush signed the No Child Left Behind Act (NCLB) of 2001 that reauthorized the Elementary and Secondary Education Act (ESEA). NCLB significantly raised the expectations for state and local school districts, requiring that within twelve years all students meet or exceed state standards in reading and
mathematics. NCLB has placed an emphasis on student achievement for all students. The goal of this law is to improve academic achievement for all students by closing the achievement gap and making sure all students, including those at risk, and all subgroups, including race/ethnicity, disability, limited English proficiency (LEP), and socioeconomic status (SES), are academically successful (No Child Left Behind Act of 2001, 2008).
In addition to NCLB, IDEA was renewed in 2004 with modifications to align with NCLB. The most significant modification to IDEA is that performance goals and
indicators be consistent with those of students without disabilities; therefore, all students must meet the same standards set by the state (U. S. Department of Education, 2007).
NCLB and IDEA have implemented required standardized testing to provide evidence that students are meeting the state’s content standards (U. S. Department of Education, 2007). Both laws also require schools to provide research-based interventions for students who are not meeting the required standards (U. S. Department of Education, 2007). IDEA resulted in the introduction of Response to Intervention (RTI). RTI assists schools in providing and documenting research-driven support as required by NCLB and
16
IDEA for students at risk of failure. RTI is a multi-tiered approach that provides students with the assistance necessary to meet their academic needs (Barnes & Harlacher, 2008). With information garnered from the RTI process and research available on interventions, educators can provide better-informed decisions regarding interventions for at-risk students (Gersten et al., 2009). Because of this legislation, many states have begun to move quickly toward the implementation of some form of RTI (Berkley, Bender, Peaster, & Saunders, 2009).
No Child Left Behind provides the foundation for the Race to the Top (RTTT) initiative. RTTT is voluntary and provides incentives in the way of additional federal funding to states that reform their educational system in four areas: (1) enhancing standards and assessments, (2) improving collection and use of data, (3) increasing teacher effectiveness and achieving equity in teacher distribution, and (4) turning around low-achieving schools (Lohman, 2010). RTTT still requires states to rely on
standardized testing to measure academic achievement to ensure students are progressing. Additionally, RTTT requires states to focus on teacher effectiveness (Lohman, 2010).
Research suggests math interventions have been shown to improve standardized test scores (Bahr, 2008; Bryant et al., 2008; Bryant, Bryant, Gerstein, Scammacca, & Chavez, 2008; Ketterlin-Geller, Chard, & Fien, 2008; Kroesbergen & Van Luit, 2003; Leanne, David, & Fien, 2008; Mong & Mong, 2010). Most research has been conducted at the primary grades level. However, a review of the literature indicates the mathematic achievement gap continues through the middle and upper grade levels (National
Assessment of Educational Progress (NAEP), 2011; Trends in International Mathematics and Science Study (TIMMS), 2011). Because of the requirements of NCLB, IDEA, and
17
RTTT, it is important to understand if a math intervention helps to improve student
achievement on mathematic standardized test scores for at-risk middle school students. Additionally, a review of the literature suggests gender plays a role in mathematic
achievement and learning. This difference in achievement may begin in the lower grades, and increases throughout the grades. “The bulk of the evidence in the past 50 years suggests that the gender gap in mathematics does not exist before children enter school, but is significant in the middle school years and beyond” (Fryer & Levitt, 2010, p. 211). “The gap between boys and girls seems to increase in high-school, where by the 12th grade males show very significant advantages over females of the same age in mathematical achievement tests” (Rosselli, Ardila, Matute, & Inozemtseva, 2009, p. 217). A review of the literature suggests one possible reason for the gap is males and females learn differently (Geist & King, 2008; Halpern, 2004; Kommer, 2006; Kulturel-Konak, D’Allegro, & Dickinson, 2011). In order to ensure a mathematic intervention is effective for both males and females, it is important to consider gender in understanding the relationship a direct-instruction mathematic intervention may have on mathematic achievement on standardized test scores.
This study will investigate if Engelmann and Carnine’s (1991) theory of
instruction can help improve mathematic achievement on standardized test scores for at-risk students in middle school. Theory of instruction is the basis for the direct-instruction method of teaching. This study will contribute to the literature an understanding of how a direct-instruction mathematic intervention can influence
mathematic standardized test scores for at-risk middle school students. Because research suggests that genders differ in mathematic achievement and learning, this study will also
18
contribute to the literature an understanding of how a direct-instruction mathematic intervention can influence mathematic standardized test scores for male and female at-risk middle school students.
Problem/Purpose Statement
According to a 2011 National Assessment of Educational Programs (NAEP) report, Georgia math standardized test scores are lower than those of math standardized test scores in 38 states and only higher than math standardized test scores in 8 states. A 2011 study conducted by Trends in International Mathematics and Science Study
(TIMMS) reported that the average mathematics score of U.S. 4th graders was among the top 15 education systems, with eight systems scoring higher and six systems with no measurable differences. A comparison of the average mathematics score of U.S. 8th graders was among the top 24 education systems, with 11 systems scoring higher and 12 systems with no measurable difference. Georgia Title I schools making AYP has
decreased from 82.7% in 2007 to 69.5% in 2011(Georgia Department of Education, 2011). Therefore, the problem is low math scores on mathematic standardized tests for at-risk students, both in Georgia and nationally.
The purpose of this quantitative causal-comparative study is to test the theory of instruction, which suggests that a direct-instruction teaching method will improve student achievement. The study will compare the independent variable of a direct-instruction mathematic intervention program consisting of two levels (a control group receiving no intervention and a treatment group receiving a direct-instruction mathematic
intervention), to the dependent variable, the mean scores of the mathematic subtest of the 2012 Georgia CRCT. The previous year’s 2011 Georgia mathematic scores will be used
19
as a covariate to control for previous mathematic ability. The participants will consist of at-risk middle school students attending Title I schools in a rural school district in
Georgia.
Significance of the Study
The significance of the study is to contribute to the literature an understanding of the relationship between a direct-instruction math intervention provided to at-risk middle school students and improvement of mathematic achievement on standardized test scores.
Przychodzin, Marchand-Martella, and Azim (2004) stated the need for more research on the effects of direct-instruction based on learner characteristics, such as at-risk. Flores and Kaylor (2007) stated the need for future research to study how the components of direct-instruction could be used to enhance an existing curriculum and the effects of those methods on student achievement.
A review of the literature revealed most studies on mathematic interventions, including direct-instruction, have been conducted at the primary grades level (Bryant et al., 2008; Bryant, Bryant, Gerstein, Scammacca, & Chavez, 2008; Leanne et al., 2008; Mong & Mong, 2010). However, research suggests that the math achievementgap continues at the middle grades and beyond (National Assessment of Educational Progress, 2011; Trends in International Mathematics and Science Study, 2011). Therefore, more research is needed at the middle grades level to address the needs of at-risk middle school students.
Additionally, since research suggests that male and female students differ in mathematic achievement and learning (Geist & King, 2008; Halpern, 2004; Kommer, 2006; Kulturel-Konak, D’Allegro, & Dickinson, 2011), this study will contribute to the
20
literature an understanding if a direct-instruction math intervention can improve student math achievement on standardized tests for both males and females.
This study also specifically addresses the concerns of the school district in which the study is taking place. Because of the need to improve test scores for at-risk math students, the school administrator has implemented a math intervention at one of the two middle schools in the study. This intervention is SRA Math Skillbuilder by McGraw Hill.
SRA Math Skillbuilder is a direct-instruction mathematic intervention program designed
for McGraw Hill by Siegfried Engelmann (McGraw Hill Education, 2013). This study will help to assess the math intervention program’s effectiveness on mathematic standardized test scores. This study will also help to assess the math intervention program’s effectiveness for males and females. This study can offer suggestions to aid the school administrators in making informed curriculum decisions based on the effectiveness of the mathematic intervention program.
Research Questions, Hypotheses, and Null Hypotheses
The first guiding research question is: Does a direct-instruction math intervention improve student mathematic achievement on standardized test scores for at-risk middle school students?
RQ1: Do at-risk sixth, seventh, and eighth-grade students who receive a direct-instruction math intervention have statistically significant different mean scale scores on the 2012 Georgia mathematic CRCT when compared to at-risk sixth, seventh, and eighth-grade students who do not receive a direct-instruction math intervention, while using their 2011 Georgia mathematic CRCT test scores as a covariate to control for previous math achievement?
21
H1: At-risk sixth, seventh, and eighth-grade students who receive a direct-instruction math intervention will have statistically significant different mean scores on the 2012 Georgia mathematic CRCT when compared to at-risk sixth, seventh, and eighth-grade students who do not receive a direct-instruction math intervention, while using their 2011 Georgia mathematic CRCT test scores as a covariate to control for previous math achievement.
Ho1: At-risk sixth, seventh, and eighth-grade students who receive a direct-instruction math intervention will not have statistically significant different mean scale scores on the 2012 Georgia mathematic CRCT when compared to at-risk sixth, seventh, and eighth-grade students who do not receive a direct-instruction math
intervention, while using their 2011 Georgia mathematic CRCT test scores as a covariate to control for previous math achievement.
The second guiding research question is: Is the direct-instruction mathematic intervention effective for both genders?
RQ2: Based on gender, do at-risk sixth, seventh, and eighth-grade students who receive a direct-instruction math intervention have statistically significant different mean scale scores on the 2012 Georgia mathematic CRCT when compared to at-risk sixth, seventh, and eighth-grade students who do not receive a direct-instruction math intervention, while using their 2011 Georgia mathematic CRCT test scores as a covariate to control for previous math achievement?
H2: Based on gender, at-risk sixth, seventh, and eighth-grade students who receive a direct-instruction math intervention will have statistically significant different mean scores on the 2012 Georgia mathematic CRCT when compared to at-risk
22
sixth, seventh, and eighth-grade students who do not receive a direct-instruction math intervention while, using their 2011 Georgia mathematic CRCT test scores as a covariate to control for previous math achievement.
Ho2: Based on gender, at-risk sixth, seventh, and eighth-grade students who receive a direct-instruction math intervention will not have statistically significant different mean scale scores on the 2012 Georgia mathematic CRCT when compared to at-risk sixth, seventh, and eighth-grade students who do not receive a
direct-instruction math intervention while, using their 2011 Georgia mathematic CRCT test scores as a covariate to control for previous math achievement.
In addressing the research questions, the study will accept or reject the null hypotheses. Identification of Variables
For Research Questions 1 and 2, the independent variable is a direct-instruction math intervention consisting of two levels, students who received a math intervention (treatment group) and students who did not receive a math intervention (control group); the dependent variable is the 2012 mean scores of the math subtest of the Georgia
Criterion Referenced Competency Test. The 2011 mean scores of the math subtest of the Georgia Criterion Referenced Competency Test will serve as the covariate.
In a study conducted by Vandervoot, Amrein-Beardsley, and Berliner (2004), the dependent variable was the yearly gains on the Stanford Achievement Test (SAT-9). The scaled scores associated with the SAT-9 were used as a pretest-posttest measure of yearly achievement growth for each student in the sample. The differences in each student’s scaled score from year to year were reported as gain scores. Because the students were not placed in classrooms in a random manner, the possibility existed that
23
the groups may have been different prior to the study. For this reason, a pretest-posttest design was used where covariance adjusted gain scores were used to control for the effects that non-random assignment might have had on student’s growth over time. The use of the pretest as a covariate reduced the amount of difference or natural variation that could obscure effects within groups, as well as between them. The covariance
adjustment makes the two compared more uniform, tending to eliminate bias in the sample (Vandervoot et al., 2004, p. 22).
According to McMillan and Schumacher (2010), secondary data analysis is becoming more popular as federal and state data sets are released because of NCLB. “Researchers can take these data sets and conduct studies that compare achievement among the groups or examine trends” (p. 23).
Definitions
A Model of School Learning- A theory put forth by John Carroll that states the degree of learning equals time spent learning divided by time needed to learn (Carroll, 1963). Academic Learning Time (ALT) - The actual part of class time during which students are actively engaged in successfully learning subject matter that is valued (Berliner, 1990). Adequate Yearly Progress (AYP) - Adequate Yearly Progress is a requirement of the federal No Child Left Behind Act. It is a measure of year-to-year student achievement on statewide assessments (Georgia Department of Education, 2013).
At-risk student- “An at-risk student is a student with specific needs that may hinder academic achievement, graduation, or ability to successfully transition to college or career opportunities” (Georgia Department of Education, 2011, Glossary, para. 7).
24
Behaviorism- Behaviorism emphasizes that behavior is directed by stimuli. An individual selects one response instead of another because of prior conditioning and psychological drives. Behaviorism posits that all behavior is learned habits, and attempts to explain how these habits are formed (Miller, 2011).
Criterion Referenced Competency Test (CRCT) - “The CRCT is designed to measure how well students acquire the skills and knowledge described in the state-adopted curriculum, including the Common Core Georgia Performance Standards (CCGPS) in reading, English/language arts, and mathematics, and the Georgia Performance Standards (GPS) in science and social studies. The assessments yield information on academic achievement at the student, class, school, system, and state levels. This information is used to diagnose individual student strengths and weaknesses as related to the instruction of the state-adopted curriculum and to gauge the quality of education throughout
Georgia” (Georgia Department of Education, 2013, para. 1).
Individual Disabilities Education Act (IDEA) - “The Individuals with Disabilities Education Act (IDEA) is a law ensuring services to children with disabilities throughout the nation. IDEA governs how states and public agencies provide early intervention, special education, and related services” (U. S. Department of Education, 2004, para. 1). Intervention – “Targeted instruction that is based on student needs. Interventions supplement the general education curriculum. Interventions are a systematic compilation of well-researched or evidence-based specific instructional strategies and techniques” (Georgia Department of Education, 2011, p. 12).
National Assessment of Educational Progress (NAEP) - “The National Assessment of Educational Progress (NAEP) is the largest nationally representative and continuing
25
assessment of what America's students know and can do in various subject areas. Assessments are conducted periodically in mathematics, reading, science, writing, the arts, civics, economics, geography, and U.S. history” (National Assessment of
Educational Progress (NAEP), 2011, para. 1).
National Center for Educational Statistics (NCES)- “The National Center for
Educational Statistics is the primary federal entity for collecting and analyzing data related to education” (National Center for Educational Statistics, 2013, para. 1). No Child Left Behind Act of 2001(NCLB) - The No Child Left Behind Act of 2001 reauthorized the Elementary and Secondary Education Act (ESEA). No Child Left Behind significantly raises expectations for states, local school districts, and schools in that all students will meet or exceed state standards in reading and mathematics in twelve years (Georgia Department of Education, 2013, para. 1).
Response to Intervention (RTI)- “Response to Intervention (RTI) is a practice of academic and/or behavioral interventions designed to provide early, effective assistance to underperforming students” (Georgia Department of Education, 2011, para. 1).
Trends in International Mathematics and Science Study (TIMMS) - “For the past 20 years, TIMMS has measured trends in mathematics and science achievement at the fourth and eighth grades. It has been conducted on a regular 4-year cycle” (Trends in
International Mathematics and Science Study (TIMMS), 2011, para. 1). Time on Task- Engaged time on a particular learning task (Berliner, 1990).
26
CHAPTER TWO: REVIEW OF THE LITERATURE Theory
The theoretical framework for this study is Engelmann and Carnine’s theory of instruction. Theory of instruction was developed by Engelmann and Carnine (1991) and used to study the most effective and efficient way to teach so that students can learn successfully. The theory indicates that by using faultless communication, students are able to effectively and efficiently learn through explicit instruction and examples, and generalize to new examples based on sameness of quality. As applied to this study, theory of instruction holds that the independent variable, a direct-instruction math intervention, should influence the dependent variable, mathematic achievement on the mathematic subtest of the Georgia CRCT. The theory suggests that by using a direct-instruction math intervention, students will learn more effectively and efficiently and their achievement will improve. Engelmann and Carnine’s theory of instruction is not a learning theory that describes how people learn. Learning theories suggest how people learn in the absence of instruction. Theory of instruction examines the
components of instruction, and suggests the best method for providing effective and efficient instruction. Engelmann and Carnine’s theory evolved through application of logical analysis to years of existing empirical observations. According to Engelmann and Carnine (1991), “the strategy of making the communication faultless and then observing the performance of the learner is the basis for the theory of instruction” (p. 3).
Magliaro, Lockee, and Burton (2005) state that Engelmann and Carnine’s theory of instruction is “rooted in behavioral theory, particularly the radical or selectivist behaviorism of Skinner” (p. 41). According to Magliaro et al. (2005), theory of
27
instruction is “based on the basic notion that behavior evolves or is selected by the
environment. Those behaviors that work are selected by the consequences that follow the behavior. Since there are different consequences for the same behavior in different environments, behaviors are situated in contexts” (Magliaro et al., 2005, p. 42).
Engelmann and Carnine’s textbook, Theory of instruction: Principles and
Applications (Engelmann & Carnine, 1991), was first published in 1982, and explains the
principles guiding the theory and applications of the theory. “Engelmann and Carnine’s theory builds upon two initial assumptions: that learners perceive qualities and that they generalize upon the basis of sameness of qualities” (Engelmann & Carnine, 1991, p. preface).
Theory of instruction begins with the assumption that the environment is the primary variable in accounting for what the learner learns. Although the environment is assumed the primary cause of what is learned, it is not assumed the total cause. Within any group of people there are individual differences; therefore, the learner is also the variable. To show the relationship between the learner and the environment, one of the variables must be controlled. Since the learner cannot be controlled, Engelmann and Carnine’s solution is to control the environment (Engelmann & Carnine, 1991).
Designing instruction so it would communicate to the learner one single interpretation is known as faultless communication. Faultless communications are designed to convey only one interpretation. There would be no misunderstandings, therefore enabling the learner to understand any concept. These communications would be capable of teaching any learner who possesses the minimal attributes the intended concept or skill. Either the learner responds to the faultless communication by learning
28
the intended concept or the learner fails to learn the intended concept. In either case, the learner’s performance is framed as the dependent variable. The strategy of making the communication faultless and then observing the performance of the learner is the basis for the theory of instruction. This strategy is used for designing instructional sequences and in deriving principles for communicating with the learner (Engelmann & Carnine, 1991). The following is a summary of the steps used in the strategy: a) design
communications that are faultless using logical analysis of the stimuli, not a behavioral analysis of the learner, b) predict that the learner will learn the concept conveyed by the faultless presentation, c) present the communication to the learner and observe whether the learner actually learns the intended concept or whether the learner has trouble, d) design instruction for the unsuccessful learner that will modify the learner’s capacity to respond to the faultless presentation (Engelmann & Carnine, 1991, p. 3).
According to Engelmann and Carnine (1991), “the learning mechanism has two attributes: a) the capacity to learn through examples any quality that is exemplified, and b) the capacity to generalize to new examples based on sameness of quality (and only based on sameness)” (p. 4). The capacity to learn any quality from examples indicates what the learner is capable of learning, not how they learn. A quality is any irreducible feature of the example. The simplest way to identify qualities is to begin with a concrete example. The assumption that the learner learns qualities simply means that if an
example possesses a quality, no matter how subtle, the learner has the capacity to learn that quality. The capacity to generalize to new examples based on sameness suggests how learning occurs. According to this attribute, the learner somehow makes up a rule that indicates which qualities are common to the set of examples presented to teach a
29
concept. By using this rule, the learner classifies new examples as either positive examples of the concept or negative examples. A new example is positive if it has the same qualities possessed by all positive examples presented earlier; it is a negative example if it does not have the same qualities. According to the assumption about the generalization attribute, there is no sharp line between initial learning and generalization. The only possible basis for generalization is sameness of quality (Engelmann & Carnine, 1991).
The two-attribute learning mechanism suggests that the learner operates on qualities and sameness, and that both the qualities and sameness come from the concrete examples that have the same quality and provide information that these concrete
examples are the same in a relevant way (Engelmann & Carnine, 1991).
There are five structural conditions a communication of basic concepts must meet to be capable of producing a particular generalization. First, the set of positive examples must possess only one distinguishing quality. For example, if every positive example of the color purple presented to the learner was a triangle, and every example presented as not purple was box-shaped, at least two generalizations are presented by the same communication. The learner may call any triangle purple regardless of color. Since a given learner is assumed to have no previous knowledge of the concept and must base generalization solely on the quality and sameness of demonstrated examples, a given learner may learn an inappropriate generalization from an example with more than one distinguishing quality. To avoid this problem, inappropriate qualities must be eliminated from the demonstration examples. The simplest way to achieve this is to modify the set
30
of examples so that some of the examples identified by the teacher as not purple are triangles (Engelmann & Carnine, 1991).
Second, the communication must also provide a signal that accompanies each example that has the quality to be generalized. This signal is the only means available for treating examples in the same way. In the example above, saying “purple” for all
examples that are purple provides the learner with a basis for communicating with the teacher. The assumption about the signal accompanying the various examples is necessary because the goal is to induce a particular generalization. For the most basic type of communication, two signals are implied; one is used for examples that have the quality, and another is used for examples that do not have the quality (Engelmann & Carnine, 1991).
Third, the communication must present a range of examples that show the physical variation of the examples that exhibit a common quality. The communication must present positive examples that are physically different but that share the quality that is to be generalized. For example, examples for the quality purple would need to present different shades of purple for the learner. The requirement of showing a range of positive variations derives directly from the assumptions about the learning mechanism. It is assumed that the learner is capable of learning any quality exemplified through examples. For most concepts, the quality is something that is common to variations that are
physically different. If the learner is not shown an appropriate range of variation, the learner may not be provided with enough information to formulate an appropriate “rule” (Engelmann & Carnine, 1991).
31
Fourth, a basic communication must present negative examples to show the limits of the variation in quality that is permissible for a given concept. To show the learner basic concepts, the communication must demonstrate the boundaries for the range of permissible generalizations. For example, all negatives presented to demonstrate the limits of permissible variation are the same in that they possess the quality of being “not purple.” To signal that these negative examples are the same, a common behavior is presented with each example. To assure that the learner does not classify these examples in the same way that the positive examples are classified, the communication presents a different signal for the negatives, for example, “not purple.” The basic communication therefore presents two sets of examples, one for positive and one for negative, and two distinct signals, one for positive and one for negative (Engelmann & Carnine, 1991).
Fifth, the communication must provide a test to assure that the learner has received the information provided by the communication. The test should provide positive and negative examples that had not been demonstrated earlier but that are implied through the range of variation of quality demonstrated for the positives and negatives (Engelmann & Carnine, 1991).
In summary, Engelmann and Carnine (1991) postulated a learning mechanism that has these attributes: the capacity to learn any stimulus quality shown through examples, and the capacity to generalize a sameness of quality to new examples. This assumed mechanism implies that the primary analysis of cognitive learning must focus on quality and sameness of the examples presented to the learner. Further implications suggest the structural criteria that must be met by a communication if the communication is to induce a generalization for a basic concept.
32
1. The positive examples of the concept must be distinguished by one, and only one quality.
2. An unambiguous signal must accompany each positive example, and a different signal must accompany each negative example.
3. The examples must demonstrate the range of variation to which the learner will be expected to generalize.
4. Negative examples must clearly show the boundaries of permissible positive variation.
5. Test examples, different from those presented to demonstrate the concept, assure that the generalization has occurred (p. 8).
Faultless communication and generalization is the core of Engelmann and Carnine’s theory of instruction. It utilizes explicit instruction with both positive and negative examples. It is a teacher-led instructional strategy. What a learner learns is a function of the instruction received. If the students are capable of leaning but do not learn, it is assumed to be the fault of the instruction (Engelmann & Carnine, 1991). Math Interventions
A 2011 study conducted by Trends in International Mathematics and Science Study (TIMMS) reports that U.S. math scores are improving; however, the average mathematics score of U.S. 4th graders was among the top 15 education systems, with 8 systems scoring higher and 6 systems with no measurable differences. A comparison of the average mathematics score of U.S. 8th graders was among the top 24 education systems, with 11 systems scoring higher and 12 systems with no measurable difference (Trends in International Mathematics and Science Study, 2011).
33
One possible intervention that may be used to help students meet the requirements of No Child Left Behind (NCLB), response to intervention (RTI), and Race to the Top (RTTT) is a math intervention program. Georgia’s Department of Education defines intervention as “Targeted instruction that is based on student needs. Interventions supplement the general education curriculum. Interventions are a systematic compilation of well
researched or evidence-based specific instructional strategies and techniques” ("Response to Intervention,” 2011, p. 12).
In Georgia the Remedial Education Program (REP) is a part of the Response to Intervention (RTI) framework and is “an instructional program designed for students in grades 6-12 who have deficiencies in reading, writing, and math. This program provides individualized basic skills instruction as mandated by Georgia Law in the areas of reading, writing, and mathematics. . . . The REP Program provides a structure for additional instruction to ensure students meet grade level expectations at the middle and high school level.” (Georgia Department of Education, 2013, p. 3). Eligible students include students in grades 6-12 if they meet two or more of the following criteria: a) a formal student support team process containing documented evidence that supports remedial placement, b) the student has been retained in the grade in which he or she is enrolled, c) the student is eligible to receive services under Part A of Chapter 1 of Title 1, d) the student has been recommended by a teacher who has documented low performance in reading or math; current standardized test information indicates the student has scored at or below the 25th percentile in reading, writing, or mathematics; or the student
demonstrates an inability to verbally express ideas or write a meaningful sentence. For participation in a middle school intervention program, the most recent Criterion
34
Referenced Competency Test (CRCT) scores indicate the student has a score in the “Does Not Meet” category in reading, English/language arts, or mathematics (Georgia Department of Education, 2013, p. 4).
A math intervention can take the form of a supplemental program using direct-instruction. Instruction may consist of remediation of current standards students are struggling with and/or the teaching of current standards concurrently with the regular education mathematic classes. During the school year, Georgia allows middle schools to provide intervention math services in suggested models such as the pullout class, reduced class size, extension class, or during the connections block. Students are to receive direct-instruction from a state-certified teacher on their instructional level for a minimum of 50-60 minutes.
Several recent meta-analyses have been conducted on the features of mathematics instruction that most benefit at-risk students. A meta-analysis conducted by Gersten et al. (2009) examined 42 interventions by instructional strategies. The instructional strategies found to be statistically effective were: a) explicit instruction with a mean effect size of 1.22, b) use of heuristics with a mean effect size of 1.56, c) student verbalization of math reasoning with a mean effect size of 1.04, and d) sequence and range of examples with a mean effect size of 0.82. A meta-analysis by Kroesbergen & Van Luit (2003) of 58 studies of mathematic interventions for elementary students with special needs found the following teaching methods to be statistically effective: teaching basic facts had a mean effect size of 1.14, direct-instruction had a mean effect size of 0.91, and self-instruction had a mean effect size of 1.45.
35
In a meta-analysis of math interventions for students with emotional and behavioral problems, Templeton, Neel, and Blood (2008) used Percentage
Nonoverlapping Data (PND) to measure effect size. According to Templeton et al. (2008), “PND is calculated by finding the percentage of intervention points that exceed the highest baseline point” (p.231). The highest baseline point was retrieved for each pair of baseline and treatment phases. A PND between 70% and 90% is considered effective. Interventions that focused on math performance as the primary interest had a mean intervention PND of 87.30. Interventions that focused on strategy instruction had a mean intervention PND of 86.41. Interventions that focused on instructional delivery had a mean intervention PND of 86.41.
Research conducted on math intervention at the elementary grade level suggests math intervention is effective. In a study by Mong and Mong (2010), two interventions designed to enhance math fluency were evaluated. Math to Mastery (MTM) and Cover, Copy, and Compare (CCC) were both shown to be effective at increasing mathematic fluency for elementary students.
A study by Bryant, Bryant, Gersten, Scammacca, and Chavez (2008) examined the effects of a mathematic intervention consisting of tutoring sessions in same-ability, small instructional groups consisting of three or four first and second-grade students. A regression-discontinuity analysis revealed that no significant effect was observed among first-grade students; however, a significant main effect (β = .19, p = .018) was observed between second grade students. Another study by Bryant, Bryant, Scammacca, Winter, and Shih (2008) examined the effects of a mathematic intervention consisting of booster lessons on specific number, operations, and quantitative reasoning performance of
36
students in first grade that were identified as having mathematics difficulties. A regression-discontinuity analysis revealed a positive effect ( β = .21, p = .014) for the intervention for first grade students.
At the middle school level, studies also suggest a math intervention program can increase mathematic performance. A study by Flores and Kaylor (2007) on seventh-grade at-risk students examined a direct-instruction math intervention consisting of 14 instructional lessons on fraction performance. The following results were reported: a) 76% increase in translating whole numbers into fractions, b) 68% increase in
translating fractions into whole numbers, c) 63% increase in multiplication of like
fractions with like denominators, d) 70% increase in addition and subtraction of fractions with like denominators, e) 54% increase in addition and subtraction of mixed numbers with like denominators, and f) 66% increase in multiplication of whole numbers and fractions.
Another study by Ketterlin-Geller, Chard, and Fien (2008) examined the effects of two supplemental interventions on the mathematics achievement of low-performing intermediate-grade students. An intervention designed to reteach fundamental
mathematics and an intervention designed to provide extended time in the core curriculum were studied. After a 156-week intervention with 51 low-performing students, the authors found the students in both interventions outperformed students in the control group.
Direct-Instruction
A review of the literature indicates that direct-instruction may be an effective mathematic intervention to help improve at-risk students’ standardized test scores. In
37
1968 the U. S. Office of Education initiated one of the largest comprehensive programs of its kind for economically disadvantaged children called Project Follow Through. The participants consisted of disadvantaged primary grade students in 180 communities. The project was designed to study the variations of different educational approaches over several years. In spite of its weaknesses in design, the Follow Through study produced new knowledge. Of the nine models whose data were reported in this study, the direct-instruction model outperformed all others in all categories (Kennedy, 1978).
Several meta-analyses have been conducted on the direct-instruction model. Adams and Engelmann (1996) conducted a meta-analysis of 34 selected studies, and found an average effect size of 0.97 per variable studied for direct-instruction. Borman, Hewes, Overman, and Brown (2003) examined studies pertaining to 29 comprehensive school reform models. Among the interventions listed as having the strongest evidence of effectiveness, direct-instruction was found to have the largest average effect size (0.21). An overview and research summary by Przychodzin, Marchand-Martella, Martella, and Azim (2004), examined 12 studies, and found significant results for direct-instruction programs in 11 of the 12 studies. More recently a synthesis by John Hattie (2009) of over 800 meta-analyses relating to achievement found direct-instruction to be one of the most effective teaching strategies, with an effect size of 0.59. Most of these studies consisted of students in the elementary grades. A study by Flores and Kaylor (2007) found positive results while examining the effects of a direct-instruction math program on student achievement at the primary grades level. In a study conducted by Ketterlin-Galler, Chard, and Fien (2008), two direct-instruction math interventions, Knowing Math and Extended Core, were evaluated using students in four elementary
38
schools and two K-8 schools Title I schools. The participants scored in the bottom 40th percentile on state standardized tests, and were randomly assigned to groups. Students in both direct-instruction interventions outperformed students in the control group.
According to Magliaro, Lockee, and Burton (2005), direct-instruction is rooted in Skinner’s selectionist behaviorism. As a selectionist model, direct-instruction is based on the belief that behavior “evolves, or is selected by the environment” (p. 42). According to Rosenshine and Stevens (1984), direct-instruction, with lower case di, involves explicit explanations and examples, repetition, frequent review, and choral response. Direct-Instruction, with upper case DI, is generally recognized in education as referring to material and programs authored by Siegfried Engelmann and his colleagues. The instructional material is designed according to the principles presented in Engelmann and Carnine’s Theory of Instruction: Principles and Applications (1982). The direct-instruction model is guided by the basic principle that if children are not learning, the fault lays with the instruction, not the children.
“The DI model was created by Engelmann and his colleagues in the 1960’s at the University of Illinois at Champagne-Urbana under a Project Follow Through Grant. Science research published the first implementation of the model known as Direct-Instruction System for Teaching And Remediation (DISTAR) programs that
addressed beginning reading, language, and math” (Magliaro et al., 2005, p. 4). At the center of DI is curriculum. One of Engelmann’s most important strategies
is to find a rule or idea that can be used to explain the largest component of content possible. According to Barbash (2012), there are five rules to direct-instruction: a) be clear, b) be efficient, c) teach to mastery, d) celebrate success, and e) beware intuition.
39
The rule should be clear and concise about the concept being taught. Equal emphasis is placed on not learning the wrong rule as is placed on learning the correct rule. The rule for whatever concept is being taught should present both positive and negative examples. The examples should lead to generalization of the concept (Barbash, 2012).
Instruction must be efficient. One way DI increases efficiency is by properly placing students in homogeneous groups based on identified instructional needs. Students are placed in groups where they perform correctly 70% of the time when introduced to new material. Another way is through using algorithms. “DI programs take advantage of the mind’s instinct to generalize by teaching it algorithms (series of steps) that enable it to solve many problems, and conceptualize frameworks that enable it to learn, organize, and remember many facts” (Barbash, 2012, p. 22).
DI programs are designed to teach to mastery. This is accomplished in two steps. First, identify all the skills that go into performing a task, and arrange them into a logical sequence for teaching them; then provide enough repetition to enable mastery of the skills. DI curriculum is designed like a staircase, with each step a lesson. Each step comprises at most 15% new material and 85% reinforcement of material already taught. Everything learned is applied repeatedly in a different context (Barbash, 2012).
According to Barbash (2012), much of what Engelmann has learned from years of observations may not be obvious:
1. Children with low IQs learn at rates comparable to children with higher IQs when both groups are taught things that are equally unfamiliar to them. 2. Children differ in what they know and like to do, but they do not learn in
40
different ways: the same scientific techniques of instruction induce learning in everyone.
3. Learning rates change quickly and spectacularly, particularly on tasks that require analogous reasoning.
4. Children from middle-class and affluent homes perform no better at many logic and reasoning tasks than do children from poor homes.
5. Low performers have more trouble learning patterns of numbers than random sequences. Anything that is patterned will interfere with their learning (p. 33). A more specific understanding of designing direct-instruction for mathematics is articulated by Stein, Kinder, Silbert, and Carnine in Designing Effective Math
Instruction: A Direct Instruction Approach (2006). “While many variables influence
students’ acquisition of mathematics, these variables are certainly central: a) instructional design, b) instructional delivery, and c) classroom organization and management” (Stein et al., 2006, p. 3). Five basic instructional design components are emphasized to assist teachers in designing direct-instruction. These five basic design components are: “a) sequence of skills and concepts, b) explicit instructional strategies, c) pre-skills, d) example selection, and e) practice and review” (Stein et al., 2006, p. 3).
The sequence of skills and concepts involves determining the most effective and efficient order for introducing new information and strategies. Stein et al. (2006) state there are three general guidelines for sequencing the introduction of new skills: “a) pre-skills of a strategy are taught before the strategy, b) easy skills are taught before more difficult skills, and c) strategies and information that are likely to be confused are not introduced consecutively” (p. 4).
41
Direct-instructional strategies are described as “clear, accurate, and unambiguous instruction” (Stein et al., 2006, p. 4). Instructional strategies must be explicit and must be able to be applied to a range of different problems. Instruction should be sequenced so that pre-skills are taught before the strategy itself is introduced. To ensure that the students have mastered the pre-skills, teachers should test students on those pre-skills (Stein et al., 2006).
Several guidelines assist teachers in selecting examples so that students
experience success. First, select only examples that require students to use strategies that have been explicitly taught. Second, examples should not only require currently
introduced strategies but should also require previously taught strategies to reinforce retention of strategies previously taught (Stein et al., 2006).
Providing sufficient practice for initial mastery and adequate review for retention is an essential part of instructional design. First, repetition must provide massed practice on an individual skill until mastery is reached. Second, previously taught skills must be continuously reviewed over time to ensure retention of the previously taught skills (Stein et al., 2006).
A major aspect of direct-instruction involves attention to how instruction is presented. Explanations should be clear and concise. Since teachers cannot call on every individual student, choral response should be incorporated into the teacher-directed lessons. Giving individual turns is also an essential part of any instructional activity in which students are asked to respond in unison, and helps teachers verify that all students are participating in the activity (Stein et al., 2006, p. 7).
42 At-risk Students
This study examines the relationship between a math intervention for at-risk students and their standardized test scores. The generally accepted definition for at-risk students is students who are in danger of failing and dropping out of school before graduation. Georgia’s Department of Education defines an at-risk student as “a student with specific needs that may hinder academic achievement, graduation, or ability to successfully transition to college or career opportunities” (Georgia Department of
Education, 2011, Glossary, para. 7). Higher standards in the public schools have affected millions of minority and disadvantaged students who are at risk of failure.
Research on low-achieving students provides an understanding of students likely to fail in elementary or secondary schools. The National Education Longitudinal Study of 1988 (NELS:88) (National Center for Educational Statistics, 1992), is a large-scale national longitudinal study designed and sponsored by the National Center for Education Statistics (NCES), with support from government agencies. The study examined 25,000 eighth-grade students attending public and private schools during the 1988 school year. These students were re-surveyed in 1990. This study examined the characteristics of eighth-grade students who were at risk of school failure (i.e., low achievement test scores and dropping out of school).
Three measures of school failure were used: 1) scores on achievement tests in mathematics, 2) scores on achievement tests in reading, and 3) dropout status as of spring 1990. Three basic demographic variables were examined: the student’s sex, race/ethnicity, and socioeconomic status.
43
Based on demographic variables, the study (National Center for Educational Statistics, 1992) found that African American, Hispanic, and Native American students and students from low socioeconomic backgrounds were more likely than other students to be deficient in basic math and reading skills and were more likely to drop out between the 8th and 10th grades. Male eighth-graders were more likely than their female peers to have low basic skills, but were no more likely to drop out. After controlling for the student’s sex and socioeconomic status, black and Hispanic dropout rates were no longer statistically different from white dropout rates. Even after controlling for the students’ sex and socioeconomic status, African American and Hispanic students were more likely than white students to perform below basic proficiency levels in mathematics and reading (para. 3).
After controlling for basic demographic information, researchers (National Center for Educational Statistics, 1992) found many other factors to predict at-risk status that were independent of the students’ sex, race/ethnicity, and socioeconomic background. Students from single-parent families, students who were overage for their peer groups, or students who had frequently changed schools were at increased risk of failure and
dropout. Eighth-grade students whose parents were not actively involved in the students’ education were at increased risk. Students who repeated an earlier grade, students who had histories of low grades in mathematics and English, or students who did little homework were at increased risk (para. 3).
Not only do educators have a legislative responsibility to improve test scores for at-risk students, they also have a moral responsibility. In today’s workforce, dropouts are less likely to obtain stable jobs than in past generations (Monrad, 2007). According to
44
Dynarski et al. (2008), “each year more than half a million young people drop out of high school. Dropouts typically earn less than graduates do--an average of $9,000 less a year, and $260,000 over the course of a lifetime. Dropouts contribute only half as much in taxes as do graduates, and draw larger government subsidies in the form of food stamps, housing assistance, and welfare payments”(p. 4). In a study on education levels and incarceration, Harlow (2003) found “41% of inmates in the Nation’s State and Federal prisons and local jails in 1997 had not completed high school” (para. 1).
Extended Learning Time
Due to the differentiation of instruction and use of homogeneous ability grouping, many mathematic interventions are taught during extended learning time. In Georgia a math intervention is required to supplement the regular education class (Georgia
Department of Education, 2012). Extended learning time may be additional learning time at the end of a regular class, additional learning time during an additional class, or
additional learning time after the regular school hours, such as after-school programs or Saturday school.
Model of School Learning
In 1963 John Carroll developed his model of school learning. Carroll’s model of school learning states, “The learner will succeed in learning a given task to the extent that he spends the amount of time that he needs to learn the task” (Carroll, 1963, Overview of the Model, para. 1). The model is not about the theory of the learning process, but, rather, a theory of the economics of the learning process. The model expresses the learning process with a mathematical formula: Learning is a function of time engaged relative to time needed for learning (Degree of learning = Time spent learning/Time
45
needed to learn). However, it is not only the amount of time spent that determines students’ degree of learning but also how engaged they are during that time and the extent to which they are engaged on task relevant to the curriculum. Time is not merely elapsed time but the time during which the student is actively engaged in learning (Carrol, 1963).
Benjamin Bloom extended Carroll’s model by making a distinction between allocated time and utilized time. Bloom explained that if aptitude was an indicator of the time a student would require to learn, but not necessarily the capacity to learn, it should be possible to set the degree of learning expected of each child at some mastery level. If the instruction could be structured to provide more opportunities to learn and a more appropriate quality of instruction for each student, then a majority of students could be expected to learn (Bloom, 1974).
The earliest and most extensive research program to examine the relationship between learning time and achievement was the Beginning Teacher Evaluation Study (BETS). The purpose of the BTES was to identify teaching activities and classroom conditions that promote increased student learning. Based on observations in classrooms over a six-year period, BTES researchers arrived at the concept of academic learning time (ALT) (Denham & Lieberman, 1980).
Academic Learning Time
David Berliner expanded upon David Carroll’s model of school learning to
develop the academic learning time (ALT) model. David Berliner (1990) determined that four variables make up ALT-- “allocated time, engaged time, success rate, and the degree of alignment of the curriculum with the outcome measures” (para. 23). Therefore, time
46
must be spent on the right task. The ALT model of learning is distinguished from Carroll’s model in two ways: First, the ALT model is more explicit about content. Students must be engaged in the correct task, which should align with the curriculum. Second is the inclusion of success rate in the ALT model. High success rates appear to predict high levels on outcome measures. Berliner (1990) states, “These special features of ALT, explicit concerns with the curriculum and the use of success rate as an indicator of a teacher’s skill in matching curriculum to a student’s ability, as well as having the success rate provide a measure of the quality of instruction being offered, give ALT capabilities for understanding instruction” (para. 27).
According to Berliner (1990), “any proposal to change instructional materials or teaching practices in the classroom that does not affect allocated time, engaged time, the rate of success, or the alignment of curriculum with the outcome measure that is used to assess learning is not likely to affect student achievement” (para. 31). In other words, unless you affect ALT in some way, there will be no change in student achievement. A review of the literature by The Core Academic Learning Time Group (2002) found a positive relationship between time on task and student achievement and a strong positive relationship between ALT and student achievement. The more positive results from ALT may be a result of the difference between time on task and ALT. Berliner (1990) defines time on task as “engaged time on a particular learning task” and ALT as “successful engagement in tasks that are relevant to outcomes or measures” (Concepts of Instructional Time, para. 5).