MINERVINI, GIUFFRIDA, TSAFTARIS: SEMI-AUTOMATED LEAF ANNOTATION
An interactive tool for semi-automated leaf
annotation
Massimo Minervini1
[email protected] Mario Valerio Giuffrida1 [email protected] Sotirios A. Tsaftaris1,2 [email protected]
1Pattern Recognition and Image Analysis (PRIAn)
IMT Institute for Advanced Studies Lucca, Italy
http://prian.imtlucca.it/
2Institute for Digital Communications School of Engineering
University of Edinburgh Edinburgh, UK
Abstract
High throughput plant phenotyping is emerging as a necessary step towards meet-ing agricultural demands of the future. Central to its success is the development of robust computer vision algorithms that analyze images and extract phenotyping infor-mation to be associated with genotypes and environmental conditions for identifying traits suitable for further development. Obtaining leaf level quantitative data is im-portant towards understanding better this interaction. While certain efforts have been made to obtain such information in an automated fashion, further innovations are neces-sary. In this paper we present an annotation tool that can be used to semi-automatically segment leaves in images of rosette plants. This tool, which is designed to exist in a stand-alone fashion but also in cloud based environments, can be used to annotate data directly for the study of plant and leaf growth or to provide annotated datasets for learning-based approaches to extracting phenotypes from images. It relies on an inter-active graph-based segmentation algorithm to propagate expert provided priors (in the form of pixels) to the rest of the image, using the random walk formulation to find a good per-leaf segmentation. To evaluate the tool we use standardized datasets avail-able from the LSC and LCC 2015 challenges, achieving an average leaf segmentation accuracy of almost 97% using scribbles as annotations. The tool and source code are publicly available athttp://www.phenotiki.comand as a GitHub repository at
https://github.com/phenotiki/LeafAnnotationTool.
1
Introduction
Morphological plant traits (e.g., plant size, number of leaves, biomass, and shape) are af-fected by genetic factors and external environmental conditions. This interaction leads to a combinatorial explosion of possible phenotypes, and enumerating and quantifying such vi-sual phenotypes manually is costly and labor intensive. High throughput plant phenotyping allows for large-scale investigations [16], in the hope of reducing the bottleneck in matching phenotype (e.g., plant growth) to genotype [11].
c
2015. The copyright of this document resides with its authors.
It may be distributed unchanged freely in print or electronic forms. Pages 6.1-6.13
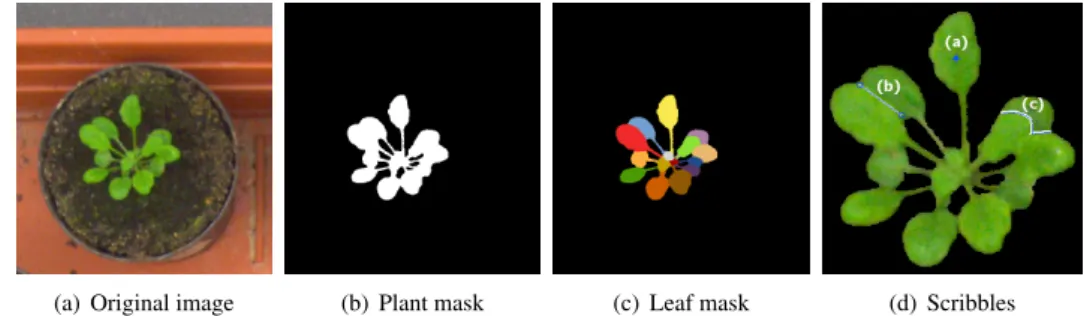
(a) Original image (b) Plant mask (c) Leaf mask (d) Scribbles
Figure 1: Example of a rosette plant (A. thaliana) and annotations. (a) Original image,
(b)plant segmentation mask, and(c)leaf segmentation ground truth. (d)Zoom-in of(a), showing examples of different types of scribbles that can be used as input to our tool. (This example is drawn from the LSC dataset, which we use here to evaluate our annotation tool.)
Taking as an example nondestructive measurement of rosette plants via images, the pro-jected leaf area (PLA), i.e., the counting of plant pixels from top-view images, is considered a good approximation of plant size and is currently used to estimate growth [19]. However, when considering growth, PLA reacts poorly, as it includes both growing and mature leaves; but the per leaf derived growth (implying a per leaf segmentation), has a faster and clearer response –a necessity for studying growth regulation [1] and stress situations [17].
Nevertheless, obtaining such information at the individual leaf level (as for example in [31]), which could help us to identify even more important plant traits, from a computer vision perspective is particularly challenging. In fact, most experts now agree that lack of reliable and automated algorithms to extract information from these vast datasets forms a new bottleneck in our understanding of plant biology and function [25]. Plants are not static, but self-changing organisms with complexity in shape and appearance increasing over time. In the range of hours leaves move and grow, with the whole plant changing over days or even months, in which the surrounding environmental (as well as measurement) conditions may also vary. To this day, with some exceptions [27,33], most leaf level analysis is performed manually. While annotating leaf counts is less complex for an expert, the precise segmentation of leaves is rather challenging. Unfortunately, no tools exist to aid even in a semi-automated fashion, the delineation of multiple leaves in such imaging data.
In this paper, we present a semi-automatic leaf segmentation tool, that aims to provide precise per-pixel annotations for leaves in images of rosette plants, an example of which is reported in Figure1. A scribble (or even just a dot) per each leaf and a scribble for the back-ground are necessary (although the tool also allows users to include plant masks and exclude background). A graph based interactive segmentation algorithm is employed to spread those seeds across the image, converging towards accurate leaf boundaries [15]. Our implementa-tion permits the user to revisit the segmentaimplementa-tion and redraw scribbles until satisfactory results are obtained. Overall, segmentation is obtained in a matter of few seconds. Our tool can ex-ist as a stand-alone application and user interface (developed in Matlab), and also can be integrated in the Bisque platform of the iPlant Collaborative project [14], a consortium pro-viding high performance computing infrastructure for plant biology. Through a web based interface images are annotated and computational resources on the iPlant cloud are used to execute the algorithm. This integration permits users to have a centralized repository for the data. The tool can be used to either create data for training larger machine-learning based
MINERVINI, GIUFFRIDA, TSAFTARIS: SEMI-AUTOMATED LEAF ANNOTATION
Figure 2: Example images (background was removed) of Arabidopsis taken from the A1 (left), and A2 (middle), datasets respectively, and tobacco taken from A3 (right). Rows show the same plant (with leaf center annotations in purple) at different stages of development.
applications or as part of a phenotyping analysis by integrating also phenotype extraction software [18,24].
The rest of the paper is organized as follows. In Section2, we first present the problem and some background, then we describe the employed algorithm, and the implementation of the tool. In Section 3, we also provide exemplary outcomes when using our tool with different configurations of scribbles as evaluated on benchmark datasets [24,30]. Section4
offers concluding remarks.
2
Proposed tool
The problem of segmenting leaves in an image is summarized in Figure1. Given an input image (Figure1(a)), and possibly a foreground mask (Figure1(b)) the goal is to obtain a segmentation as close to Figure1(c)with as little interaction as possible. Typically, in a semi-automatic segmentation context user input consists of dots, lines, or scribbles, examples of which are shown in Figure1(d).
Interactive segmentation is an active field of research, with solutions rooted in region growing methods, level set and live-wire approaches [2,8,23]. The goal is to segment ob-ject(s) of interest receiving some guidance by the user. For example, active contour models rely on an initial contour estimate drawn by the user, and the algorithm will aim to converge to an accurate delineation of the object boundaries. However, the performance of such meth-ods depends on the accuracy of the initial contour and typically several parameters need to be tuned, which may complicate user interaction.
Recently, also graph-based approaches have emerged [6,15]. They are particularly use-ful since they permit the simultaneous segmentation of multiple overlapping objects in a natural fashion –instead, other approaches usually solve each segmentation individually. In this formulation, users can place annotations (e.g., a few pixels known as scribbles, hints, or seeds) and the algorithm jointly finds a multi-label segmentation. According to choices of energy functionals for constructing the graph and choices of parameters, trade-offs to accuracy, speed, and less user iterations (to correct the annotations and outcome) can be ob-tained. Interactive segmentation has been used in several contexts of biology and medicine, particularly in the latter for aiding diagnosis [6,15].
In plant applications most annotation tools are limited towards annotating whole plants (hence, not individual leaves) [9,16,24], leaves in isolation (e.g., excised from the actual
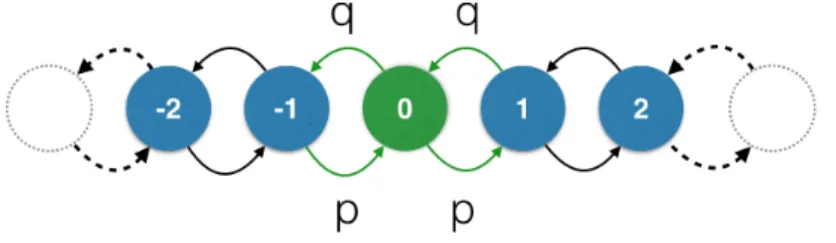
Figure 3: Example of 1-dimensional discrete random walk.
plant) [10,32], or under predefined experimental conditions (e.g., using depth or flow infor-mation) [29].
Our goal instead is to develop a tool that permits users to delineate multiple leaves with as little interaction as possible. Hence, our tool allows the user to add scribbles inside a plant image, which are then provided to the segmentation algorithm [15] as seeds, i.e., manually labeled pixels. We require to add at least a seed pixel (i.e., a dot) per leaf, to ensure that the algorithm is aware of the exact number of objects present in an image. In addition, our tool also permits the user to input a plant mask, which delineates plant from background given recent progress in plant segmentation [9,16,24]. Giving such mask as input, background pixels are used as an additional annotation and facilitate the algorithm to not over-segment towards non plant material (such as the soil, the pot, or other external objects).
In the next two sections we first review the graph-based algorithm we use in our imple-mentation, and then we present the workflow and user interface of the proposed tool. We test its performance using the datasets provided for theLeaf Segmentation Challenge(LSC) andLeaf Counting Challenge (LCC). In the first row in Figure2 we present three speci-mens drawn from A1, A2, and A3 dataset respectively. In the second row we report the same subjects after a few days of growth, showing the variability in terms of leaf shape and arrangement.
2.1
Interactive segmentation with random walks on graphs
The segmentation algorithm adopted here relies on a graph-based representation of the im-age, where each pixel is a node and neighboring pixels are connected by weighted edges. Additionally, nodes may be marked asseeds and are associated with pixel labels, repre-senting user-provided prior knowledge (i.e., the scribbles). To propagate object labels to unseeded pixels we use the random walks algorithm by Grady [15].
The concept of random walks on graphs has been developed in probability theory [28], and applied to several scientific fields, such as biology, physics, chemistry, or the social sci-ences [12]. In its basic formulation, a so-calledrandom walkercan move in a 1-D discrete space one step either to the right of its current position with probabilitypor to the left with probabilityq=1−p(Figure3). One-dimensional random walks have been studied exten-sively, also due to their interpretation in terms of discrete-space and discrete-time Markov chains [3]. Extensions to higher dimensions are based on graph representations [21].
The segmentation algorithm proposed by Grady [15] aims at partitioning a given image into a set ofK labels. It relies on labeled pixels (seeds) for each of theK partitions of the image. The input imageI is represented as a graph G= (V,E), where a nodev∈V corresponds to a pixel inI, andei j∈E⊆V×V denotes an edge in the graph connecting two nodes. The goal is to compute the probabilityxsi that a random walker starting fromvi∈V
MINERVINI, GIUFFRIDA, TSAFTARIS: SEMI-AUTOMATED LEAF ANNOTATION
reaches the seeds, wheres=1, . . . ,K. A segmentation is obtained by assigning to the node (pixel)vithe labels∗=argmaxs(xsj)associated with the highest probability.
In this context,Gis an undirected weighted graph, and a weightwi j>0 corresponds to the likelihood that a random walker will move fromvitovj. Following the original formu-lation of Grady, we set the weights using a function that evaluates difference of intensities among pixels in the image:
wi j=exp −βkgi−gjk22
, (1)
wheregidefines the (possibly vector-valued) pixel intensity ofvi. Parameterβ controls the sensitivity to small differences in intensity. Note that other functions are possible, which not need to rely solely on gradients of local intensity. Additionally, spatial coherence can also be enforced by including in Equation (1) a term accounting for distance among pixel locations. Simulating the random walker to compute the probabilitiesxsiwould be computationally inefficient. Thanks to known connections between random walks and circuit theory, proba-bilities are instead obtained by solving acombinatorial Dirichlet problem[7]. LetLbe the combinatorial Laplacian matrix [26],
Li j= di ifi=j, −wi j ifei j∈E, 0 otherwise, (2)
wheredi=∑k∈Vwikis the degree ofvi. Also, letAbe the incidence matrix, defined as:
Aei jvk= 1 ifi=k, −1 if j=k, 0 otherwise, (3)
whereA has size |E| × |V|and is indexed for each edge in E and each node inV. The constitutive matrixCis an |E| × |E|diagonal matrix with the weights wi j along the main diagonal. The combinatorial formulation of the corresponding Dirichlet problem is:
D[x] =1 2(Ax)
TC(Ax) =1
2x
TLx. (4)
The set of verticesV can be partitioned asV=VM∪VU, withVMcontaining seed nodes, and VU containing the remaining unmarked nodes. Assuming that nodes inLare sorted such that seed vertices are before unmarked vertices, Equation (4) can be rewritten as follows:
D[xU] = 1 2 xMTxUT LM B BT LU xM xU =1 2 x T MLMxM+2xTUB Tx M+xUTLUxU. (5)
Because of its construction (cf. Equation (2)), the combinatorial Laplacian matrixLis posi-tive semidefinite and the critical points in Equation (5) are local minima. Differentiating (5) byxU, the solution that minimizes the Dirichlet problem has to be sought in the following system of linear equations with|VU|unknowns:
LUxU=−BTxM, (6)
which is guaranteed to have a solution if every connected component contains a node inVM, namely a seed vertex.
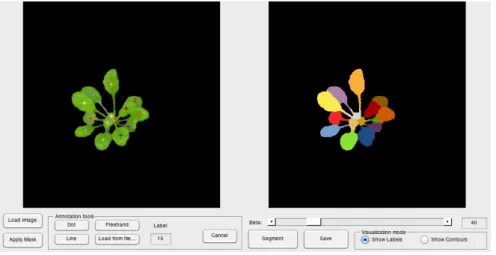
Figure 4: Graphical user interface of our annotation tool. In this example, we add as many seeds as the number of leaves and the underlying random walks segmentation algorithm is able to propagate those seeds and provide an accurate leaf delineation.
2.2
The annotation tool
Our software tool provides a user-friendly graphical user interface (GUI) to support interac-tively experts during the leaf annotation process. Figure4shows an example of leaf segmen-tation obtained using our tool.
The typical workflow of the annotation process is described in the following paragraphs. First, we load an RGB image of a plant, which is internally converted to the CIEL*a*b* color space. The software offers the possibility to eliminate background by applying a plant segmentation mask loaded from file (e.g., obtained by manual delineation or via automated segmentation approaches [24]). Next, expert annotation is performed using the available Annotation tools. We permit four types of pixel annotations (examples are shown in Fig-ure1(d)): (i) dot, (ii) line, (iii) freehand, and (iv) annotations loaded from file. Thedot tool allows to mark a single pixel as seed. Theline toolallows to annotate a set of pixels laying on a line segment. Thefreehand toolallows to draw free-form curves, useful e.g. to annotate highly overlapping leaves. Our tool also allows to read annotations from file, in the form of a binary image where leaf center coordinates are denoted by ‘1’ (as available in the LCC dataset, see Section3for further details) and zero otherwise, or a binary image containing as many ‘disconnected’ scribbles as pixel drawings with value ‘1’ and zero otherwise. Zooming and panning facilitate the annotation of complicated regions. We assign to each annotation a different label from 1 toK, whereKis the total number of objects (leaves in our case plus background) to segment. When the annotations are loaded, we press on theSegmentbutton and the final result is displayed in the right-hand side of the interface (see Figure4). A slider allows to set the parameterβ (Equation (1)) to control the sensitivity of the segmentation
algorithm to variations in intensity between neighboring pixels. Notice that this represents the only free parameter tunable by the user.
The GUI offers two visualization modalities, showing either the leaf labeling (cf. Fig-ure 4) or the segmentation outline overlaid on the original RGB image (not shown for brevity). The leaf segmentation mask can be exported as an indexed PNG image file, in which index ‘0’ denotes background and all subsequent indexes denote leaf labels. A color
MINERVINI, GIUFFRIDA, TSAFTARIS: SEMI-AUTOMATED LEAF ANNOTATION Proposed approach
Ref. [27] Dot Line Skeleton
A1 (Arabidopsis) 74.2±7.7 89.9±2.8 89.7±2.6 96.8±0.9 A2 (Arabidopsis) 80.6±8.7 87.6±8.0 89.0±4.7 96.8±1.5 A3 (Tobacco) 61.8±19.1 75.9±22.4 88.7±5.9 96.4±2.0
All 73.5±11.5 84.5±11.1 89.1±4.4 96.7±1.5
Table 1: Leaf segmentation accuracy (SymmetricBestDice, expressed as %) obtained by the random walks segmentation approach [15] adopted here, using different types of leaf anno-tations. Ref. [27] is adopted as baseline. Results are shown as mean±standard deviation.
palette is embedded in the PNG file to map indexes to displayed color, maximizing contrast and improving legibility. The GUI allows also to load a sequence of images and can split the visualization screen to see results of prior labellings of the sequence. In case of not sat-isfactory results, theCancelbutton cleans the image from all the scribbles, and the user can repeat the annotation procedure. Optionally, annotations can be moved after they are placed and the last one can be deleted by pressing theCtrl+Zkey combination, to enable iterative segmentation and refinement.
3
Experimental results
In the following we show some results and evaluations using the proposed tool. We run the software on Matlab R2014b and a PC equipped with Intel Core i7-4710HQ CPU 2.50 GHz, 16 GB memory, and running 64-bit GNU/Linux. To quantitatively evaluate our tool we use training datasets from Arabidopsis (A1, A2) and tobacco (A3) [30], in the context of the Leaf Segmentation and Counting Challenges(LSC & LCC), held in conjunction with theComputer Vision Problems in Plant Phenotyping(CVPPP 2015) workshop.1 Example images and leaf center annotations are shown in Figure2.
We use datasets and available ground truth (dot annotations available in LCC and ac-tual leaf segmentations) to test the performance of our tool using a variety of automatically computed input seeds and evaluate the segmentation outcome w.r.t. ground truth manual seg-mentation available in LSC. To simulate user interaction (scribbles), we devise three types of annotations per each leaf: dot, as available in the LCC training set; line, a single line obtained by finding the principal direction of each leaf mask; and skeleton, obtained by skeletonizing each leaf mask. It is obvious that they simulate scenarios of less to more com-plex (and laborious) scribble annotations. Examples of automatically obtained annotations and segmentations are shown in Figure5.
As an evaluation criterion we adopt the SymmetricBestDice (%), as defined and available together with the training data, which measures average Dice overlap between leaf objects in ground truth and algorithmic result. We use 128, 31, and 27 images from datasets A1, A2, and A3, respectively. In the random walks segmentation algorithm, we useβ =35 for A1, β =10 for A2, andβ =70 for A3.
Table1shows quantitative findings obtained by evaluating the random walks segmenta-1http://www.plant-phenotyping.org/CVPPP2015
(a) (b) (c) (d) (e)
Figure 5: (a)-(c) Example annotations used to evaluate the random walks segmentation al-gorithm. (d) Leaf segmentation obtained using the annotations in (c), which matches almost perfectly the (e) ground truth leaf mask (obtained by manually labeling each pixel [30]).
tion algorithm on Arabidopsis and tobacco image data. Overall, we observe that by increas-ing the level of detail in the annotations, leaf segmentation accuracy increases accordincreas-ingly. Even when relying only on the simplest form of leaf annotation (dots), our approach outper-forms the state-of-the-art automated leaf segmentation obtained by Pape and Klukas [27]. When using a straight line as an annotation, performance increases slightly on overage but consistency improves significantly (lower standard deviation w.r.t. to using the dot anno-tation). Using skeleton-like scribbles, our tool obtains almost perfect and consistent leaf segmentation (SymmetricBestDice≈97%). Our tool can be used to annotate leaves for ex-tracting phenotyping information, since currently state-of-the-art performance in automated leaf segmentation is rather limited, but also to create annotations for obtaining ground truth segmentations.
Annotating a plant image by simply clicking on leaves (i.e., using dot annotations) is a simple task that typically requires less than a minute (based on our own albeit biased expe-rience). Once the seeds are placed, the leaf segmentation is calculated and displayed within few seconds. On average it takes 0.3 seconds to process an image from A1 or A2 (0.25 megapixels) and 6.2 seconds for the higher-resolution images in A3 (5 megapixels). On the other hand, annotating leaves on the same plant images adopting a completely manual ap-proach is considerably more time consuming. We measure the performance of three different experts (i.e., already familiar with the task and the image data), observing that it requires 20 minutes or more, depending on plant complexity, to complete the leaf annotation of a single plant image, even assuming a plant mask.
One of the key motivators for enabling the easy and rapid annotation of such images is to provide training data to algorithms. Learning based algorithms are known to generalize
MINERVINI, GIUFFRIDA, TSAFTARIS: SEMI-AUTOMATED LEAF ANNOTATION
Figure 6: Effects of training data size on a learning algorithm for leaf counting [13].
better to unseen data, when more training data are available. As an example to demonstrate this fact, we use a learning to count leaves application with regression [13]. Image patches are extracted in the log-polar domain and are provided toK-means to build a codebook. Feature codes are obtained by projecting patches on the codebook using the triangle encoding [4]. A global, per-plant image descriptor is obtained by pooling local features in specific regions of the image. Using support vector regression [5], we learn a map from image features to number of leaves in a plant. We adopt Arabidopsis image data from the ‘A1’ training set [30] and vary the number of available training data and keep the remainder of the training data as a validation test. We use as performance metric the mean squared error between actual number of leaves and predicted. Figure6shows that both training and testing error reduce with the size of the dataset. In particular, we observe that with few training images, the error is significant. However, after a certain value (32) the performance plateaus.
4
Conclusions
In this paper we present a tool to enable the easy and rapid annotation of leaves in images originating from plant phenotyping experiments. The goal of our tool is to permit users to label all pixels within an input image, providing for each pixel an integer label according to which leaf it belongs. Our tool relies on graph-based interactive segmentation to reduce the amount of input necessary from the user. The random walks algorithm by Grady [15] is used to spread user provided scribbles and obtain a segmentation. The user can iteratively refine the results till the desired outcome is obtained. Our software tool and its source code are publicly available online2,3(as a Matlab application, listed also in the Plant Image Analysis database [20]) and will be integrated with iPlant, a web and cloud based infrastructure for plant biology.
2Web page:http://www.phenotiki.com
although we believe that our tool can be useful in annotating other (model) plants as well, and we are looking forward to obtaining feedback from the community.
Our tool can be improved in several ways. For example when boundaries between leaves are subtle (lack of discernible contrast) over-segmentation is possible and the boundary is not well recovered. This is attributed to the fact that the current implementation of the seg-mentation algorithm relies on setting the graph with weights based on intensity differences. Intensity differences work well when boundaries are clear and resolution is high (e.g., on the tobacco dataset). However, in the Arabidopsis data, the large field of view leads to images of poorer resolution and out-of-focus blur. Thus, better mechanisms to set graph weights are necessary to obtain superior performance in such cases. Towards this direction several approaches have been proposed in the literature (see for example [6]). We believe that cal-culating specific features (and corresponding feature space) to project a plant pixel on and derive distances and similarities in this space could yield better results. Another possibil-ity is to pre-process the graph by eliminating pixel connections that lie on leaf boundaries. Based on prior training data (e.g., based on the LSC) we could learn boundary detectors to find between leaf boundaries [22], and use the posterior probability to attenuate graph edge strength for pixels lying on the boundaries.
In summary, we presented a tool for the interactive segmentation of multiple leaves in a plant phenotyping context. Our tool can be used to create annotations (ground truth) for learning-based approaches to segmentation, and to evaluate such algorithms. Until fully au-tomated and reliable segmentation is possible, our tool can also be used by scientists wishing to obtain per leaf growth level measurements in a supervised semi-automated fashion.
Acknowledgements
This work is partially supported by a Marie Curie Action: “Reintegration Grant” (grant number 256534) of the EU’s Seventh Framework Programme (FP7).
References
[1] S. Arvidsson, P. Pérez-Rodríguez, and B. Mueller-Roeber. A growth phenotyping pipeline for Arabidopsis thaliana integrating image analysis and rosette area modeling for robust quantification of genotype effects. The New Phytologist, 191(3):895–907, 2011.
[2] W. A. Barrett and E. N. Mortensen. Interactive live-wire boundary extraction.Medical Image Analysis, 1(4):331–341, 1997.
[3] R. N. Bhattacharya and E. C. Waymire. Stochastic Processes with Applications. Clas-sics in Applied Mathematics. Society for Industrial and Applied Mathematics, 2009.
MINERVINI, GIUFFRIDA, TSAFTARIS: SEMI-AUTOMATED LEAF ANNOTATION
[4] A. Coates, A. Arbor, and A. Y. Ng. An analysis of single-layer networks in unsuper-vised feature learning. International Conference on Artificial Intelligence and Statis-tics, pages 215–223, 2011.
[5] C. Cortes and V. Vapnik. Support-vector networks.Machine Learning, 20(3):273–297, 1995.
[6] C. Couprie, L. Grady, L. Najman, and H. Talbot. Power watershed: A unifying graph-based optimization framework. IEEE Transactions on Pattern Analysis and Machine Intelligence, 33(7):1384–1399, 2011.
[7] R. Courant and D. Hilbert.Methods of Mathematical Physics, volume 1 ofMethods of Mathematical Physics. Wiley, 2008.
[8] D. Cremers, M. Rousson, and R. Deriche. A review of statistical approaches to level set segmentation: Integrating color, texture, motion and shape. International Journal of Computer Vision, 72(2):195–215, 2007.
[9] J. De Vylder, F. J. Vandenbussche, Y. Hu, W. Philips, and D. Van Der Straeten. Rosette Tracker: an open source image analysis tool for automatic quantification of genotype effects.Plant Physiology, 160(3):1149–1159, 2012.
[10] H. M. Easlon and A. J. Bloom. Easy leaf area: Automated digital image analysis for rapid and accurate measurement of leaf area. Applications in Plant Sciences, 2(7), 2014.
[11] F. Fiorani and U. Schurr. Future scenarios for plant phenotyping. Annual Review of Plant Biology, 64:267–291, 2013.
[12] C. Gardiner. Stochastic Methods: A Handbook for the Natural and Social Sciences. Springer Series in Synergetics. Springer, 2009.
[13] M. V. Giuffrida, M. Minervini, and S. A. Tsaftaris. Learning to count leaves in rosette plants. InBritish Machine Vision Conference (CVPPP Workshop). BMVA Press, 2015. [14] S. A. Goff, M. Vaughn, S. McKay, E. Lyons, A. E. Stapleton, D. Gessler, N. Matasci, L. Wang, M. Hanlon, A. Lenards, A. Muir, N. Merchant, S. Lowry, S. Mock, M. Helmke, A. Kubach, M. Narro, N. Hopkins, D. Micklos, U. Hilgert, M. Gonza-les, C. Jordan, E. Skidmore, R. Dooley, J. Cazes, R. McLay, Z. Lu, S. Pasternak, L. Koesterke, W. H. Piel, R. Grene, C. Noutsos, K. Gendler, X. Feng, C. Tang, M. Lent, S.-J. Kim, K. Kvilekval, B. S. Manjunath, V. Tannen, A. Stamatakis, M. Sanderson, S. M. Welch, K. A Cranston, P. Soltis, D. Soltis, B. O’Meara, C. Ane, T. Brutnell, D. J. Kleibenstein, J. W. White, J. Leebens-Mack, M. J. Donoghue, E. P. Spalding, T. J. Vision, C. R. Myers, D. Lowenthal, B. J. Enquist, B. Boyle, A. Akoglu, G. Andrews, S. Ram, D. Ware, L. Stein, and D. Stanzione. The iPlant collaborative: Cyberinfras-tructure for plant biology.Frontiers in Plant Science, 2, 2011.
[15] L. Grady. Random walks for image segmentation.IEEE Transactions on Pattern Anal-ysis and Machine Intelligence, 28(11):1768–1783, 2006.
[16] A. Hartmann, T. Czauderna, R. Hoffmann, N. Stein, and F. Schreiber. HTPheno: an image analysis pipeline for high-throughput plant phenotyping. BMC Bioinformatics, 12(1):148, 2011.
information system for high-throughput plant phenotyping. Plant Physiology, 165(2): 506–518, 2014.
[19] L. Li, Q. Zhang, and D. Huang. A review of imaging techniques for plant phenotyping. Sensors, 14(11):20078–20111, 2014.
[20] G. Lobet, X. Draye, and C. Périlleux. An online database for plant image analysis software tools.Plant Methods, 9:38–38, 2013.
[21] L. Lovász. Random walks on graphs: A survey, 1993.
[22] D. R. Martin, C. C. Fowlkes, and J. Malik. Learning to detect natural image boundaries using local brightness, color, and texture cues.IEEE Transactions on Pattern Analysis and Machine Intelligence, 26(5):530–549, 2004.
[23] K. McGuinness and N. E. O’Connor. A comparative evaluation of interactive segmen-tation algorithms. Pattern Recognition, 43(2), 2010.
[24] M. Minervini, M. M. Abdelsamea, and S. A. Tsaftaris. Image-based plant phenotyping with incremental learning and active contours.Ecological Informatics, 23:35–48, 2014. Special Issue on Multimedia in Ecology and Environment.
[25] M. Minervini, H. Scharr, and S. A. Tsaftaris. Image analysis: The new bottleneck in plant phenotyping.IEEE Signal Processing Magazine, 32(4):126–131, 2015.
[26] B. Mohar. The Laplacian spectrum of graphs. InGraph Theory, Combinatorics, and Applications, pages 871–898. Wiley, 1991.
[27] J. Pape and C. Klukas. 3-D histogram-based segmentation and leaf detection for rosette plants. InComputer Vision - ECCV 2014 Workshops, volume 8928 ofLecture Notes in Computer Science, pages 61–74. Springer, 2015.
[28] K. Pearson. The problem of the random walk.Nature, 72(1865):294, 1905.
[29] L. Remmler and A.-G. Rolland-Lagan. Computational method for quantifying growth patterns at the adaxial leaf surface in three dimensions. Plant Physiology, 159(1):27– 39, 2012.
[30] H. Scharr, M. Minervini, A. Fischbach, and S. A. Tsaftaris. Annotated image datasets of rosette plants. Technical Report FZJ-2014-03837, Forschungszentrum Jülich GmbH, July 2014. URLhttp://hdl.handle.net/2128/5848.
[31] A. Walter and U. Schurr. The modular character of growth in Nicotiana tabacum plants under steady-state nutrition. Journal of Experimental Botany, 50(336):1169–1177, 1999.
MINERVINI, GIUFFRIDA, TSAFTARIS: SEMI-AUTOMATED LEAF ANNOTATION
[32] C. Weight, D. Parnham, and R. Waites. LeafAnalyser: a computational method for rapid and large-scale analyses of leaf shape variation. The Plant Journal, 53(3):578– 586, 2008.
[33] X. Yin, X. Liu, J. Chen, and D. M. Kramer. Multi-leaf tracking from fluorescence plant videos. InInternational Conference on Image Processing, pages 408–412, 2014.

![Table 1: Leaf segmentation accuracy (SymmetricBestDice, expressed as %) obtained by the random walks segmentation approach [15] adopted here, using different types of leaf anno-tations](https://thumb-us.123doks.com/thumbv2/123dok_us/10204603.2923434/7.612.79.549.60.184/segmentation-accuracy-symmetricbestdice-expressed-obtained-segmentation-approach-different.webp)
![Figure 6: Effects of training data size on a learning algorithm for leaf counting [13].](https://thumb-us.123doks.com/thumbv2/123dok_us/10204603.2923434/9.612.100.492.57.307/figure-effects-training-data-size-learning-algorithm-counting.webp)
