Acciaio
Contact stress distribution and roll surface
temperatures in the roll gap analyzed
with different sensors
T. Luks, J. Horský, A. Nilsson, N-G. Jonsson, J. Lagergren
Keywords: Roll gap - Contact stresses - Friction coefficient - Hot rolling - Cold rolling - Heat flux
T. Luks, J. Horský
Brno University of Technology, Czech Republic A. Nilsson
Swerea MEFOS, Sweden N-G. Jonsson Jernkontoret, Sweden
J. Lagergren Åkers AB, Sweden
Paper presented at the Int. Conf. ROLLING 2013, Venice 10-12 June 2013, organized by AIM
Memorie
In this work, the contact stresses and temperatures during hot and cold rolling have been measured. A work roll containing three different sensors was used for the measurements. There were two contact devices for directly measuring forces and one temperature sensor. One sensor was the “ROLLSURF” sensor. Results obtained with this sensor have been presented earlier [1-3]. The measurement principle is based on deformation measurements
with strain gauges which were placed on an internal cradle-type roll insert. The second sensor was a friction pin sensor. The forces on the top of the pin were measured by three axis piezoelectric-transducers. The pin sensor was mounted inside the work roll opposite to the ROLLSURF sensor. The third sensor was a thermocouple placed
next to the pin sensor. The temperatures were measured very close to the roll surface. The surface boundary conditions including the heat flux and surface temperatures were computed using inverse modelling calculations
developed at Brno University of Technology.
The main task of this paper is to show a comparison of the contact forces and contact length measured with the strain-gauge sensor and the pin-sensor.
INTRODUCTION
A better knowledge of the behaviour and phenomena in the roll gap gives important information for improving basic rolling models and a better understanding of the complex relationships in this small but interesting area. The work in this project can be used for improving basic rolling models for friction and wear as well as models for heat transfer in the roll gap. Increasing the durability of the rolls, toge-ther with a constant or better quality of the final products, is one of the main goals. The work rolls are exposed to thermal and mechanical loads that lead to thermal fatigue
in the roll surface. The roll surface is in contact with the hot strip and on the exit side it is cooled by water nozzles which give an intermittent thermal load cycle. Cold rolling on the other hand has high pressure cyclic loads in the roll bite and not a significant temperature loading. Accurate boundary conditions are needed to make a good model of the process.
Two major unknown parameters when modelling the pro-cess are the thermal and frictional boundary conditions. The thermal boundary conditions can be described as the heat flux between the roll and the strip or the surface tem-perature of the roll along the roll gap. A model for friction between the roll and strip along the roll gap are also re-quired for modelling. Experimental work is necessary, be-cause the parameters to determine these values are too complex to obtain analytically, or the physical phenomena are not known in detail.
One method to determine the thermal boundary condi-tions is to make direct measurements of the surface tem-peratures [4]. Unfortunately, the durability of the thermal sensors typically used is short due to a highly abrasive environment, and the temperature field is influenced. The durability of the thermal sensor increases by making mea-surements below the surface. The temperatures measured below the surface were extrapolated using an inverse
mo-Memorie
delling method to find the surface temperatures.
To measure the surface friction between the roll and strip we measured the real normal stress p(x) distribution and the true shear stress τ(x) distribution along rolling direction x. The true length of contact L was measured at the same time. The measured values were used for the evaluation of the surface friction in terms of the ratio μ(x) between τ(x) and p(x) in each zones in the rolling gap (1a-c)
(1a) (1b) (1c) The result is a “V” shaped graph, in absolute values, first declining representing a shear stress ratio from first point of contact between the strip and roll, this at entry of rolling until a zero at the neutral zone (NZ), then increasing from the neutral zone to the last point of contact at exit of the rolling process.
TEMPERATURE SENSOR
The temperature sensor (Fig. 1) was designed based on an earlier installation [5, 6]. For assessment of the thermal boundary conditions, the temperature was measured 0.5 mm below the surface. The temperature sensor was made from a steel cylinder with a groove for the thermocouple. A type K thermocouple, 0.5 mm in diameter, was placed parallel to the surface and roll axis into the groove and filled with nickel solder. The temperature sensor was placed inside the hole in the roll and fixed with glue. The surface of the sensor was then ground down. The final distance between the centre of thermocouple and the roll surface was designed to be 0.5 mm. An inverse calculation of heat conduction was used to calculate the surface tempe-ratures and heat flux.
Fig. 1 - Temperature sensor
Fig. 1 – Sensore di temperatura
Beck’s one dimensional sequential approach [7] is used for the computing of the heat fluxes and the sur-face temperatures. The main feature of this method is a sequential estimation of the time varying heat fluxes and surface temperatures and to the use of
fu-ture time steps data to stabilize the ill-posed problem. The measured temperature history Ti* is used as input to mini-mize equation (2) (The SSE denotes sum of square errors.) A forward equation solver uses complex 2D axisymmetric model. The model includes the shielded thermocouple with all its parts and solder. The thermocouple must be taken into account since the homogeneity of material is disturbed by the inserted thermocouple, and thus the tem-perature profile is also disturbed.
(2) where
m is the current time;
f is the number of future time steps;
Ti are temperatures computed from the forward equation solver.
The final surface heat flux q at time m is
(3)
where
zi is a sensitivity coefficient of the temperature sensor at time index i to the heat flux pulse at time m. The tempe-ratures Ti qm=0 at the sensor location computed from the forward equation solver use all previously computed heat fluxes without the current one. When the heat flux is found for the time m, the corresponding surface tempera-ture Tmsurf is computed from the forward equation solver. Using this procedure, the whole heat flux history and sur-face temperature history are computed.
A model mesh for the forward equation solver was crea-ted using dimensions from the manufacturer’s drawings. Errors from the manufacturing of the equipment and in thermocouples are compensated by calibration (Fig. 2). During calibration the temperature sensor in the roll was
Fig.2 - Calibration devices; Temperature response from temperature sensor
Fig.2 – Dispositivi di misura; valori di temperatura dal sensore di temperatura
Acciaio
heated by hot water. A stable water beam from a solidnoz-zle impacted the centre of the sensor and the temperature response was measured. HTC (Heat Transfer Coefficient) values were computed for these calibration trials and com-pared with the known characteristic of the water beam in order to improve the model.
PIN SENSOR
A three-axis force piezoelectric transducer from Kistler was used for the pin measurement. The size and the po-sition of the pin are limited by space inside the work roll. The pin has a diameter of 1.88 mm and is 22 mm long (Fig. 3). A special device was manufactured for preloading the piezo transducer and for installation inside the work roll. The tolerances for the assembly of the pin in the roll insert were tight. The top of the pin after installation is at the same level as the surrounding roll surface.
After the pin sensor with piezoelectric transducers was properly preloaded, it was calibrated. The pin was loaded in three different directions. The applied forces were mea-sured by external force transducers. During the calibration procedure, the transfer coefficient between the applied force and the output signals , were measured. A transfer matrix K (4, 5) was formed. The inverse transfer matrix was
used to reconstruct the forces from measured signals (6).
ROLLSURF
The ROLLSURF device consists of a cradle-type (Fig. 4) roll insert equipped with strain gauges. The sensor is deformed
Fig. 3 - Pin sensor mounted on the base plate with a piezoelectric three-axis force transducer
Fig. 3 – Sensore a spillo montato sulla base con un trasduttore piezoelettrico a tre assi
during rolling and the contact normal load and tangential load can be predicted from the strain gauge signals using a neural network model based on calibration trials.
MEASURING
The three sensors were installed in the measuring roll (Fig. 5). The signals measured from the roll were transmitted wirelessly with a 12 bit data acquisition system.
After installation and calibration of all three sensors, 29 rolling tests were performed. The cold rolling tests (Tab. 1), C1-C9, were made on aluminium bars and the hot rol-ling tests (Tab. 2), H1-H20, were made on carbon steel bars. The initial thickness of the bar was from 5 to 10 mm and all bars were 30 mm wide. The length of the bar was around 2 m.
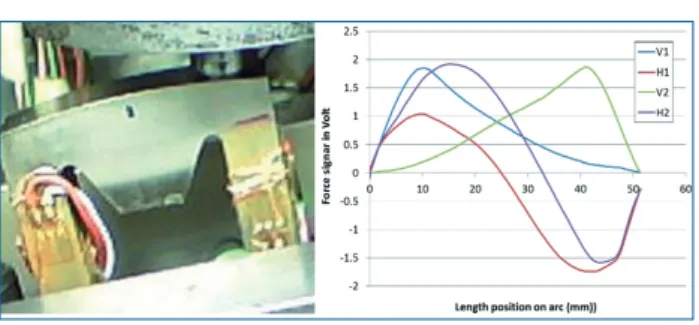
Fig. 4 - ROLLSURF insert during calibration and the voltage signals logged from the strain gauges as they
look during a contact sequence. V1 and V2 are the vertical signals, H1 and H2 are the signals from each “leg”. These signals are transferred to the normal and
tangential loads through a calibration equation.
Fig. 4 – Inserti ROLLSURF durante la misurazione e segnali del voltaggio registrati dagli estensimetri durante una sequenza di contatto. V1 e V2 sono i segnali verticali, H1 e H2 sono i segnali da ogni “gamba”. Questi segnali
sono riferiti ai carichi normali e tangenziali mediante un’equazione di taratura.
(4) (5) (6)
Fig. 5 - Measuring roll with segments; a) the “half-moon” insert with the pin sensor and the thermocouple, b) the wireless electronic system.
Fig. 5 – Cilindro di misurazione con segmenti; a) l’inserto a mezzaluna con il sensore a spillo e la termocoppia, b) il
Memorie
EVALUATION AND COMPARISON OF RESULTS
Results from ROLLSURF sensor and pin sensor were com-pared with the total rolling forces measured externally (Fig. 6). In the graph below, the ROLLSURF sensor shows a good agreement between the total rolling forces and the rolling forces calculated from the normal stress distribu-tion. The load measured with the pin sensor became hi-gher probably due to the fact that the pin is more rigid than the roll and does not deflect as much during rolling, there-fore the reduction under the pin is slightly higher than in the surrounding area. The measured contact lengths were compared to the theoretically calculated contact length (Fig. 7) using the model for Hitchcock roll flattening.
Sample Input thickness [mm] Input thickness [mm] Reduction [%] Rolling force [Kn] Contact lenght from ROLLSURF [mm] Contact lenght from pin sensor [mm] Theoretical contact lenght [mm] C1 8.3 8.02 3.4 89 11.4 10.5 6.4 C2 8.3 7.91 4.7 108 12.5 11.4 7.4 C3 8.3 7.80 6.0 127 13.8 13.1 8.3 C4 5.0 4.81 3.8 71 8.7 7.9 5.3 C5 5.0 4.73 5.4 87 9.3 8.8 5.6 C6 5.0 4.56 8.8 128 11.6 10.9 7.9 C7 5.0 4.50 10.0 137 12.3 12.0 8.4 C8 5.0 4.47 10.6 128 12.6 12.1 8.8 C9 5.0 4.48 10.4 126 12.9 10.5 8.7
Table 1 - Cold rolling experiments
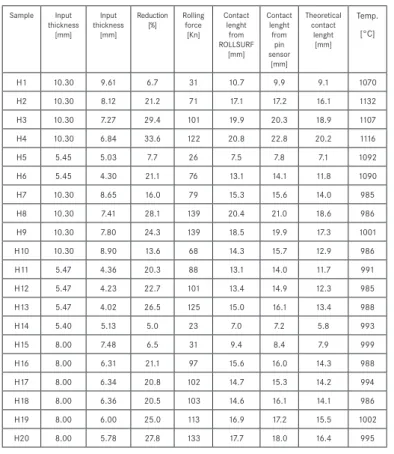
Tab. 1 – Prove di laminazione a freddo Sample Input thickness [mm] Input thickness [mm] Reduction [%] Rolling force [Kn] Contact lenght from ROLLSURF [mm] Contact lenght from pin sensor [mm] Theoretical contact lenght [mm] Temp. [°C] H1 10.30 9.61 6.7 31 10.7 9.9 9.1 1070 H2 10.30 8.12 21.2 71 17.1 17.2 16.1 1132 H3 10.30 7.27 29.4 101 19.9 20.3 18.9 1107 H4 10.30 6.84 33.6 122 20.8 22.8 20.2 1116 H5 5.45 5.03 7.7 26 7.5 7.8 7.1 1092 H6 5.45 4.30 21.1 76 13.1 14.1 11.8 1090 H7 10.30 8.65 16.0 79 15.3 15.6 14.0 985 H8 10.30 7.41 28.1 139 20.4 21.0 18.6 986 H9 10.30 7.80 24.3 139 18.5 19.9 17.3 1001 H10 10.30 8.90 13.6 68 14.3 15.7 12.9 986 H11 5.47 4.36 20.3 88 13.1 14.0 11.7 991 H12 5.47 4.23 22.7 101 13.4 14.9 12.3 985 H13 5.47 4.02 26.5 125 15.0 16.1 13.4 988 H14 5.40 5.13 5.0 23 7.0 7.2 5.8 993 H15 8.00 7.48 6.5 31 9.4 8.4 7.9 999 H16 8.00 6.31 21.1 97 15.6 16.0 14.3 988 H17 8.00 6.34 20.8 102 14.7 15.3 14.2 994 H18 8.00 6.36 20.5 103 14.6 16.1 14.1 986 H19 8.00 6.00 25.0 113 16.9 17.2 15.5 1002 H20 8.00 5.78 27.8 133 17.7 18.0 16.4 995
Table 2 - Hot rolling experiments
Tab. 2 – Prove di laminazione e caldo
Signals from the pin sensor were used to obtain typical reconstructed contact stresses (Fig 8). Forces on the top of the pin measured by three-axes piezoelectric force transducers were recalculate to contact stresses. Shear stresses (in rolling Tr and width directions Tw) have pre and post contact according to the normal stress (p). For this comparison, only the normal stress p was taken into account. The tangential stresses will also be investigated and the results will be presented in future work.
Cold rolling of aluminium
For cold rolling, one test with and without lubrication was made. Test C7 was rolled dry and test C9 was lubricated (Fig. 9). In the analysis of the strip, it was seen that the lu-bricated strip had lower contact forces as well as a lower coefficient of friction (Fig. 9b).
Hot rolling of steel
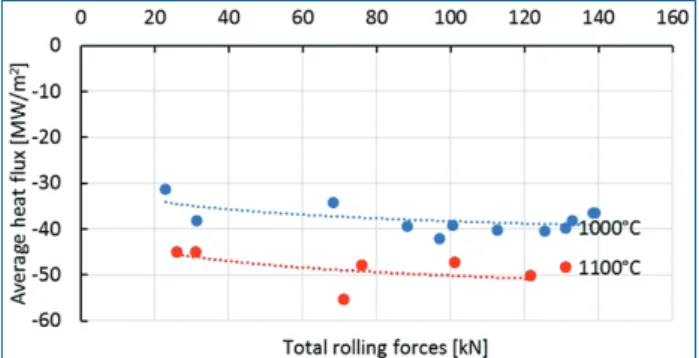
The heat fluxes from inverse calculation become wider (Fig. 12, 13) than the contact length since the heat flux is not only a local event inside the roll gap. There is heat transfer by radiation and convection from the strip into the roll be-fore there is actual contact with the strip. Fig. 14 shows the average heat flux applied in the roll gap (size measured by pin sensor) which are equivalent to the computed results.
Fig. 6 - The total rolling forces from external measurements compared with those calculated from
the sensors.
Fig. 6 – Confronto fra forze totali di laminazione ottenuta con misurazioni esterne e quella calcolata dai sensori.
Fig. 7 - The contact length measured using the sensors and calculated theoretically.
Fig. 7 - Lunghezza del contatto misurata con il sensore e calcolata teoricamente.
Acciaio
Fig. 8 - Sample C3 - Reconstructed contact stresses in roll gaps from pin sensor (a) and from ROLLSURF sensor (b).
Fig. 8 - Campione C3 – Tensioni di contatto ricostruite nella luce fra i cilindri di laminazione dal sensore a spillo (a) e dal sensore ROLLSURF (b).
Fig. 10 - Normal stress in the roll gap evaluated using the ROLLSURF sensor for different hot rolling conditions (a). Comparison of the results from the pin sensor and ROLLSURF sensor (b).
Fig. 10 - Tensione normale nella luce fra i cilindri di laminazione misurata con il sensore ROLLSURF in diverse condizioni di laminazione a caldo (a). Confronto dei risultati fra il sensore a spillo e il sensore ROLLSURF (b).
Hot Rolling of steel
Fig. 9 - a) Normal stress and shear stress in roll gap for non-lubricated C7 and lubricated C9 trials; b) coefficient of friction for non-lubricated C7 and lubricated C9 trials; c) normal stress for non-lubricated C7 and lubricated
C9 trials, with a comparison between the pin and ROLLSURF sensor.
Fig. 9 - a) Tensione normale e tensione tangenziale nella luce fra i cilindri di laminazione nella prova senza-lubrificazione C7 e in quella con lubrificazione C9; b) coefficiente di frizione nella prova senza lubrificazione C7 e in quella con lubrificazione C9; c) tensione normale nella prova senza-lubrificazione C7 e in quella con lubrificazione C9, e confronto fra
Memorie
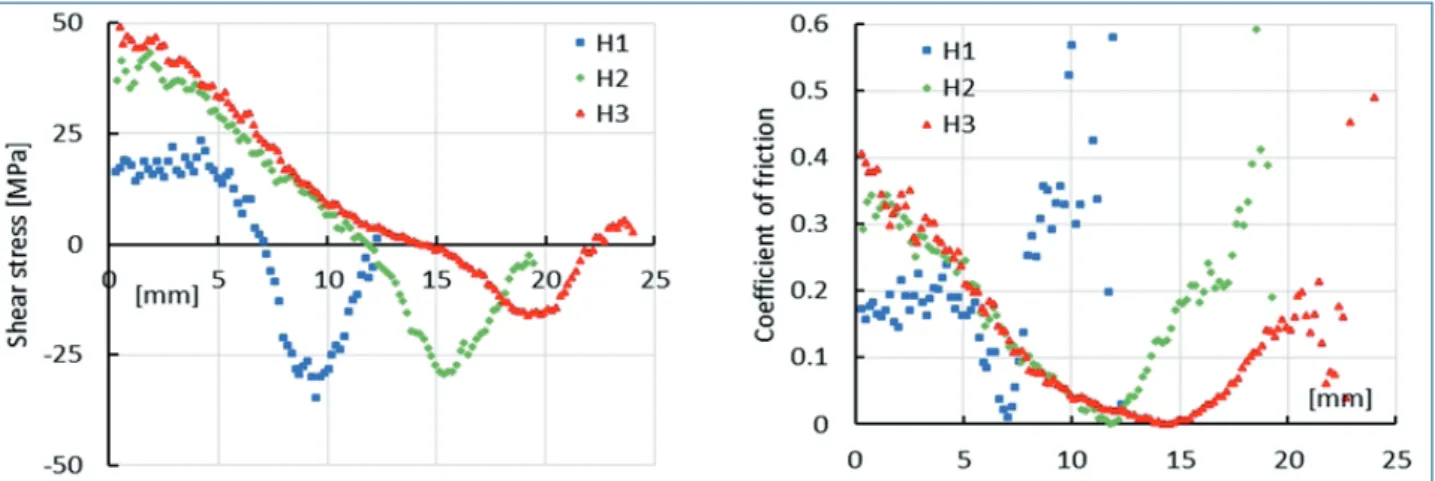
Fig. 11 - a) Shear stress in roll gap evaluate by ROLLSURF sensor for different hot rolling condition; b) coefficient of friction by ROLLSURF.
Fig. 11 - a) Tensione tangenziale nella luce fra i cilindri di laminazione misurata con il sensore ROLLSURF in diverse condizioni di laminazione a caldo; b) coefficiente di frizione calcolata mediante ROLLSURF.
Fig. 12 - Result from inverse calculation: surface temperature compared with original measured temperature (a) and heat flux through the roll gap (b).
Fig. 12 - Risultati da modellazione inversa: temperatura di superfice paragonata alla temperatura originale measurata (a) e flusso termico attraverso la luce fra i cilindri (b).
Fig. 13 - Result from inverse calculation: surface temperature compared with original measured temperature (a) and heat flux through the roll gap (b) for different rolling speed.
Fig. 13 - Risultati da modellazione inversa: temperatura superficiale confrontata con la temperatura originale misurata (a) e flusso termico attraverso la luce fra i cilindri di laminazione (b) per diverse velocità di laminazione.
Acciaio
Fig. 14 - Equivalent average heat fluxes in the real roll gap for different strip reductions at two temperatures
for a rolling speed of 1 m/s.
Fig. 14 – Flusso termico equivalente medio nella luce effettiva fra i cilindri di laminazione per diverse riduzioni di nastri a due
temperature con una velocità di laminazione di 1 m/s.
CONCLUSION
The contact length measured with both the pin sensor and the ROLLSURF sensor are fairly equal. The measured con-tact length became larger than the theoretically calculated value using the Hitchcock roll flattening model. The theo-retical model does not regard the deformation behaviour of the strip inside the roll gap and the model therefore underestimates the contact length, especially for the alu-minium, which is believed to partly be caused by the larger elastic recovery for these strips.
The rolling force can be well predicted from the contact pressure measured with the ROLLSURF sensor, however, the voltage signal from the ROLLSURF amplifier reaches the upper limit at 120 kN and loads above this value can-not be accurately predicted. The pin sensor generally mea-sured higher loads, and this is believed to be caused by the higher stiffness of the pin compared to the work roll that will flatten in the contact. The reduction below the pin will therefore be slightly larger than in the surrounding area. In general, the normal forces measured with the pin sensor were more distinct than the forces obtained using the signals from the ROLLSURF sensor, however the pin sensor appears to be more sensitive to material penetration into the small gaps between the pin and the hole required for sensor clea-rance, especially when predicting tangential loads.
The relationship between the tangential and the normal lo-ads obtained in these tests is in line with similar work in this area that shows that the coefficient of friction in the roll gap is far from being a constant value, and also that the pressu-re peak does not coincide with the neutral plane [8].
ACKNOWLEDGEMENTS
The authors wish to acknowledge financial support from VINNOVA in Sweden and the Research Fund for Coal and Steel together with industrial support from Ruukki, Sand-vik MT and Åkers.
The research in the presented paper has also been sup-ported by the internal grant of the Brno University of Tech-nology focused on specific research and development No. FSI-S-11-20.
REFERENCES
1] N.G. JONSSON, J LAGERGREN, T WANHEIM, A surface transducer for roll gap measurements of friction and load in both hot and cold rolling, 4th Internatio-nal Conference on Tribology in Manufacturing Processes, ICTMP (2010) 2] A NILSSON, N-G JONSSON, Contact Pressures and Frictional Forces in The
Roll Gap During Symmetric and Asymmetric Hot Rolling, Proceedings of the 4th international conference on Tribology in Manufacturing Processes, Nice, France June 13th-15th, (2010), p 859-868.
3] A NILSSON, N-G JONSSON, J LAGERGREN,T LUKS, A transducer for normal pressure, friction stress and contact length measurements in hot and cold flat rolling of metals.30th JSI, Paris (2012)
4] P.G. STEVENS, K.P. IVENS and P. HARPER, Increasing work-roll life by impro-ved roll-cooling practice. Journal of the Iron and Steel Institute 209 (1971) 5] P. KOTRBACEK, M. RAUDENSKY, J. HORSKY, M. POHANKA, Experimental
stu-dy of heat transfer and heat flux by inverse analysis during steel strip rolling, Revue de metalurgie 103 (2006) p. 333.
6] J. ONDROUŠKOVÁ, M. POHANKA, B. VERVAET, Heat Flux Computation from Measured Temperature Histories during Hot Rolling. Materiali in Tehnologije 47 (2013), p. 85.
7] J. BECK, B. BLACKWELL and C. R. CLAIR Inverse heat conduction: ill-posed problems. Wiley, New York (1985)
8] A.K. TIRU, Y.J. LIU, Friction variation in the cold rolling process, Tribology International 37 (2004) p. 177–183.
ANALISI MEDIANTE DIVERSI SENSORI DELLA
DISTRIBUZIONE DI TENSIONI DI CONTATTO
E DI TEMPERATURA DELLA SUPERFICIE DI
LAMINAZIONE NEL ROLL GAP
Parole chiave: Acciaio – Laminazione
In questo lavoro sono state misurate le tensioni e le tem-perature di contatto durante la laminazione a caldo e freddo. Per le misurazioni è stato utilizzato un cilindro di lavorazione contenente tre diversi sensori. Sono sta-ti usta-tilizzasta-ti due sensori di contatto per misurare diretta-mente le forze e un sensore di temperatura .
Uno dei sensori era il sensore denominato “ROLLSURF”. I risultati ottenuti con questo sensore sono già stati pre-sentati in precedenza [ 1-3 ] . Il principio di misurazio-ne è basato sulla misura della deformaziomisurazio-ne mediante estensimetri inseriti in un cilindro interno incorporato. Il secondo era un sensore a spillo. Le forze sulla parte superiore del sensore sono state misurate mediante trasduttori piezoelettrici a tre assi. Il sensore a spillo è stato montato all’interno del rullo di lavorazione opposto al sensore “ROLLSURF”. Il terzo sensore era una termo-coppia posta vicino al sensore a spillo.
Le temperature sono state misurate molto vicino alla su-perficie di laminazione . Le condizioni superficiali, tra cui il flusso di calore e le temperature superficiali, sono stati calcolati utilizzando metodi di modellazione inversa svi-luppati presso la Brno University of Technology .
L’obiettivo principale di questo lavoro è stato quello di presentare il confronto tra le forze di contatto e la lun-ghezza del contatto misurati con il sensore estensimetri-co e il sensore a spillo.