HAL Id: hal-02265857
https://hal.archives-ouvertes.fr/hal-02265857
Submitted on 12 Aug 2019HAL is a multi-disciplinary open access archive for the deposit and dissemination of sci-entific research documents, whether they are pub-lished or not. The documents may come from teaching and research institutions in France or abroad, or from public or private research centers.
L’archive ouverte pluridisciplinaire HAL, est destinée au dépôt et à la diffusion de documents scientifiques de niveau recherche, publiés ou non, émanant des établissements d’enseignement et de recherche français ou étrangers, des laboratoires publics ou privés.
Thomas Remen, Lesley Richardson, Corinne Pilorget, Gilles Palmer, Jack
Siemiatycki, Jérôme Lavoue
To cite this version:
Thomas Remen, Lesley Richardson, Corinne Pilorget, Gilles Palmer, Jack Siemiatycki, et al.. Develop-ment of a Coding and Crosswalk Tool for Occupations and Industries. Annals of Work Exposures and Health, Oxford University Press, 2018, 62 (7), pp. 796-807. �10.1093/annweh/wxy052�. �hal-02265857�
For Review Only
Development of a coding and crosswalk tool for occupations and industries
Journal: Annals of Work Exposures and Health Manuscript ID ANNWEH-18-0039.R1
Manuscript Type: Original Articles Date Submitted by the Author: 10-Apr-2018
Complete List of Authors: Rémen, Thomas; University of Montreal Hospital Research Center Richardson, Lesley; University of Montreal Hospital Research Centre (CRCHUM)
Pilorget, Corinne; French Public Health Agency, Work and Health; University of Claude Bernard Lyon 1, Ifsttar, UMRESTTE, UMR T_9405 Palmer, Gilles; French Center for Research and Development in Medical Informatics, ISPED, Inserm U897
Siemiatycki, Jack; University of Montreal Hospital Research Center Lavoué, Jérôme; University of Montreal Hospital Research Center Keywords: agreement, computer-coding assistant, job-exposure matrix
DEVELOPMENT OF A CODING AND CROSSWALK TOOL FOR
OCCUPATIONS AND INDUSTRIES
Remen T
1, Richardson L
1, Pilorget C
2,3, Palmer G
4, Siemiatycki J
1, Lavoue J
1 1University of Montreal Hospital Research Center (CRCHUM), Montreal, Canada
2
The French Public Health Agency, Saint Maurice, France
3
Univ Lyon, University of Claude Bernard Lyon1, Ifsttar, UMRESTTE, UMR T_9405, F- 69373, Lyon, France.
4
French Center for Research and Development in Medical Informatics (CREDIM), ISPED, Bordeaux, France
3 4 5 6 7 8 9 10 11 12 13 14 15 16 17 18 19 20 21 22 23 24 25 26 27 28 29 30 31 32 33 34 35 36 37 38 39 40 41 42 43 44 45 46 47 48 49 50 51 52 53 54 55 56
ABSTRACT
Introduction: Job coding into a standard occupation or industry classification is commonly
performed in occupational epidemiology and occupational health. Sometimes, it is necessary to code
jobs into multiple classifications or to convert job codes from one classification to another. We
developed a generic tool, called CAPS-Canada (http://www.caps-canada.ca/), that combines a
computer assisted coding tool covering seven International, Canadian and U.S. occupation and
industry classifications and an assistant facilitating crosswalks from one classification to another. The
objectives of this paper are to present the different functions of the CAPS-Canada tool and to assess
their contribution through an inter-rater reliability study.
Method: The crosswalk assistant was built based on a database of >30 000 jobs coded during a
previous project. We evaluated to what extent it would allow automatic translation between pairs of
classifications. The influence of CAPS-Canada on agreement between coders was assessed through
an inter-rater reliability study comparing three approaches: manual coding, coding with
CAPS-Canada without the crosswalk assistant, and coding with the complete tool. The material for this
trial consisted of a random sample of 1,000 jobs extracted from a case-control study and divided
into 3 subgroups of equivalent size.
Results: Across the classification sytems, the crosswalk assistant would provide useful information
for 83% to 99% of jobs (median 95%) in a population similar to ours. 18% to 81% of jobs (median
56%) could be entirely automatically recoded. Based on our sample of 1,000 jobs, inter-rater
reliability in occupation coding ranged from 35.7% to 66.5% (median 53.7%.) depending on the
combination of classification/resolution. Compared with manual coding, the use of CAPS-Canada
substantially improved inter-rater reliability. 3 4 5 6 7 8 9 10 11 12 13 14 15 16 17 18 19 20 21 22 23 24 25 26 27 28 29 30 31 32 33 34 35 36 37 38 39 40 41 42 43 44 45 46 47 48 49 50 51 52 53 54 55 56
Conclusion: CAPS-Canada is an attractive alternative to manual coding and is particularly relevant for
coding a job into multiple classifications or for recoding jobs into other classifications.
Keywords: agreement, computer-coding assistant, job-exposure matrix 3 4 5 6 7 8 9 10 11 12 13 14 15 16 17 18 19 20 21 22 23 24 25 26 27 28 29 30 31 32 33 34 35 36 37 38 39 40 41 42 43 44 45 46 47 48 49 50 51 52 53 54 55 56
INTRODUCTION
National classifications for occupation and industry were first developed in the last decades of the
19th century to serve the needs of population censuses (Conk, 1978; Woollard, 1999). They started
as listings of occupations without any hierarchical structure, and tended to reflect social strata
rather than tasks performed. In the past 50 years, such classifications have grown increasingly
detailed based on the tasks and responsibilities of workers. It has long been the practice to use such
classifications to code the jobs of workers in epidemiologic studies and to conduct analyses of
disease risks in different occupations and industries (Mannetje and Kromhout, 2003; Arheart et al.,
2011). Such procedures are relatively inexpensive, and they can be useful for hypothesis-generation,
but the occupation code is a fairly crude indicator of occupational exposure, which is usually of
greater interest (Siemiatycki et al., 1981; Siemiatycki, 1991).
While many consider expert assessment to be the most valid approach for retrospective exposure
assessment in case-control studies (McGuire et al., 1998; Teschke et al., 2002; Fritschi et al., 2003), it
is very costly and time-consuming (McGuire et al., 1998). An alternative method of exposure
assessment is to use a job exposure matrix (JEM). Most JEMs use standard occupation (or industry)
classification as the job axis, but there are many such classifications, both national and international,
from which to choose. Thus, an important component of occupational study design is the choice of
the occupation (or industry) classification system to use for the job histories collected.
Job coding into a standard occupation or industry classification system is both important and
imperfect. The classification system may be imprecise or it may not align perfectly with the job
description from records or subjects, and there are subjective judgements about how to fit one set
of words against another. All this leads to loss of validity and inter-rater reliability of coding
(Mannetje and Kromhout, 2003; Pilorget et al., 2003). In some situations, as for exposure 3 4 5 6 7 8 9 10 11 12 13 14 15 16 17 18 19 20 21 22 23 24 25 26 27 28 29 30 31 32 33 34 35 36 37 38 39 40 41 42 43 44 45 46 47 48 49 50 51 52 53 54 55 56
assessment through the use of a JEM or for participation in multi-center efforts, the investigator
may need to code the jobs into more than one classification system. The coding can be done
manually based on original job descriptions in the questionnaire. However, coding hundreds or
thousands of jobs into a new occupation or industry classification is costly. Alternatively, the job
codes can be translated by the use of crosswalks. National or international bodies that create such
occupation/industry classification systems sometimes provide official crosswalks to other systems or
between older and newer versions. However, these cannot be applied directly as they contain many
links that are not univocal, i.e. one-to-many, many-to-one, or many-to-many. For instance, the
translation of the ISCO-1968 code 7-76.10 “Baker, General” provides three different possibilities for
ISCO-2008: 3122 “Manufacturing supervisors Official”; 7512 “Bakers, pastry-cooks and confectionery
makers” and 8160 “Food and related products machine operators”. Such links have to be resolved
individually based on expert opinion as to which possibility is the “best” or “most likely”, and this in
turn leads to measurement error in subsequent exposure assessment.
The University of Montreal Hospital Research Centre has partnered with the French National
Institute for Health Surveillance (ex-InVS now Santé Publique France) and the French Center for
Research and Development in Medical Informatics (CREDIM) to develop a tool to assist in coding of
occupations and industries. The tool is known by its French acronym, CAPS1. Initially created by
Santé Publique France to support occupation coding efforts in France, CAPS was further developed
between 2012-2015. Two versions of the CAPS tool were developed: the French version
(http://www.caps-france.fr/) which covers International, European and French occupation and
industry classifications, and the Canadian version (http://www.caps-canada.ca/) which covers
International, Canadian and U.S. classification systems. Both versions are bilingual (English and
French), integrate a computer assisted coding tool that allows finding the most suitable code by
1
Assisted Coding of Occupations and Industries.
3 4 5 6 7 8 9 10 11 12 13 14 15 16 17 18 19 20 21 22 23 24 25 26 27 28 29 30 31 32 33 34 35 36 37 38 39 40 41 42 43 44 45 46 47 48 49 50 51 52 53 54 55 56
keyword search and include a crosswalk assistant based on official crosswalks between
classifications. The Canadian crosswalk function is augmented by an additional system of crosswalks
to reduce the number of equivocal links between classifications.
The objectives of this paper are threefold: we aim to present CAPS-Canada and its development,
describe how the system of crosswalks was implemented, and assess the contribution of its different
functions through an inter-rater reliability study.
METHODS
A. Development of the CAPS-Canada tool
The current version of CAPS-Canada includes two major functions: a coding assistant, and a
crosswalk assistant.
A.1. Coding assistant
CAPS-Canada allows coding into seven classifications, four being related to occupations: the
International Standard Classification of Occupations of 1968 (ISCO-1968), the Canadian Classification
and Dictionary of Occupations of 1971 (CCDO-1971); the National Occupational Classification of
2011 (NOC-2011) from Canada and the US Standard Occupational Classification of 2010
(US-SOC-2010); and three related to industries: the United Nations Industrial Classification of All Economic
Activities of 1971 (ISIC-1971), the Canadian version of North American Industry Classification System
of 2012 (NAICS-2012) and the US Standard Industrial Classification of 1980 (SIC-1980).
From these official classifications provided by national or international agencies, the following items
of information were extracted in separate fields for each occupation or industry code: main title, job 3 4 5 6 7 8 9 10 11 12 13 14 15 16 17 18 19 20 21 22 23 24 25 26 27 28 29 30 31 32 33 34 35 36 37 38 39 40 41 42 43 44 45 46 47 48 49 50 51 52 53 54 55 56
description, associated titles (includes synonyms, examples, sub-occupation title, or even user
defined titles).
CAPS-Canada includes a search engine based on keywords (entered by the coders) that functions as
follows: each time a keyword(or its inflected form) is found in one of the fields of a record, a score is
attributed to the record. The score varies depending on where the keyword is found in the various
fields of information available in the classification; a weight of 1.5 is allocated for keywords found in
the main title while a score of 1.0 is allocated for keywords found in the other fields such as
« definition” or “synonyms” (this was in part based on the idea that occupations with the keyword in
the title would be likelier candidates, in part a practical decision to avoid a long list of potential
codes with the same score). Only one score is attributed for each keyword; if a keyword is found in
several fields, only the maximum score is attributed. The final score for a record is the sum of the
scores across all keywords. All records with a non-null score are presented, ranked according to their
score. It is possible to customize the parameters: users with administration privileges can include or
exclude any field from the indexing, and also attribute new weights to each field, separately for each
classification.
A.2. Crosswalk assistant
CAPS-Canada also includes a crosswalk assistant for translation of a code from one classification to
another. This tool was built by starting with “official” crosswalks (defined below), and supplementing
those with two data sources from our studies, which we label “empirical”; and “expert” links.
“Official” links
National or international agencies that have created occupation or industry classifications
sometimes published crosswalks to other systems. We used such tables to establish links among the
classifications included in CAPS-Canada, and refer to them as “official” links. These links simply 3 4 5 6 7 8 9 10 11 12 13 14 15 16 17 18 19 20 21 22 23 24 25 26 27 28 29 30 31 32 33 34 35 36 37 38 39 40 41 42 43 44 45 46 47 48 49 50 51 52 53 54 55 56
provide, for a given occupation (or industry) code in a starting classification, the corresponding list of
potential codes in the selected target classification. The links are sometimes one-to-one matches of
codes, but most links point to multiple possible codes in the target classification (as shown in Table
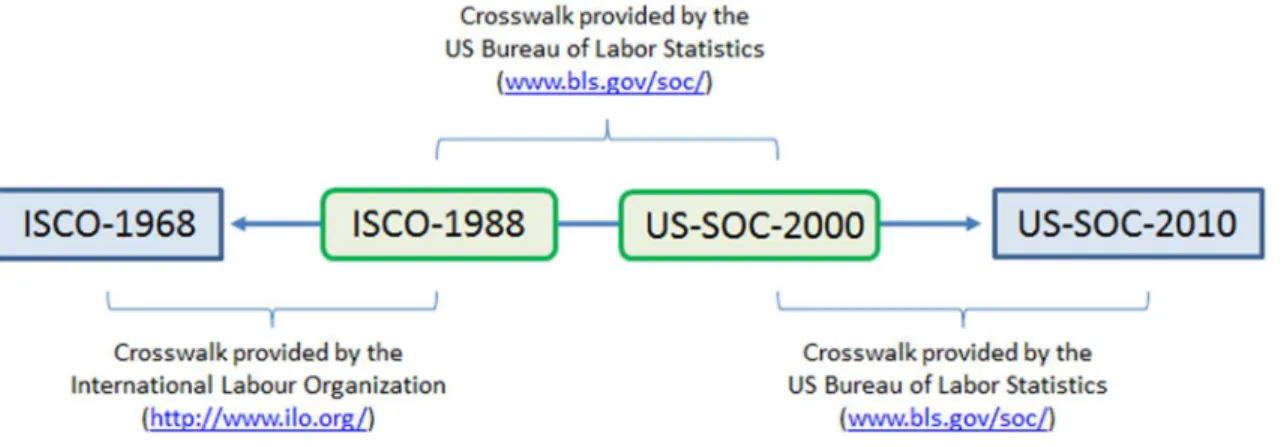
1). Where no official crosswalk exists between a given pair of classifications, it was possible to
establish indirect linkages via multiple existing crosswalks. For example, there is no direct official
crosswalk between ISCO-1968 and US-SOC-2010 codes, but there were official crosswalks between
ISCO-1968 and ISCO-1988, between ISCO-1988 and US-SOC-2000, and between US-SOC-2000 and
2010. The sequence of crosswalks used to establish a link between ISCO-1968 and
US-SOC-2010 is illustrated in Figure 1. Given the sequence of crosswalk steps, the links are rarely univocal,
with frequent occurrences of one-to-many or many-to-one associations, as illustrated in Appendix A.
Figure 1: Description of the several steps used for “official” crosswalks between ISCO-1968 and
US-SOC-2010 classifications
“Official” links constitute the default value in CAPS-Canada, when there are no available “empirical”
or “expert” links (see below).
If a link for a code in one classification leads to a large number of potential codes in the target
classification, the value of such a link in helping a user translate the initial code is questionable. 3 4 5 6 7 8 9 10 11 12 13 14 15 16 17 18 19 20 21 22 23 24 25 26 27 28 29 30 31 32 33 34 35 36 37 38 39 40 41 42 43 44 45 46 47 48 49 50 51 52 53 54 55 56
Hence, links for starting codes for which there were more than 10 possible codes in the target
classification were not kept in CAPS-Canada. Information on how frequently this occurred for
“official” links in our study is provided in Table 1.
“Empirical” links
“Empirical” links are those that we created using a database of jobs that had previously been
“manually” coded in several systems. The jobs coded came from subjects who had participated in
four case-control studies conducted by our team in Greater Montréal, Canada (Gerin et al., 1985;
Labreche et al., 2003; Ramanakumar et al., 2006; Interphone Study Group, 2010; Lavoue et al., 2014;
Kirkham et al., 2016). Each participant in these studies was asked to provide a detailed description of
each job they had held in their working lifetime. Each job description was initially coded by a team of
experts using Canadian occupational classification (CCDO-1971) and Canadian industrial
classification (SIC-1980). More recently, the jobs were coded in the other five classifications
mentioned above by the 2 coders (DR and EA) that participated to this work. All of coding was
performed “manually” by expert coders. In total, 31 673 jobs were coded in each of the seven
classification systems.
To simplify the explanation, let’s consider that there are two occupation classification systems A and
B, and we wish to create an empirical crosswalk from A to B. For simplicity we will refer to the job
code i of classification A as A-i. Suppose there were 50 jobs in our database that were assigned in
classification A to code 1 (i.e. A-1). Suppose that in our database, of those same 50 jobs, using
classification B, 40 had been assigned code B-1 and 10 had been assigned code B-2. Therefore,
starting from job code A-1, the most probable corresponding code in target classification B was B-1
(80%), followed by B-2 (20%). This constitutes an empirical link from classification-code A-1 to 3 4 5 6 7 8 9 10 11 12 13 14 15 16 17 18 19 20 21 22 23 24 25 26 27 28 29 30 31 32 33 34 35 36 37 38 39 40 41 42 43 44 45 46 47 48 49 50 51 52 53 54 55 56
classification-codes B-1 and B-2. Such a calculation was performed between every pair of codes
across all pairs of classification systems.
Two additional restrictions were used in the creation of empirical links : (i) the starting code involved
at least ten jobs in our database in order to ensure a minimal accuracy of the frequencies, and (ii)
when a starting code is associated with more than ten codes in the target classification, the
cumulative relative frequency of the 10 most frequent target codes is greater than or equal to 80%
(i.e. the 10 most frequent target codes represent at least 80% of the jobs).
As an illustration, in our database, the CCDO-1971 code 1130-126 – “General Manager, finance
(bank. & finance)” was assigned to 12 jobs. It is linked to the two following ISCO-1968 codes: (i)
2-19.50 – “Budgeting and Accounting Manager” for 83% and (ii) 2-11.10 – “General Manager” for 17%
of 12 jobs.
By contrast with “official” links which provide all possible target classification codes for each starting
classification code, the empirical links display the probability of each target classification code for
each starting classification code.
“Expert” links
“Expert” links consist of a one-to-one association based on expert opinion.
Each job description in our epidemiological database was initially coded in CCDO-1971 and SIC-1980.
As mentioned above, two coders (those involved in the current study) later added the five other
classifications. At this stage, the two coders identified some connections where, for a starting
CCDO-1971 code (or SIC-1980 code), they always assigned the same occupation (or industry) code in
another classification even if several possible codes existed. Such connections were discussed
between them and, when consensus was reached, saved as “expert” links. 3 4 5 6 7 8 9 10 11 12 13 14 15 16 17 18 19 20 21 22 23 24 25 26 27 28 29 30 31 32 33 34 35 36 37 38 39 40 41 42 43 44 45 46 47 48 49 50 51 52 53 54 55 56
For example, although the CCDO-1971 code 3131-130 “Nurse, general duty (medical)” is possibly
connected to seven different ISCO-1968 codes, the coders decided by consensus to always use code
0-71.10 “Professional nurse (medical)”. Thus the translation of CCDO-1971 code 3131-130 to
ISCO-1968 code 0-71.10 is an “expert” link.
For one code in a starting classification, an official link would be available most frequently in CAPS
(an official link would always exist in the official crosswalk, but it might not be shown in CAPS if the
number of potential target codes is greater than 10). In a smaller number of cases, empirical links
would be available where enough jobs were present in our data to estimates probabilities (in
addition to the two restrictions mentioned above). Finally expert links are limited to the starting
classifications CCDO-1971 and SIC-1980, and by the relatively few situations where experts felt
sufficiently confident to create a univocal association).
Contribution of “empirical” and “experts” links
As mentioned above, “Empirical” and “experts” links are not available for all possible pairs of codes
in all pairs of classification systems. Thus it is not an option to build CAPS-Canada on only “empirical”
and “experts” links. These are used when available, but the default when they are not available is
the “official” link. In order to assess the marginal benefit of “empirical” and “experts” links as
additions to the official links, we compared the use of the full crosswalk assistant (including
“official”; “empirical” and “expert” links) with the use of “official” links only. We evaluated, for each
possible pair of starting / target classifications, for what proportion of jobs in our database the
crosswalk from the starting to the target classification would lead to useful information (i.e. no more
than ten possibilities in the target classification). We were also interested in the ability of the
crosswalk systems to be used to perform fully automated recoding, which require univocal links
only. For this purpose we estimated for what proportion of jobs in our database the crosswalk from 3 4 5 6 7 8 9 10 11 12 13 14 15 16 17 18 19 20 21 22 23 24 25 26 27 28 29 30 31 32 33 34 35 36 37 38 39 40 41 42 43 44 45 46 47 48 49 50 51 52 53 54 55 56
the starting to the target classification would provide only univocal links. For this calculation, we
considered “empirical” links as univocal when, for a given starting code, a single target code
represented at least 80% of all links in our database.
Hierarchy of systems when multiple systems are available in crosswalk assistant
Given that CAPS-Canada combines three different systems of crosswalks (based on “official”;
“empirical”; and “expert” links), more than one can be available for a particular starting code. In
such a situation, only the crosswalk based on the most informative link was retained by
CAPS-Canada. As “expert” links are univocal, when they exist, they override any other type of link.
Otherwise, when an “empirical” link is available, it overrides any “official” one.
B. Inter-rater reliability study
We conducted a study to assess how the use of CAPS-Canada influenced the agreement between
our two coders (DR and EA) in comparison with that of conventional manual coding. Further, in
addition to evaluating the performance of the full CAPS-Canada tool with all the crosswalk systems,
we were interested in assessing the added value of including “empirical” and “expert” links to
facilitate the user recoding choice. Therefore, three different approaches were compared with each
other:
(i) Manual approach : manual coding based on published version of the classifications
With this first approach, the coders only had access to the electronic versions (Portable document
Format or PDF) of the classifications and official crosswalks provided by the different national or
international agencies.
(ii) Partial CAPS : CAPS coding assistant + “official” crosswalk assistant
3 4 5 6 7 8 9 10 11 12 13 14 15 16 17 18 19 20 21 22 23 24 25 26 27 28 29 30 31 32 33 34 35 36 37 38 39 40 41 42 43 44 45 46 47 48 49 50 51 52 53 54 55 56
With this second approach, the coders had access to the coding assistant and to the crosswalk
restricted to “official” links.
(iii) Full CAPS: the full CAPS-Canada tool including all crosswalk types
This final version included the full coding and crosswalk assistants, including “official”, “empirical”
and “expert” links.
We used the inter-rater reliability of coding between two coders as the measure of quality of the job
coding. As there is usually no gold standard when coding occupation or industry, and we were
unable to have a group of coders create a consensus list of codes, inter-rater reliability between our
two coders appeared a useful, albeit imperfect, proxy. It should, however, be remembered that
perfect inter-rater reliability is not realistically attainable. Job coding comes with intrinsic variability
stemming from incomplete task descriptions, task descriptions incompatible with a classification’s
structure, and personal interpretation of the coders.
Data source for the reliability study
The jobs were extracted from a population-based case-control study of lung cancer conducted from
1996 to 2001 (one of the 4 studies mentioned above). The study population consisted of males and
females aged 35–75 years residing in Greater Montréal who were Canadian citizens. More details
are available elsewhere (Ramanakumar et al., 2007).
There was a total of 2,740 subjects in the study, and a total of 13,992 jobs. For the present trial, a
random sample of 1,000 jobs was extracted.
Job coding
The sample of 1,000 jobs was randomly divided into 3 equal (333, 333 and 334) sized subgroups for
each coding approach. The first subgroup was coded with the manual approach; the second by the 3 4 5 6 7 8 9 10 11 12 13 14 15 16 17 18 19 20 21 22 23 24 25 26 27 28 29 30 31 32 33 34 35 36 37 38 39 40 41 42 43 44 45 46 47 48 49 50 51 52 53 54 55 56
partial CAPS approach sample, and the third by the full CAPS approach. All the jobs, using all three
approaches, were independently coded by two expert coders based on job titles and tasks
descriptions. They were tasked with coding the 1,000 jobs into the four occupation and three
industry classification systems mentioned previously.
Note that with both (partial and full) CAPS approaches, the coders usually started to code one
combination of occupation and industry classifications which they then attempted to convert to the
other systems. They often used CCDO-1971 / SIC-1980 as starting classifications since they are very
detailed.
All jobs were coded at the highest hierarchical level for each classificiation (e.g. 7-Digit CCDO-1971).
For the calculations involved in the inter-reliability study, codes for lower resolutions (e.g. 4- and
3-Digit CCDO-1971) were obtained by truncation.
Data analysis for the reliability study
For each classification system and each level of resolution available in the respective system, we
computed the inter-rater reliability (IRR, also called inter-rater agreement) in job coding. While
percentage of agreement is an unsatisfactory measure of inter-rater reliability when there are few
categories to be assigned and the probability of chance agreement is high, given that there are
hundreds of occupation codes in these classification systems, the probability of chance agreement is
very low. Consequently the percentage of agreement is in fact a good marker, and we assessed IRR
by estimating the proportion of jobs coded identically by the two coders.
Results will be presented overall and by coding approach.
RESULTS
3 4 5 6 7 8 9 10 11 12 13 14 15 16 17 18 19 20 21 22 23 24 25 26 27 28 29 30 31 32 33 34 35 36 37 38 39 40 41 42 43 44 45 46 47 48 49 50 51 52 53 54 55 56The analyses presented in this paper were performed for each of the four occupation classifications
and each of the three industry classifications available in CAPS-Canada. However, we will focus on
the occupation classifications in this paper, with a brief mention of industry specific patterns in the
discussion (results related to industry classifications are available in supplementary material in the
online edition).
A. Development of the CAPS-Canada tool
Crosswalks between classification systems
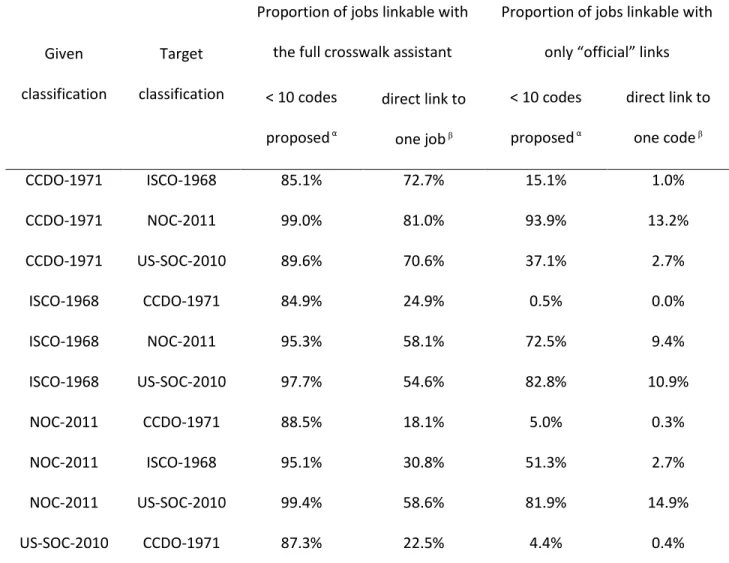
Table 1 shows the proportion of jobs in our database for which the CAPS-Canada crosswalks can
provide “useful” information (i.e. no more than ten possibilities in the target classification), or for
which the automated recoding could be implemented (i.e. univocal links only). To further illustrate
the contribution of the CAPS-Canada crosswalks, the table shows the same results when restricted
to “official” links.
The use of four different occupational classification systems led to the creation of 12 possible
directional pairs of occupation classifications. Depending on the directional pair considered, using
the full crosswalk assistant (all links combined), “useful” information was available for 85% to 99% of
jobs (median 95%). In comparison, “official” links were available for far fewer jobs ranging from 0.5%
for the ISCO-1968 to CCDO-1971 conversion to 93% for the US-SOC-2010 to NOC-2011 conversion,
with a median of 61%. Retricted to univocal links only, the full crosswalk assistant could lead to
automated recoding for 18% to 81% of jobs (median 56%). In contrast, “official” links could lead to
automated recoding for 0% to 34% of jobs (median 3%) (Table 1).
When considering the relative contribution of the different link types to the overall proportion of
jobs covered, expert and empirical links (which both override official links when available), generally 3 4 5 6 7 8 9 10 11 12 13 14 15 16 17 18 19 20 21 22 23 24 25 26 27 28 29 30 31 32 33 34 35 36 37 38 39 40 41 42 43 44 45 46 47 48 49 50 51 52 53 54 55 56
represented the overwhelming majority of the information. Detailed results are presented in
Appendix B.
B. Inter-rater reliability study
IRR – All approaches combined
Table 2 presents IRRs in job coding between the two coders for each classification used. They ranged
from 35.7% (7-digit CCDO-1971) to 66.5% (3-digit CCDO-1971), with a median of 53.7%. When
considering the classifications at their highest resolution level, lower IRRs were observed for
classifications containing the highest number of codes. The lowest IRR value (35.7%) was observed
for the 7-digit CCDO-1971 covering 7,907 different codes and the highest (53.9%) for the 4-digit
NOC-2011 covering only 500 different codes. The IRR also consistently increased with lower
resolutions of the classification system.
IRR by coding approach
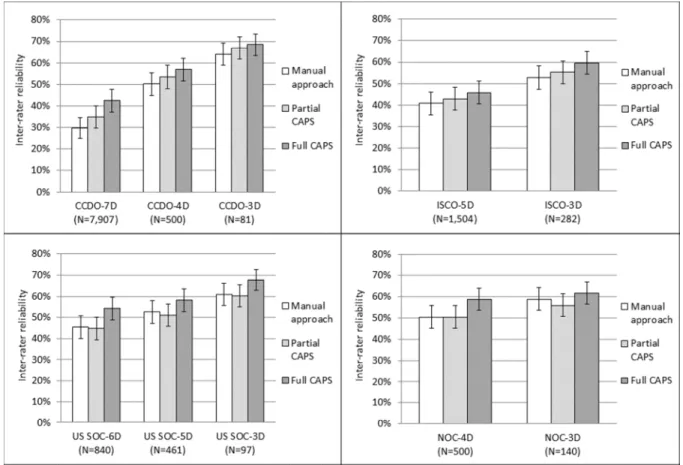
Figure 2 shows for each classification the IRR for each coding approach used (manual, partial CAPS,
full CAPS). The use of the full CAPS approach was associated with a consistent gain in IRR across all
classifications and resolution compared to the manual approach. Across the 10 combinations of
classification/resolution, the absolute gain in IRR ranged from 2.8% to 12.8% (median 6.7%). These
patterns were similar for the industry analysis.
Use of the “partial” CAPS approach (excluding empirical and expert links) was associated with an
increased IRR for CCDO-1971 (absolute gain ranging from +3.0% to +5.1% depending on resolution)
and ISCO-1968 (+2.1% and +2.4% for the 5- and 3-digit resolutions) classifications, but with decline
for US-SOC-2010 (from -0.6% to -1.5% depending on resolution), and NOC-2011 (no change for the 3 4 5 6 7 8 9 10 11 12 13 14 15 16 17 18 19 20 21 22 23 24 25 26 27 28 29 30 31 32 33 34 35 36 37 38 39 40 41 42 43 44 45 46 47 48 49 50 51 52 53 54 55 56
4-digit and -3.0% for the 3-digit resolutions) classifications. In the industry analysis, a small increase
was observed for ISIC-1971, but no increase or slight decrease for SIC-1980 and NAICS-2012.
DISCUSSION
The free online CAPS-Canada tool was developed to assist in coding occupations and industries. It
combines a method based on a keyword search in the various fields of information (title,
description, synonyms...) available in the documentation of each classification with a system of
crosswalks between classifications. In this paper, we present a description of its development, as
well as the contribution of crosswalks based on “empirical” and “expert” links to support translation
into different classifications. Finally, we present an evaluation of its influence on inter-rater
reliability between coders.
With the growing use of JEMs for assessment of occupational exposures, the ability to translate a set
of coded occupations and industries into other systems becomes critical. Official crosswalks
generally include many equivocal links due to differences in the philosophy behind the coding
structure, or because of different levels of resolution. As illustrated in table 1, this means that their
practical use for recoding from one classification to another is very limited in most cases. Recoding
manually the individual jobs would be prohibitive in terms of cost. Some custom crosswalks were
developed by experts determining for each starting code the closest equivalent in the target
classification (Koeman et al., 2013). Creating such systems involves significant costs and can lead to
coding errors and loss of specificity. Koeman et al. assessed the extent of these errors based on a
limited set of 200 jobs (Koeman et al., 2013). The authors compared the codes attributed by 2
recoders with codes attributed automatically by custom crosswalks translating from a Dutch
occupation classification into ISCO-1968 and ISCO-1988 codes. Similar agreement was observed 3 4 5 6 7 8 9 10 11 12 13 14 15 16 17 18 19 20 21 22 23 24 25 26 27 28 29 30 31 32 33 34 35 36 37 38 39 40 41 42 43 44 45 46 47 48 49 50 51 52 53 54 55 56
between the expert-crosswalk and each recoder and between the 2 coders. The non-official
crosswalk system we created, based on the coding of >30,000 jobs in 7 classiffications, offers an
interesting alternative to reasearchers wishing to translate their initial coding into other systems.
With a restricted list of likely codes provided for a median of 95% of jobs, and over 50% of them
potentially automatically coded, it becomes both viable and efficient to avoid recourse to a custom
crosswalk, especially if such a crosswalk isn’t already available.
Some limitations inherent to the addition of the expert and empirical crosswalks must be
acknowledged. Considering that empirical links correspond to at least 80% relative frequencies in
our source database (so one might expect up to 20% of errors) and expert links depend on expert
judgement, it means that crosswalk translations for occupations or industries that were infrequent
or unusual in our database might be unreliable. However, these risks of errors appear limited in
comparison to what we know about the accuracy of manual coding (discussed below).
The generalizability of this tool to users in other countries can be addressed from two viewpoints,
coverage and validity. The default “official” links underlying CAPS-Canada are not dependent on the
Montreal situation, and are thus universally valid, or as valid as official crosswalks can be. The
supplementary information that we built into CAPS does come from an urban Canadian population
that was active from the 1930s to 2000s. We are confident that, given the large number of jobs that
we evaluated in the course of those studies that underlay the creation of empirical and expert
linkages, the occupations and industries covered are sufficiently wide-ranging to cover occupations
that might occur in countries of similar state of industrialization as Canada. As for validity of the
expert and empirical links outside our own study population, this also seems to us like a
phenomenon that would be quite stable across urban industrial populations. 3 4 5 6 7 8 9 10 11 12 13 14 15 16 17 18 19 20 21 22 23 24 25 26 27 28 29 30 31 32 33 34 35 36 37 38 39 40 41 42 43 44 45 46 47 48 49 50 51 52 53 54 55 56
There have been few previous studies of agreement between coders in assigning occupation or
industry codes. An overview of some re-coding trials shows IRR ranging from 44% to 89% for
occupation coding and from 59% to 98% for industry coding at the 4-5 digit level (Mannetje and
Kromhout, 2003). The moderate-to-good IRRs observed in our study at the finest resolution are in
the same magnitude, ranging from 43% [5-digit ISCO-1968] to 53% [4-digit NOC-2011] for
occupations. As expected, the higher the resolution of the occupational code, the greater the
opportunity for disagreement, the lower the IRR values of inter-rater concordance.
All the analyses presented in this manuscript on occupation classifications were also performed with
the industry classifications included in CAPS-Canada. The corresponding results can be found in an
online supplementary document. The patterns observed for industry classifications were similar to
those observed for occupation classifications, albeit with consistently higher inter-rater reliability for
analyses of industry classifications (for comparable numbers of codes).
When comparing the different approaches used for coding, consistent improvement was associated
with the use of the full CAPS tool in comparison to the PDF approach. Compared to the manual
approach, the contribution of the keyword search was inconsistent and differences were within the
confidence intervals. The strongest signal was observed when coding with CCDO-1971, for which it is
plausible that even a simple keyword search and classification browsing functionality would alleviate
the considerable complexity of a system with more than 7,000 codes. Most of the gain therefore
occured through the addition of the expert and empirical crosswalks. This might seem
counter-intuitive, especially given the increase was significant for CCDO-1971, the classification system
usually used first for the coding task. Discussions with the coding experts revealed that they used the
conversions even during the selection of the first code, as a means to navigate across classifications
in different directions to make sure the various codes were all consistent with the task descriptions. 3 4 5 6 7 8 9 10 11 12 13 14 15 16 17 18 19 20 21 22 23 24 25 26 27 28 29 30 31 32 33 34 35 36 37 38 39 40 41 42 43 44 45 46 47 48 49 50 51 52 53 54 55 56
The observed improvement therefore likely represents an improved general confidence caused by
easily linking codes between systems. Because the three methods were tested sequentially, one
might also suspect a gradual improvement in coder’s ability. However the whole study was
performed in three months, and the two coders already had more than a year’s past experience in
job coding. As noted in the methods, inter-coder reliability is an imperfect metric to measure quality
of coding. Hence, the observed increase in IRR might mean CAPS-Canada merely makes the coders’
mistakes more consistent. While this might be of concern for more automated coding tools in which
coder input is limited, we believe it is unlikely that such a phenomenon would explain our results.
Ultimately we cannot entirely exclude it as a possible explanation.
Computer-based tools are recognized as cost-efficient alternatives to manual coding or recoding
(Patel et al., 2012; Russ et al., 2016). Indeed, even if they do not improve the quality of coding, one
study reported a time reduction in coding of 13–23% (Bushnell, 1997). In our study, because of
technical difficulties during the trial associated with server slowdowns, we were unable to formally
assess the time-efficiency of the three tested approaches. The coders, however, when asked to
subjectively assess their perception of gain in time, provided an estimate of approximately 40%
decrease when the tool functioned as intended.
A wide range of computer-based tools have been developed during the lastdecades to assist users in
job coding. Some automatically interpret job descriptions, while some provide assistance either to
professional coders or directly to subjects from a study (Ossiander and Milham, 2006; NIOSH, 2012;
Russ et al., 2014; De Matteis et al., 2016). For instance, the NIOSH Industry and Occupation
Computerized Coding System (NIOCCS) is a web-based software tool designed to translate
occupation and industry desriptions into standardized codes. Records that meet user-specified
autocoding confidence criteria are automatically coded, while the others are transferred into a 3 4 5 6 7 8 9 10 11 12 13 14 15 16 17 18 19 20 21 22 23 24 25 26 27 28 29 30 31 32 33 34 35 36 37 38 39 40 41 42 43 44 45 46 47 48 49 50 51 52 53 54 55 56
computer-assisted coding module (NIOSH, 2012). SOCcer performs a sophisticated analysis of the
words in the text format job descriptions, comparing them to the words in the classification, in order
to provide a list of recommendations (Russ et al., 2016). All these systems are, however, specific to a
single occupation and/or industry classification systems. CAPS-Canada is simpler than most of these
tools, as it can be seen as an advanced computerization of the official classification documentation.
Hence, the coding assistant included in CAPS requires a coder to interpret job and task descriptions
and choose keywords, and then select the proper code among the ranked possibilities. However, it is
important to note that CAPS-Canada covers 7 occupation and industry classifications, including
international systems, and was built to allow easy integration of additional classifications (SIC-1970
and ISCO-2008 are now available) and crosswalks between classifications (official conversions, or
user-provided conversions). Finally, the empirical and expert conversions included in CAPS-Canada,
while directly available in the online tool, can be requested from our group for automated batch
conversion of existing coded datasets.
CONCLUSION
CAPS-Canada combines coding and crosswalk assistants that improve upon manual coding and the
use of official crosswalk tables. Such a tool would be useful for professionals involved in job-coding
and it is of particular interest for those who are required to code jobs into more than one occupation
or industry classification or to recode jobs from one classification to another.
Contribution of the authors
3 4 5 6 7 8 9 10 11 12 13 14 15 16 17 18 19 20 21 22 23 24 25 26 27 28 29 30 31 32 33 34 35 36 37 38 39 40 41 42 43 44 45 46 47 48 49 50 51 52 53 54 55 56
CP, GB and JL developed the coding assistant. JL, LR and JS were involved at different stages of the
creation of the crosswalk assistant. TR performed the analyses and drafted the manuscript. All
co-authors participated to the writing and approved the final manuscript.
Support
The development of the coding assistant was funded by the French National Institute for Health
Surveillance (French Ministry of the Health). This work was also funded in part by a grant of the
Canadian Institutes of Health Research, and by Grant #16264 of the GRePEC program, a joint
initiative of the Cancer Research Society, the Quebec Ministry of Economy, Science and Innovation
and the Fonds de Recherche du Québec – Santé. Dr. Siemiatycki holds the Guzzo-Cancer Research
Society Chair in Environment and Cancer. The authors declare no conflict of interest relating to the
material presented in this article. Its contents, including any opinions and/or conclusions expressed,
are solely those of the authors.
Acknowledgement
The authors thank Loïc Garras, Carine Prévot and Julien Lemonnier for their contribution in the
development of the CAPS coding tool. The authors are grateful to Dora Rodriguez (DR) and Elmira
Aliyeva (EA), the two coders in charge of the coding task, and Ana Gueorguieva for her contribution
in the development of the crosswalks. 3 4 5 6 7 8 9 10 11 12 13 14 15 16 17 18 19 20 21 22 23 24 25 26 27 28 29 30 31 32 33 34 35 36 37 38 39 40 41 42 43 44 45 46 47 48 49 50 51 52 53 54 55 56
Table 1: Proportion of jobs in a database of occupational histories (31,673 jobs) for which the CAPS-Canada crosswalk assistant allowed linkage
between pairs of occupation classification systems
Given
classification
Target
classification
Proportion of jobs linkable with
the full crosswalk assistant
Proportion of jobs linkable with
only “official” links
< 10 codes proposed α direct link to one job β < 10 codes proposed α direct link to one code β CCDO-1971 ISCO-1968 85.1% 72.7% 15.1% 1.0% CCDO-1971 NOC-2011 99.0% 81.0% 93.9% 13.2% CCDO-1971 US-SOC-2010 89.6% 70.6% 37.1% 2.7% ISCO-1968 CCDO-1971 84.9% 24.9% 0.5% 0.0% ISCO-1968 NOC-2011 95.3% 58.1% 72.5% 9.4% ISCO-1968 US-SOC-2010 97.7% 54.6% 82.8% 10.9% NOC-2011 CCDO-1971 88.5% 18.1% 5.0% 0.3% NOC-2011 ISCO-1968 95.1% 30.8% 51.3% 2.7% NOC-2011 US-SOC-2010 99.4% 58.6% 81.9% 14.9% US-SOC-2010 CCDO-1971 87.3% 22.5% 4.4% 0.4% 3 4 5 6 7 8 9 10 11 12 13 14 15 16 17 18 19 20 21 22 23 24 25 26 27 28 29 30 31 32 33 34 35 36 37 38 39 40 41 42 43 44 45 46 47 48 49 50 51 52 53 54 55 56
US-SOC-2010 ISCO-1968 97.3% 35.8% 78.8% 4.7%
US-SOC-2010 NOC-2011 98.9% 73.8% 93.4% 34.4%
For each possible pair of starting / target classifications was evaluated for what proportion of jobs in our database the crosswalk from the starting to the target classification would lead to:
α
“< 10 codes proposed” = usefull information provided β “direct link to 1 code” = univocal links
3 4 5 6 7 8 9 10 11 12 13 14 15 16 17 18 19 20 21 22 23 24 25 26 27 28 29 30 31 32 33 34 35 36 37 38 39 40 41 42 43 44 45 46 47 48 49 50 51 52 53 54 55 56
Table 2: Inter-rater reliability in occupation coding between the two coders for each classification used Resolution level (number of Digit) Number of corresponding codes at
the resolution level
Inter-rater reliability
in job coding [95% CI] -
All approaches combined
CCDO-1971 7 7,907 35.7% [32.7%-38.7%] 4 500 53.5% [50.4%-56.6%] 3 81 66.5% [63.5%-69.5%] ISCO-1968 5 1,504 43.2% [40.1% -46.3%] 3 282 55.9% [52.8% -59.0%] US-SOC-2010 6 840 48.1% [45.0% -51.2%] 5 461 53.9% [50.8% -57.0%] 3 97 62.9% [59.9% -65.9%] NOC-2011 4 500 53.2% [50.1% -56.3%] 3 140 58.8% [55.7% -61.9%] 3 4 5 6 7 8 9 10 11 12 13 14 15 16 17 18 19 20 21 22 23 24 25 26 27 28 29 30 31 32 33 34 35 36 37 38 39 40 41 42 43 44 45 46 47 48 49 50 51 52 53 54 55 56
Figure 2: Inter-rater reliability (and 95% confidence interval) in occupation coding according to the
approach used
Manual approach : manual coding based on published version of the classifications - Partial CAPS : CAPS coding assistant + “official” crosswalk assistant - Full CAPS: the full CAPS-Canada tool including all crosswalk types
Classification (version retained) : CCDO-1971, ISCO-1968, US-SOC-2010 and NOC-2011
The figures following the classification indicate the number of digits kept and the number in brackets refers to the number of different codes for the classification/resolution level combination
3 4 5 6 7 8 9 10 11 12 13 14 15 16 17 18 19 20 21 22 23 24 25 26 27 28 29 30 31 32 33 34 35 36 37 38 39 40 41 42 43 44 45 46 47 48 49 50 51 52 53 54 55 56
Appendix A: Correspondances between occupation classifications based on “official” crosswalks
Target classification
7-digit CCDO-1971 5-digit ISCO-1968 6-digit US-SOC-2010 4-digit NOC-2011
Ncodes α NTables β Median [5th - 95th percentile]γ NTables β Median [5th - 95th percentile]γ NTables β Median [5th - 95th percentile]γ NTables β Median [5th - 95th percentile]γ S tar ti n g c las si fi cat io n 7-digit CCDO-1971 7,907 7 53 [7 - 239] 5 17 [2 - 56] 4 4 [1 - 10] 5-digit ISCO-1968 1,504 7 231 [20 - 1165] 2 3 [1 - 13] 2 4 [1 - 18] 6-digit US-SOC-2010 840 5 68 [6 - 894] 2 5 [1 - 22] 2 1 [1 - 6] 4-digit NOC-2011 500 4 34 [4 - 212.05] 2 8 [2 - 52] 2 3 [1 - 11.05] α
Number of different codes for the classification β
Number of intermediate tables used between the starting and target classifications for “official” crosswalks γ
Median and values of the 5th and 95th percentile of the distribution of numbers of possible codes in the target classification linked with each code in the starting classification
3 4 5 6 7 8 9 10 11 12 13 14 15 16 17 18 19 20 21 22 23 24 25 26 27 28 29 30 31 32 33 34 35 36 37 38 39 40 41 42 43 44 45 46 47 48 49 50 51 52 53 54 55 56
Appendix B: Relative contribution of the different types of link covered by the crosswalk assistant
Origin system Target system
Proportion of jobs in a database of occupational histories (31,673 jobs) for which crosswalks provide
usefull information
≤ 10 codes proposed Direct link to 1 job
All links
combinedβ
By type of link (exclusively)α All links
combinedβ
By type of link (exclusively)α
"Expert" "Empirical" "Official" "Expert" "Empirical" "Official"
CCDO-1971 ISCO-1968 85.1% 57.9% 25.6% 1.6% 72.7% 57.9% 14.8% 0.0% CCDO-1971 NOC-2011 99.0% 66.2% 17.5% 15.2% 81.0% 66.2% 12.0% 2.9% CCDO-1971 US-SOC-2010 89.6% 59.2% 24.0% 6.4% 70.6% 59.2% 10.6% 0.8% ISCO-1968 CCDO-1971 84.9% 0% 84.8% 0.1% 24.9% 0% 24.9% 0.0% ISCO-1968 NOC-2011 95.3% 0% 90.3% 5.0% 58.1% 0% 55.6% 2.4% ISCO-1968 US-SOC-2010 97.7% 0% 91.8% 5.8% 54.6% 0% 51.0% 3.6% NOC-2011 CCDO-1971 88.5% 0% 88.1% 0.3% 18.1% 0% 18.0% 0.1% NOC-2011 ISCO-1968 95.1% 0% 94.1% 1.0% 30.8% 0% 29.3% 1.4% NOC-2011 US-SOC-2010 99.4% 0% 97.9% 1.5% 58.6% 0% 57.2% 1.4% US-SOC-2010 CCDO-1971 87.3% 0% 87.0% 0.3% 22.5% 0% 22.3% 0.2% 3 4 5 6 7 8 9 10 11 12 13 14 15 16 17 18 19 20 21 22 23 24 25 26 27 28 29 30 31 32 33 34 35 36 37 38 39 40 41 42 43 44 45 46 47 48 49 50 51 52 53 54 55 56
US-SOC-2010 ISCO-1968 97.3% 0% 94.3% 3.0% 35.8% 0% 34.0% 1.8%
US-SOC-2010 NOC-2011 98.9% 0% 95.4% 3.5% 73.8% 0% 68.0% 5.8%
α
The category of links was ranked from the most to the less informative. When a link is available for a starting code, links at the lower levels were not sought
β
The sum can vary due to rounding
3 4 5 6 7 8 9 10 11 12 13 14 15 16 17 18 19 20 21 22 23 24 25 26 27 28 29 30 31 32 33 34 35 36 37 38 39 40 41 42 43 44 45 46 47 48 49 50 51 52 53 54 55 56
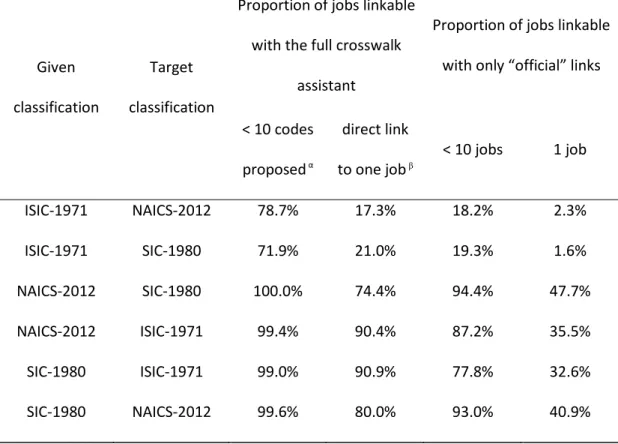
Table S1: Proportion of jobs in a database of occupational histories (31,673 jobs) for which the CAPS-Canada crosswalk assistant allowed linkage
between pairs of industry classification systems
Given
classification
Target
classification
Proportion of jobs linkable
with the full crosswalk
assistant
Proportion of jobs linkable
with only “official” links
< 10 codes proposed α direct link to one job β < 10 jobs 1 job ISIC-1971 NAICS-2012 78.7% 17.3% 18.2% 2.3% ISIC-1971 SIC-1980 71.9% 21.0% 19.3% 1.6% NAICS-2012 SIC-1980 100.0% 74.4% 94.4% 47.7% NAICS-2012 ISIC-1971 99.4% 90.4% 87.2% 35.5% SIC-1980 ISIC-1971 99.0% 90.9% 77.8% 32.6% SIC-1980 NAICS-2012 99.6% 80.0% 93.0% 40.9%
For each possible pair of starting / target classifications was evaluated for what proportion of jobs in our database the crosswalk from the starting to the target classification would lead to:
α
“< 10 codes proposed” = usefull information provided β
“direct link to 1 code” = univocal links
3 4 5 6 7 8 9 10 11 12 13 14 15 16 17 18 19 20 21 22 23 24 25 26 27 28 29 30 31 32 33 34 35 36 37 38 39 40 41 42 43 44 45 46 47 48 49 50 51 52 53 54 55 56
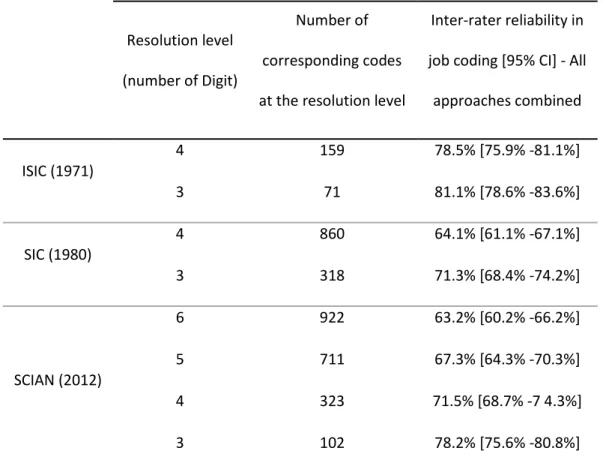
Table S2: Inter-rater reliability in industry coding between the two coders for each classification used
Resolution level
(number of Digit)
Number of
corresponding codes
at the resolution level
Inter-rater reliability in
job coding [95% CI] - All
approaches combined ISIC (1971) 4 159 78.5% [75.9% -81.1%] 3 71 81.1% [78.6% -83.6%] SIC (1980) 4 860 64.1% [61.1% -67.1%] 3 318 71.3% [68.4% -74.2%] SCIAN (2012) 6 922 63.2% [60.2% -66.2%] 5 711 67.3% [64.3% -70.3%] 4 323 71.5% [68.7% -7 4.3%] 3 102 78.2% [75.6% -80.8%] 3 4 5 6 7 8 9 10 11 12 13 14 15 16 17 18 19 20 21 22 23 24 25 26 27 28 29 30 31 32 33 34 35 36 37 38 39 40 41 42 43 44 45 46 47 48 49 50 51 52 53 54 55 56
Table S3: Correspondances between industry classifications based on “official” crosswalks
Target classification
6-digit NAICS-2012 4-digit SIC-1980 4-digit ISIC-1971
Ncodes α NTables β Median [5 th - 95th percentile]γ NTables β Median [5 th - 95th percentile]γ NTables β Median [5 th - 95th percentile]γ S ta rt in g c la ss if ic a ti o n 6-digit NAICS-2012 922 2 1 [1 - 5] 2 2 [1 - 23] 4-digit SIC-1980 860 2 1 [1 - 6] 2 2 [1 - 37] 4-digit ISIC-1971 158 2 20 [1.9 - 99.6] 2 26 [2 - 109.5] α
Number of different codes for the classification
β
Number of intermediate tables used between the starting and target classifications for “official” crosswalks
γ
Median and values of the 5th and 95th percentile of the distribution of numbers of possible codes in the target classification linked with each code in the starting classification
3 4 5 6 7 8 9 10 11 12 13 14 15 16 17 18 19 20 21 22 23 24 25 26 27 28 29 30 31 32 33 34 35 36 37 38 39 40 41 42 43 44 45 46 47 48 49 50 51 52 53 54 55 56
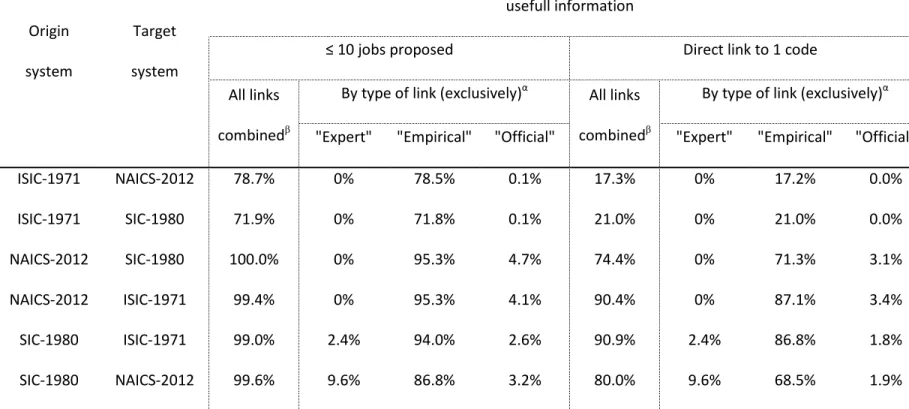
Table S4: Relative contribution of the different types of link covered by the crosswalk assistant
Origin
system
Target
system
Proportion of jobs in a database of occupational histories (31,673 jobs) for which crosswalks provide
usefull information
≤ 10 jobs proposed Direct link to 1 code
All links
combinedβ
By type of link (exclusively)α All links
combinedβ
By type of link (exclusively)α
"Expert" "Empirical" "Official" "Expert" "Empirical" "Official"
ISIC-1971 NAICS-2012 78.7% 0% 78.5% 0.1% 17.3% 0% 17.2% 0.0% ISIC-1971 SIC-1980 71.9% 0% 71.8% 0.1% 21.0% 0% 21.0% 0.0% NAICS-2012 SIC-1980 100.0% 0% 95.3% 4.7% 74.4% 0% 71.3% 3.1% NAICS-2012 ISIC-1971 99.4% 0% 95.3% 4.1% 90.4% 0% 87.1% 3.4% SIC-1980 ISIC-1971 99.0% 2.4% 94.0% 2.6% 90.9% 2.4% 86.8% 1.8% SIC-1980 NAICS-2012 99.6% 9.6% 86.8% 3.2% 80.0% 9.6% 68.5% 1.9% α
The category of links was ranked from the most to the less informative. When a link is available for a starting code, links at the lower levels were not sought
β
The sum can vary due to rounding
3 4 5 6 7 8 9 10 11 12 13 14 15 16 17 18 19 20 21 22 23 24 25 26 27 28 29 30 31 32 33 34 35 36 37 38 39 40 41 42 43 44 45 46 47 48 49 50 51 52 53 54 55 56
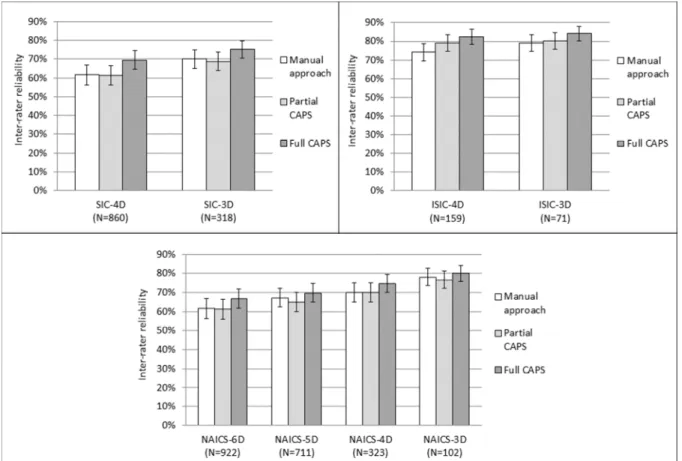
Figure S1: Inter-rater reliability (and 95% confidence interval) in industry coding according to the
approach used
Manual approach : manual coding based on published version of the classifications - Partial CAPS : CAPS coding assistant + “official” crosswalk assistant - Full CAPS: the full CAPS-Canada tool including all crosswalk types
Classification (version retained) : SIC-1980, ISIC-1971 and NAICS-2012
The figures following the classification indicate the number of digits kept and the number in brackets refers to the number of different codes for the classification/resolution level combination
3 4 5 6 7 8 9 10 11 12 13 14 15 16 17 18 19 20 21 22 23 24 25 26 27 28 29 30 31 32 33 34 35 36 37 38 39 40 41 42 43 44 45 46 47 48 49 50 51 52 53 54 55 56
For Review Only
REFERENCES
Arheart KL, Fleming LE, Lee DJ et al. (2011) Occupational vs. industry sector classification of the US workforce: which approach is more strongly associated with worker health outcomes? Am J Ind Med; 54: 748-57.
Bushnell D. (1997) An Evaluation of Computer-Assisted Occupation Coding: Results of a Field Trial. Paris, France. 90-100.
Conk MA. (1978) Occupational Classification in the United States Census: 1870-1940. The Journal of Interdisciplinary History; 9: 111-30.
De Matteis S, Jarvis D, Young H et al. (2016) Occupational self-coding and automatic recording (OSCAR): a novel web-based tool to collect and code lifetime job histories in large population-based studies. Scand J Work Environ Health.
Fritschi L, Nadon L, Benke G et al. (2003) Validation of expert assessment of occupational exposures. Am J Ind Med; 43: 519-22.
Gerin M, Siemiatycki J, Kemper H et al. (1985) Obtaining occupational exposure histories in epidemiologic case-control studies. J Occup Med; 27: 420-6.
Interphone Study Group. (2010) Brain tumour risk in relation to mobile telephone use: results of the INTERPHONE international case-control study. Int J Epidemiol; 39: 675-94.
ITSC. (2010) OccuCoder Product Information. http://www.itsc.org/Pages/pub_aocode.aspx (2017 March 22th).
Jones R, Elias P. (2004) Cascot: Computer Assisted Structured Coding Tool. Coventry: Warwick Institute for Employment Research, University of Warwick.
Kirkham TL, Siemiatycki J, Labreche F et al. (2016) Impact of aggregating exposure information from cases and controls when building a population-based job-exposure matrix from past expert
evaluations. Occup Environ Med; 73: 474-81.
Koeman T, Offermans NS, Christopher-de Vries Y et al. (2013) JEMs and incompatible occupational coding systems: effect of manual and automatic recoding of job codes on exposure assignment. Ann Occup Hyg; 57: 107-14. 3 4 5 6 7 8 9 10 11 12 13 14 15 16 17 18 19 20 21 22 23 24 25 26 27 28 29 30 31 32 33 34 35 36 37 38 39 40 41 42 43 44 45 46 47 48 49 50 51 52 53 54 55 56
For Review Only
Labreche F, Goldberg MS, Valois MF et al. (2003) Occupational exposures to extremely low frequency magnetic fields and postmenopausal breast cancer. Am J Ind Med; 44: 643-52.
Lavoue J, Labrèche F, Richardson L et al. (2014) 0382 CANJEM: a general population job exposure matrix based on past expert assessments of exposure to over 250 agents. Occupational and environmental medicine; 71: A48-A48.
Mannetje A, Kromhout H. (2003) The use of occupation and industry classifications in general population studies. Int J Epidemiol; 32: 419-28.
McGuire V, Nelson LM, Koepsell TD et al. (1998) Assessment of occupational exposures in community-based case-control studies. Annu Rev Public Health; 19: 35-53.
NIOSH. (2012) NIOSH Industry and Occupation Computerized Coding System (NIOCCS).
http://www.cdc.gov/niosh/topics/coding/overview.html (2017 March 22th).
Ossiander EM, Milham S. (2006) A computer system for coding occupation. Am J Ind Med; 49: 854-7.
Patel MD, Rose KM, Owens CR et al. (2012) Performance of automated and manual coding systems for occupational data: a case study of historical records. Am J Ind Med; 55: 228-31.
Pilorget C, Imbernon E, Goldberg M et al. (2003) Evaluation of the quality of coding of job episodes collected by self questionnaires among French retired men for use in a job-exposure matrix. Occup Environ Med; 60: 438-43.
Ramanakumar AV, Parent ME, Menzies D et al. (2006) Risk of lung cancer following nonmalignant respiratory conditions: evidence from two case-control studies in Montreal, Canada. Lung Cancer; 53: 5-12.
Ramanakumar AV, Parent ME, Siemiatycki J. (2007) Risk of lung cancer from residential heating and cooking fuels in Montreal, Canada. Am J Epidemiol; 165: 634-42.
Russ DE, Ho KY, Colt JS et al. (2016) Computer-based coding of free-text job descriptions to efficiently identify occupations in epidemiological studies. Occup Environ Med; 73: 417-24.
Russ DE, Ho KY, Johnson CA et al. (2014) Computer-Based Coding of Occupation Codes for Epidemiological Analyses. Proc IEEE Int Symp Comput Based Med Syst; 2014: 347-50.
Siemiatycki J. (1991). Risk Factors for Cancer in the Workplace, Boca Raton, Florida: CRC Press. 3 4 5 6 7 8 9 10 11 12 13 14 15 16 17 18 19 20 21 22 23 24 25 26 27 28 29 30 31 32 33 34 35 36 37 38 39 40 41 42 43 44 45 46 47 48 49 50 51 52 53 54 55 56
Siemiatycki J, Day NE, Fabry J et al. (1981) Discovering carcinogens in the occupational environment: a novel epidemiologic approach. J Natl Cancer Inst; 66: 217-25.
Teschke K, Olshan AF, Daniels JL et al. (2002) Occupational exposure assessment in case-control studies: opportunities for improvement. Occup Environ Med; 59: 575-93; discussion 94.
Woollard M. (1999) The classification of occupations in the 1881 census of England and Wales. (Historical Censuses and Social Surveys Research Group, Occasional Paper No 1) Colchester, UK: University of Essex. 3 4 5 6 7 8 9 10 11 12 13 14 15 16 17 18 19 20 21 22 23 24 25 26 27 28 29 30 31 32 33 34 35 36 37 38 39 40 41 42 43 44 45 46 47 48 49 50 51 52 53 54 55 56