© 2017 IEEE. Personal use of this material is permitted. Permission from IEEE must be obtained for
all other uses, in any current or future media, including reprinting/republishing this material for
advertising or promotional purposes, creating new collective works, for resale or redistribution to
servers or lists, or reuse of any copyrighted component of this work in other works.
An Intrusion Detection System Based on Polynomial
Feature Correlation Analysis
Qingru Li
College of Information and Technology Hebei Normal University
Shijiazhuang, China [email protected]
Zhiyuan Tan
School of Computing Edinburgh Napier University
Edinburgh, UK [email protected]
Aruna Jamdagni
School of Computing, Engineering and Mathematics Western Sydney University
Sydney, Australia
Priyadarsi Nanda, Xiangjian He
School of Computing and Communications University of Technology, Sydney
Sydney, Australia
{Priyadarsi.Nanda, Xiangjian.He}@uts.edu.au
Wei Han
Xi'an Aeronautics Computing Technique Research Institute Xi’an, China
Abstract—This paper proposes an anomaly-based Intrusion Detection System (IDS), which flags anomalous network traffic with a distance-based classifier. A polynomial approach was designed and applied in this work to extract hidden correlations from traffic related statistics in order to provide distinguishing features for detection. The proposed IDS was evaluated using the well-known KDD Cup 99 data set. Evaluation results show that the proposed system achieved better detection rates on KDD Cup 99 data set in comparison with another two state-of-the-art detection schemes. Moreover, the computational complexity of the system has been analysed in this paper and shows similar to the two state-of-the-art schemes.
Keywords—Intrusion Detection System (IDS); polynomial; feature correlation analysis; Mahalanobis distance; computational complexity
I. INTRODUCTION
In recent years, intrusion detection techniques have been extensively studied. Traditionally, Intrusion Detection Systems (IDSs) are divided into two categories, namely signature-based (or misused-based) detection and anomaly-based detection. Signature-based detection maintains a database of signatures. It looks for specific signatures in incoming traffic and compares them with the one in the signature base. When a match is found, it raises an alert. Signature-based detection has high accuracy rate with a low false positive rate in detecting known attacks. However, it is incapable of detecting unknown (i.e. zero-day) or polymorphic attacks (i.e. the variants of the attack) for which the signatures are not yet available and not included in the signature base. Anomaly-based detection has attracted the attention of many researchers [1-4], and it overcomes the weakness of signature-based IDSs in detecting novel attacks and many variants of such attacks. Firstly, an anomaly-based detection creates a base-line profile of normal network traffic.
Then it compares an incoming traffic profile against the normal traffic profiles. A significant deviation from the normal traffic profiles is identified as an attack.
Machine learning techniques have been widely used in detecting network anomalies because machine learning can construct models automatically based on the given training data. Machine learning techniques have achieved good performance on anomaly-based detection systems. Some typical methods used in network traffic anomaly detection include Bayesian networks [5], support vector machine [6], artificial neural network [7], fuzzy logical [8], genetic algorithm [9], decision trees [10]. Even though machine learning techniques obtain good results on anomaly-based detection, they encounter relatively high false positive rates due to correlations between traffic records or features are ignored or less used.
However, some recent work presented in scholarly literature has suggested multivariate correlation analysis for traffic features extraction. Yu et al. [11] proposed a scheme to discriminate Distributed Denial of Service (DDoS) attacks from flash crowds by analysing the flow correlation coefficient among suspicious flow. Tavallaee M et al. [12] proposed an anomaly detection scheme using the correlation information contained in groups of network traffic samples. The main idea is to compare the signs in the covariance matrix of a group of sequential samples with the signs in the covariance matrix of the normal data obtained during the training process. Jin et al. [13] constructed a covariance feature space. The correlation differences of sequential samples are utilized for identifying network attacks. The approach improved detection accuracy. It is, however, vulnerable to any attack which is a linear change of features. Such that Tan et al. [14, 15] suggested to extract
the correlative information between features using triangle area. The approach proposed in [14] is summarised as follows.
Given an arbitrary data set X ={ , , , }x x1 2 xn , where
1 2
{ ,i i, , i}
i m
x = f f f , (1≤ ≤i n) represents the i-th m -dimensional traffic record. First, the vectorxi is projected on a
2-Dimensional (2D) Euclidean subspace [ ,i i T]
j k
f f ,
(1≤ ≤j m,1≤ ≤k m j k, ≠ ). Then, the area of trianglef Ofji ki
(O is the origin) is calculated, which is (| | | i|)/2 k i
j f
f × . So, in the vector xi , the correlation between
i j f and i k f can be expressed by (| | | i|)/2 k i j f
f × . To make a complete analysis, all possible combinations of any two features are computed.
With this approach, however, feature correlation information may be partially lost due to the fact that given any single feature with the value zero in a pair, the size of such a constructed triangle area is zero. Therefore, this issue has an unneglectable impact on detection accuracy.
In fact, the correlation of two features can be represented by any polynomial of them, such as i i
j k f ×f , i k i j f f + , i k i j f f − , i k i j f f / , and ( )i 2 i j k
f + f . It is worth noticing that the size of a triangle area formed by fji and fki equals to half of the
magnitude of the outer product of vectors [fji, 0]T and [0, fki]T
on 2D Euclidean subspace [ ,i i T]
j k
f f . Theoretically, the feature correlation extraction approach suggested in [14] can be improved by taking these forms of polynomial into account. Based on afford-discussion, in this paper, we proposed an approach using polynomial expression for feature correlations.
The rest of this paper is organised as follows. Section II proposes a polynomial expression of feature correlation method. Section III describes intrusion detection mechanism based on Mahalanobis distance. Section IV presents experimental results. Finally, the computational complexity of our proposed intrusion detection system is analysed in Section V, and Section VI concludes the paper with future works.
II. FEATURE CORRELATION ANALYSIS
The behaviour of network attack traffic is different from that of normal traffic. These differences can be reflected by statistical properties. In this section, we propose a new approach to reveal feature correlation using different forms of polynomial. The detailed approaches are presented below.
Given an arbitrary data set X ={ , , , }x x1 2xn , where
1 2
{ ,i i, , i}
i m
x = f f f , (1≤ ≤i n)represents the i-th m-dimensional traffic record. The correlation of any two features fjiand fkiin
the vector xi can be shown by a polynomial. For instance, i k i j f f × , i k i j f f + , i k i j f f − , i k i j f f / or i k i j f f )2+ ( . Moreover, considering the fact of equality status between features, a feature whose value could be zero or possible negative after subtraction, we choose ki i j
f
f
×
or ki i jf
f
+
to present feature correlation. If ki i j ff × is used, the correlations between features can expressed by
)
1
(
2 1 2 2 2 1 2 1 2 1 1 1
⋅
⋅
⋅
⋅
⋅
⋅
⋅
⋅
⋅
i m i m i i m i i m i m i i i i i i m i i i i if
f
f
f
f
f
f
f
f
f
f
f
f
f
f
f
f
f
For simplification,f
ji×
f
ki is denoted byi jk
p
. Then, (1) is now shown as 11 12 1 21 22 2 1 2(2)
i i i m i i i m i i i m m mmp
p
p
p
p
p
p
p
p
In the same way, if kii j
f
f
+
is used to present the feature correlation and denoted asa
ijm, the correlation between features can be shown as)
3
(
2 1 2 22 21 1 12 11
i mm i m i m i m i i i m i ia
a
a
a
a
a
a
a
a
Clearly, (1), (2) and (3) are symmetric matrices along their main diagonal, and the elements on main diagonal are insignificant in revealing the correlations between features. So, one only needs to consider either the lower triangles or the upper triangles of these matrices.
Given the correlations between features are presented by
i k i
j f
f × , the vector xithe correlations between i j
f and i k
f can be shown as the following matrix
21 1 2 0 0 0 0 0 (4) 0 i i i m m p p p
in which the elements in the upper triangle and on the main diagonal are not considered and set to zeros. This matrix can then be transformed into vector (5).
21 1 32 2 1
[
]
i i i i i i
l m m mm
P
=
p
p p
p
p
− (5) For data setX ={ , , , }x x1 2xn , the multivariate correlations can be presented by]
,
,
,
[
1 2 n l l lP
P
P
X
=
(6)In the same way, if the feature correlations are presented by fji+fki, the corresponding matrix is
]
,
,
,
[
1 2 n l l lA
A
A
X
=
(7) If the feature correlation is expressed by kii
j
f
f
×
, the difference in feature correlation between our proposed method and triangle area method in [14] is constant coefficient , which is ½ and it does not affect the detection performance. Therefore, the computation of the feature correlation can be reduced if triangle areas is replaced with kii
j
f
f
×
. Since the replacement reduces only the computational complexity and causes no impact on detection performance, kii
j
f
f
×
will not be examined in the following sections.III. DETECTION MECHANISM
A. Normal traffic profile
A normal traffic profile is generated using purely legitimated network traffic records. After a normal traffic profile is established, abnormal network traffic can be detected by evaluating a new incoming traffic against the normal traffic profile, which presumably represents normal network traffic.
Now we introduce the processing of normal traffic profiles. First, feature correlations between features of n normal training samples are computed. According to feature correlation analysis in section II, the lower triangle matrix of i-th sample can be expressed by the following vectors
, , , , , ,
21 1 32 2 1
[
]
nor i nor i nor i nor i nor i nor i
l m m mm
P
=
p
p
p
p
p
−For data set Xnor=[x1nor,x2nor,,xnnor], we have
]
,
,
,
[
,1 ,2 nor,n l nor l nor l norP
P
P
P
=
(8) In order to compute the covariance matrix of features, we consider the matrix given in (4). Firstly, for any nonzero elementsp
j k andp
st in (4), we compute their expectations over n normal training samples respectively, they are
= ==
=
n i i nor st p n i i nor jk pn
p
norn
p
st nor jk 1 , 1 ,,
1
1
μ
μ
(9) According to the definition of covariance, the covariance between two elements in (5) over n normal training samples is, , 1 1 cov( , ) ( )( ) 1 nor nor jk st n
nor nor nor i nor i
jk st jk p st p i p p p p n = μ μ = − − −
(10)Therefore the covariance matrix of features is
21 21 21 31 21 , 1
31 21 31 31 31 , 1
, 1 21 , 1 31 , 1 , 1
cov( , ), cov( , ), cov( , )
cov( , ), cov( , ), cov( , )
cov( , ), cov( , ), cov( , )
− − − − − − =
nor nor nor nor nor nor
m m
nor nor nor nor nor nor
m m
nor nor nor nor nor nor
m m m m m m m m p p p p p p p p p p p p Cov p p p p p p (11)
Mahalanobis distance is used to measure the similarity between two vectors. When measuring the similarity, Mahalanobis distance takes the cross correlation between different variables into consideration [16]. The smaller the Mahalanobis distance between two vectors is, the higher similarity they have.
The Mahalanobis distance between
p
lnor,i andp
lnor is denoted by, ( , ) 1( , )
nor i nor i nor T nor i nor
l l l l MD = P −P Cov− P −P (12) where , 1 1 n nor nor i l l i P P n =
=
. Therefore, normal traffic profiles can be described by
= = n i i nor MD n 1 , 1 μ ,(
,)
21
1
μ
σ
−
−
=
MD
norin
. (13)Similarly, for an incoming traffic, we can compute the Mahalanobis distance between features using (14).
1
( ) ( )
new new new T new new
l l l l
MD = P −P Cov− P −P
(14)
B. Attack Detection
Mahalanobis distance is used to measure the similarity between the normal traffic profiles and the incoming network traffic profiles. The threshold is set to distinguish intrusion behaviour from normal traffic. The threshold is set to
1 , 2
w = −μ ασ w = +μ ασ (15) Where, μ and σ are the expectation and variance of normal traffic respectively, α usually ranges from 1 to 3. For a normal distribution, the possibility of traffic falling into the interval (μ −ασ,
μ
+ασ
) varies from 68.26% to 99.73% by varyingα
from 1 to 3. In experiments discussed in Section IV, the threshold was varied from 1 to 3 with an increment of 0.5.If the value of
MD
new falls in the range of2
1 MD w
w ≤ new≤ , the new traffic is considered as normal,
otherwise an attack.
IV. EXPERIMENT RESULTS AND ANALYSIS
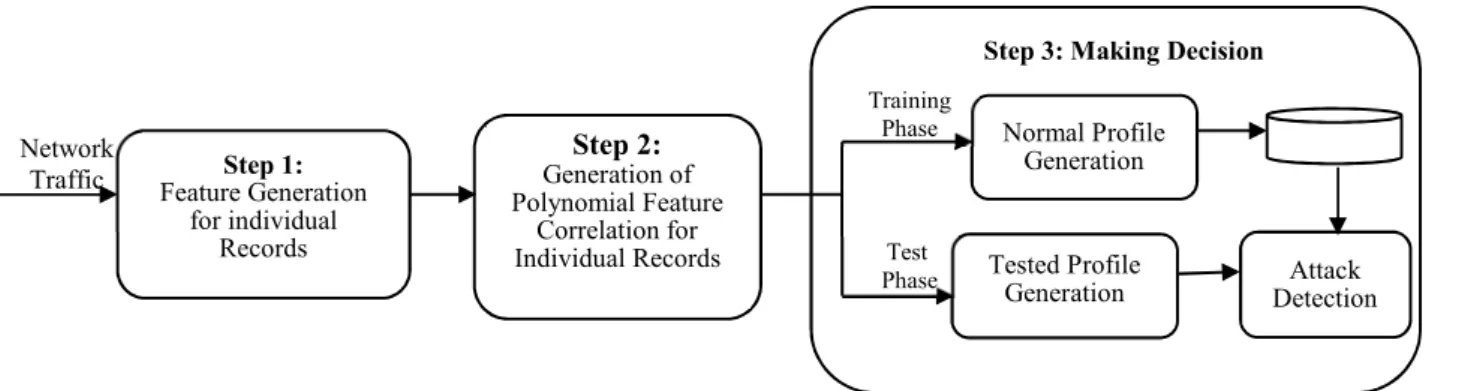
The complete framework of our proposed intrusion detection system has three steps as shown in Fig.1. In step1, basic features are generated from network traffic packets captured at the destination network to reduce the overhead of detecting malicious activities. These features are used to construct records describing statistics characteristic for a well-defined time interval. In step 2, feature correlation for individual records is generated by a polynomial method, which is used to extract correlation information between features. Network intrusion behaviour can cause changes to these correlations. So attacks can be detected according to the changes of features correlation information. In step 3, an anomaly-based detection mechanism is used in making decision. Training and test phases are included in this step. In training phase, pure legitimate traffics are used to generate normal profiles, and they are stored in a data set.
Fig.1. Framework of the proposed intrusion detection system
In test phase, a tested profile is generated for incoming traffic. Then the tested profiles are compared with the normal profiles which are stored in the dataset. If the Mahalanobis distance between them is larger than the threshold, the incoming traffic is considered as an attack, otherwise, it is considered as a normal traffic.
In order to evaluate the effectiveness and measure performance of our proposed intrusion detection system, we conducted experiments using KDD Cup 99 data set. Though the data set is criticised for its redundant records and simulation artifacts, researchers have widely used KDD Cup 99 to evaluate new methods for anomaly detection. Thomas et al.
have justified the use of this dataset in IDS evaluation [17]. In our experiments, we used the 10% labelled subset of KDD Cup 99 data set. DoS attacks (Back, Land, Neptune, Pod, Smurf, Teardrop attacks) are detected. A cross-validation is conducted on the dataset to evaluate the detection performance.
A. Traffic characterization of polynomial correlation
In KDD Cup 99 data set, there are 41 features, of which 9 are discrete and 32 are continuous. Feature correlations were extracted from the 32 continuous features. These feature correlation matrices of several types of traffic are visualised and shown in Fig. 2. These matrices illustrate the feature correlations of normal TCP, Land and Smurf attack traffic.
As illustrated in Fig. 2, the feature correlations of each type of traffic are presented using a pair of figures, which show the triangle-area-based correlation matrix and addition-based correlation matrix respectively. In Fig.2, nz stands for non-zero element, whose value indicates the number of non-zero elements in a matrix.
Moreover, as shown in Fig. 2, the correlation matrices are symmetric along their main diagonal. The non-zero elements in the addition-based correlation matrices (b), (d) and (f) outnumber those in the corresponding triangle-area-based correlation matrices (a), (c) and (e). This demonstrates empirically that the proposed addition-based feature correlation approach results in less information loss in comparison with triangle-area based approach.
Further, when the feature correlation is expressed by the addition, such as (fji)2+ fki, their correlation matrix shows the same pattern as their counterpart of addition-based
correlation (fji+ fki). This is because the numbers of non-zero elements are same in both cases.
(a) Triangle-area-based correlation (b) Addition-based correlation Normal TCP record
(c) Triangle-area-based correlation (d) Addition-based correlation Land attack record
(e) Triangle-area-based correlation (f) Addition-based correlation Smurf attack record
Fig. 2. Matrix visualization of feature correlation of Normal TCP attack, Land, and Smurf attack records.
Step 1: Feature Generation for individual Records Step 2: Generation of Polynomial Feature Correlation for Individual Records Normal Profile Generation Tested Profile
Generation Detection Attack Step 3: Making Decision
Network Traffic Training Phase Test Phase
B. Detection Performance and Analysis
To evaluate the detection performance of our proposed IDS, 10-fold cross validation was used. In 10-fold cross validation, samples are randomly partitioned into 10 equal sized data sets. Of the 10 data sets, a single data set is retained as the validation data for testing the model, and the remaining 9 data sets are used as training data. The cross-validation process is then repeated 10 times (ten folds), with each of the 10 data sets used exactly once as the validation data. The advantage of this method over repeated random sub-sampling is that all observations are used for both training and validation, and each observation is used for validation exactly once.
The detection performance comparison of our proposed IDS is shown in Table 1. In Table 1, TrA denotes the triangle-area-based approach [14], and ADD denotes the proposed addition-based approach.
Table 1 shows that both approaches could achieve approximately a 99.88% Detection Rate (DR) on normal traffic. The ADD could detection all the attacks. However, the TrA only achieved 100% DRs on Back and Smurf attacks. For Neptune and Pod, the TrA could detect close to 100%, but the DR on Land drops drastically from 91.43% to 80.48% along the increase of the threshold. The possible reason is that, if the features whose values are zero multiply the features whose values are not zero, the results are zero. So when feature correlation expressed by a triangle area method, part of the correlation information is lost. This leads to some attacks go un-detected.
TABLE 1.DETECTION PERFORMANCE (%) COMPARISON BETWEEN TRIANGLE- AREA-BASED FEATURE CORRELATION AND ADDITION-BASED FEATURE
CORRELATION AGAINST DIFFERENT THRESHOLDS
Table 2 shows the comparison between the overall detection accuracy of the TrA approach and that of the ADD approach against different thresholds. The values of the evaluation metrics, namely DR, False Positive Rate (FPR) and accuracy, were computed for all attacks regardless their types.
TABLE 2.ACCURACY (%) COMPARISON BETWEEN TRIANGLE-AREA-BASED FEATURE CORRELATION AND ADDITIONAL-BASED FEATURE CORRELATION
AGAINST DIFFERENT THRESHOLDS
1σ 1.5σ Thresholds 2σ 2.5σ 3σ
TrA ADD TrA ADD TrA ADD TrA ADD TrA ADD
FPR 0.12 0.13 0.11 0.13 0.11 0.13 0.11 0.13 0.11 0.13 DR 99.99 100 99.99 100 99.99 100 99.98 100 99.98 100 Accuracy 99.94 99.94 99.94 99.94 99.94 99.94 99.93 99.94 99.93 99.94
The overall DR of the TrA shown in Table 2 varies from 99.98% to 99.99%. However, the DR of ADD remains steady at 100% along with the change of the threshold. For both the TrA and the ADD, the accuracy stays around 99.94% for all cases.
To provide a fair evaluation, the proposed ADD-based IDS is compared not only with our previous research work [14], but also with two other state-of-the-art detection approach, namely, triangle-area-based nearest neighbours approach [18], based on Euclidean distance map approach[19] .
The DR and FPR for DoS attacks of these four IDSs are shown in Table 3 respectively. As it can be seen from Table 3 that, our proposed addition-based IDS achieved the best results on KDD Cup 99 data set with a 100% DR and a 0.13% FPR, which is better than Triangle-Area-based correlation approach. Although the other two IDSs could achieved above a 99% DR, their FPR on the same evaluation data was far much higher.
TABLE 3.PERFORMANCE COMPARISON WITH OTHER DETECTION APPROACH
The Proposed IDS (Threshold=1σ) Triangle Area Based Nearest Neighbours Approach [18] Approach Based on Euclidean Distance Map [19] Triangle-Area -Based Correlation Approach [14] (Threshold=1σ ) FPR 0.13% 2.99% 2.08% 1.26% DR 100% 99.27% 99.96% 99.97%
V. COMPUTATIONAL COMPLEXITY ANALYSIS
In this section, an analysis is conducted on the computational complexity of our proposed approach. For a traffic record with m features, operations are involved in each computation of a complete feature correlation extraction for both triangle-area-based and addition-based approaches with the data set. Therefore, the computational complexity of feature polynomial expression isO m( 2)
. Being worth noticing that the feature correlation matrix is a symmetric matrix and the elements along the main diagonal of the matrix are zeros. The time for computation can be reduced by more than 50% when it is put into practice. However, the computational complexity cannot be reduced.
In the process of making decision, the Mahalanobis distance between the incoming traffic profile and the normal traffic profile needs to be calculated to evaluate the dissimilarity between them. As Mahalanobis distance incurs a complexity of O(M2) , where M=m m( −1) / 2
and is the dimension of i
l
P
, the computational complexity of Mahalanobis distance becomesO m( 4).
Therefore, when taking the computational complexity of feature correlation extraction and making decision into account, the overall complexity of our proposed intrusion detection system becomes O m( 2) O m( 4) O m( 4)
+ = . However, in
this work, m is a fixed number (m=32). So, the computational complexity of our proposed approach is O (1).
From the above analysis, the proposed approach does not change the complexity in [14]. The computational complexity of two state-of-the-art detection systems is shown in Table 4. In triangle area based nearest neighbours approach, l is the
Type of Records
Thresholds
1σ 1.5 σ 2 σ 2.5σ 3 σ
TrA ADD TrA ADD TrA ADD TrA ADD TrA ADD
Normal 99.88 99.87 99.89 99.87 99.89 99.87 99.89 99.87 99.89 99.87 Back 100 100 100 100 100 100 100 100 100 100 Neptune 99.99 100 99.99 100 99.99 100 98.16 100 98.16 100 Land 91.43 100 84.76 100 81.43 100 80.95 100 80.48 100 Pod 99.55 100 99.47 100 99.47 100 99.32 100 99.32 100 Smurf 100 100 100 100 100 100 100 100 100 100 Teardrop 100 100 100 100 100 100 100 100 100 100
number of clusters used in generating triangle areas, and n is the number of training samples. The detailed computational complexity analysis of this approach can be found in [14].
TABLE 4. COMPUTATIONAL COMPLEXITY OF DIFFERENT DETECTION APPROACHES The Proposed Approach Triangle Area Based Nearest Neighbours Approach [18] Approach Based on Euclidean Distance Map [19] Triangle-Area -based Correlation Approach[14] O(1) O(l2n2) O(1) O(1)
VI. CONCLUSIONS AND FUTURE WORK
In this paper, we proposed an anomaly-based detection mechanism using polynomial feature correlation technique. Compared with triangle area method, our approach is intuitive and simple without losing correlation information between features. Moreover, polynomial form is easy to be changed for observing the role of some features. Evaluations were conducted using the KDD CUP 99 data set to verify the effectiveness and performance of our proposed detection method. Experimental results show that our approach has high detection rate while maintaining very low false positive rates. We also analysed the computation complexity of our proposed method. As a part of our work in the future, we will test our detection system with real-world traffic.
ACKNOWLEDGMENT
This work is supported in part by the Natural Science Foundation of Hebei Province (No. F2015205157, No.F2016205023), Foundation of Hebei Province Educational Department (No. SLRC2017042), National Natural Science Foundation of China (No.61572170), Science Foundation of Hebei Normal University (No. L2017B18).
REFERENCES
[1] V. Chandola, A.Banerjee, and V.Kumar, “Anomaly detection: a survey,” ACM Computing Surveys, vol.41, no.3, pp.1–58, 2009.
[2] Y.Pan and X. Ding, “Anomaly based web phishing page detection,” Proceedings of the 22nd Annual Computer Security Applications Conference (ACSAC'06) ,pp.381–392, 2006.
[3] P. García-Teodoro, J. Díaz-Verdejo, G. Maciá-Fernández, and E. Vázquez, “Anomaly-based network intrusion detection: Techniques, systems and challenges,” Computers & Security, vol.28,no.1-2, pp.18-28, 2009. [4] G. Thatte, U. Mitra, and J. Heidemann, “Parametric methods for anomaly
detection in aggregate traffic,” IEEE/ACM Transactions on Networking,vol. 19, no.2 ,pp.512-525, 2011.
[5] C. Alocious, N. Abouzakhar, H. Xiao, and B.Christianson, “Intrusion detection system using bayesian network modeling,” In 13th European
conference on information warfare and security ECCWS, pp. 223-232, The University of Piraeus Piraeus, Greece, 2014.
[6] A.H. Sung, and S.Mukkamala, “Identifying important features for intrusion detection using support vector machines and neural networks,” 2003 Symposium on Applications and the Internet, 2003. pp.209-216, 2003.
[7] B.Shah, and B.H.Trivedi, “Artificial neural network based intrusion detection system: a survey,” International Journal of Computer Applications, vol.39, no.6, pp.13-18,2012.
[8] X.D. Hoang, J. Hu, and P. Bertok, “A program-based anomaly intrusion detection scheme using multiple detection engines and fuzzy inference,” Journal of Network & Computer Applications, vol.32,no.6, pp.1219-1228, 2009.
[9] W. Li, “Using genetic algorithm for network intrusion detection,” Proceedings of the United States Department of Energy Cyber Security Group, pp. 1-8, 2004.
[10] G. Stein, B. Chen, A.S. Wu, and K.A. Hua, “Decision tree classifier for network intrusion detection with GA-based feature selection,” In Proceedings of the 43rd annual Southeast regional conference,vol. 2, pp. 136-141,2005.
[11] S. Yu, W. Zhou, W. Jia, S. Guo, Y. Xiang, et al, “Discriminating DDoS attacks from flash crowds using flow correlation coefficient,” IEEE Transactions on Parallel and Distributed Systems, vol.23,no.6,pp.1073-1080, 2012.
[ 1 2] M. Tavallaee, W. Lu, S. A. Iqbal, and A. A. Ghorbani, “A novel covariance matrix based approach for detecting network anomalies,” Communication Networks and Services Research Conference, CNSR 2008. 6th Annual. IEEE, pp.75-81, 2008.
[13] S. Jin, D.S .Yeung, and X. Wang, “Network intrusion detection in covariance feature space,” Pattern Recognition, vol.40,no.8, pp.2185-2197, 2007.
[14] Z. Tan, A. Jamdagni, X. He, P. Nanda, and P. Liu, “A system for denial-of-service attack detection based on multivariate correlation analysis,” IEEE Transactions on Parallel and Distributed Systems, vol.25, no.2, pp.447-456,February 2014.
[15] Z. Tan, A. Jamdagni, X. He, P. Nanda, and P. Liu, “Triangle-area-based multivariate correlation analysis for effective denial-of-service attack detection,” International Conference on Trust, Security and Privacy in Computing and Communications. IEEE Computer Society, pp.33-40, 2012.
[16] H. Zhang, Y. Zhou, and D. Feng, “Mahalanobis distance similarity measure based distinguisher for template attack,” Security and Communication Networks,vol. 8.no.5, pp.769-777, 2015.
[17] C. Thomas, V.Sharma and N. Balakrishnan, “Usefulness of DARPA dataset for intrusion detection system evaluation,” SPIE Defense and Security Symposium, International Society for Optics and Photonics, pp.69730G-69730G-8,2008.
[18] C.F. Tsai, C.Y. Lin, “A triangle area based nearest neighbors approach to intrusion detection,” Pattern Recognition, vol.43, no. 1, pp. 222-229, 2010.
[19] Z. Tan, A. Jamdagni, X. He, P. Nanda, and R.Liu, “Denial-of-service attack detection based on multivariate correlation analysis,” International Conference on Neural Information Processing. Springer Berlin Heidelberg,: pp.756-765, 2011.