University of South Florida
Scholar Commons
Graduate Theses and Dissertations Graduate School
6-16-2014
Diffuse Nutrient Pollution from Residential
Catchments
Melissa Rachelle Butcher
University of South Florida, [email protected]
Follow this and additional works at:https://scholarcommons.usf.edu/etd
Part of theCivil Engineering Commons,Environmental Engineering Commons, and theWater Resource Management Commons
This Thesis is brought to you for free and open access by the Graduate School at Scholar Commons. It has been accepted for inclusion in Graduate Theses and Dissertations by an authorized administrator of Scholar Commons. For more information, please [email protected].
Scholar Commons Citation
Butcher, Melissa Rachelle, "Diffuse Nutrient Pollution from Residential Catchments" (2014).Graduate Theses and Dissertations. https://scholarcommons.usf.edu/etd/5194
Diffuse Nutrient Pollution from Residential Catchments
by
Melissa R. Butcher
A thesis submitted in partial fulfillment of the requirements for the degree of Master of Science in Civil Engineering Department of Civil and Environmental Engineering
College of Engineering University of South Florida
Major Professor: James Mihelcic, Ph.D. Jeffrey Cunningham, Ph.D.
Mark Rains, Ph.D. Date of Approval:
June 16, 2014
Keywords: Nitrogen, Phosphorus, Stormwater, Urban, Water Quality Copyright © 2014, Melissa R. Butcher
DEDICATION
To all those who have loved and encouraged me, I dedicate my academic pursuit of engineering and this thesis. Mom, Dad, Michael and James, I owe a part of my success to each of you. Thank you for supporting me in all the various ways you have over the years. I appreciate every time you listened, let me cry on your shoulder and, most importantly, for believing in me the entire way. Michael, you made the journey so much easier than it would have been. Thank you for all the times you went out of your way to make my life less stressful; you are an amazing partner. Thank you for putting me on a pedestal and believing in me when I had trouble doing it for myself. James, you have been the best friend I could ask for through ups and downs. Thank you for listening, having faith in me and being so generous. Mom and Dad, thank you for your love and support; your patience and love is always a huge prop up. I will continue to strive to make you all proud and to be the best companion, friend and daughter I can be.
ACKNOWLEDGMENTS
I would like to express my special appreciation and thanks to my advising Professor, Dr. James Mihelcic. Thank you for taking me under your wing and mentoring me to success. I look forward to continuing to work with you in future years. I would also like to thank my committee members, Dr. Jeffrey Cunningham and Dr. Mark Rains. Thank you for your support of my research efforts and the efforts of the nutrient management center.
I would also like to express my gratitude to other academics and professionals who have helped and encouraged me along the way. Dr. Scott Campbell, thank you for telling me that you were proud of me when I was working on my calculus project; in that moment, those words meant more to me than I can express. Mr. Joseph Iandoli, thank you for giving me a chance. Thank you for bringing me onto your team and providing an atmosphere where I could learn and grow. Your leadership and support is, in great part, why I had the confidence to return to school for engineering. Others who have contributed to my success include: Mr. Karim Nohra, Dr. Amy Stuart, and the members and professional board of the Tampa Bay Association of Environmental Professionals. Thank you all.
This publication was made possible by EPA grant number 86556901. Its contents are solely the responsibility of the grantee and do not necessarily represent the official views of the EPA. Further, the EPA does not endorse the purchase of any commercial products or services mentioned in the publication.
TABLE OF CONTENTS
LIST OF TABLES ... iii
LIST OF FIGURES ...v
ABSTRACT ... vii
CHAPTER 1: INTRODUCTION ...1
1.1 Nitrogen and Phosphorus as Nutrients in the Environment ...1
1.2 Motivation ...5
1.3 Objectives ...10
1.4 Organizational Overview of Thesis ...10
CHAPTER 2: LITERATURE REVIEW, ANALYSIS, RESULTS, DISCUSSION ...14
2.1 Literature Review ...14
2.1.1 Nutrient Species ...15
2.1.2 Stormwater Nutrient Policies and Regulations ...20
2.1.3 Urban and Residential Land Use ...21
2.1.3.1 Residential Stormwater ...22
2.1.3.2 Unique Challenges ...23
2.1.4 Diffuse Nutrients from Residential and Urban Catchments ...26
2.1.4.1 Lawns and Turfgrass ...26
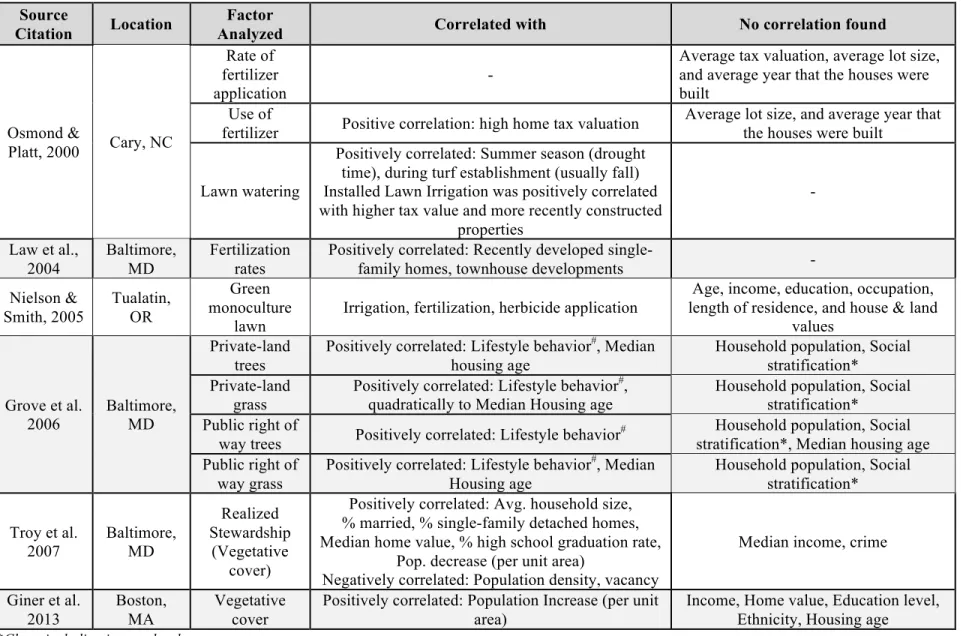
2.1.4.2 Socio-Demographic Implications on Lawn Vegetation and Management Practices ...35
2.1.4.3 Nutrients Measurements and Loadings in Stormwater ...48
2.1.4.3.1 Model Studies ...52
2.1.4.3.2 Sampling Campaign Studies ...59
2.2 Analysis...83
2.3 Discussion ...87
CHAPTER 3: CONCLUSIONS AND FUTURE RECOMMENDATIONS ...99
3.1 Current Stormwater Evaluation Practices ...100
3.2 Key Knowledge Gaps in Existing Literature ...103
3.3 Recommendations for Objectives of Future Research ...105
3.3.1 Land Classification ...105
3.3.2 Best Management Practices ...111
3.3.3 Facilitating Consistency ...114
3.3.4 Interdisciplinary Collaboration ...116
REFERENCES ...118
APPENDICES ...128
Appendix A Additional Information and Tables from the Center for Watershed Protection ...129
Appendix B Seasonal N and P Box-and-Whisker Plots ...132
Appendix C Comparison of Nutrient Pollution Studies ...134
Appendix D Compiled Fertilizer Application Rates ...142
Appendix E Importance of Protecting Coastal Estuaries ...143
Appendix F License Agreements ...145 ABOUT THE AUTHOR ... END PAGE
LIST OF TABLES
Table 1 Concentrations of Nutrient Species’ Aquatic Impact ...13 Table 2 Turfgrass Characteristics and Common Species ...30 Table 3 Mass Loss of Phosphate and Nitrate from Fertilized Plots Over Two Years ...31 Table 4 Effects of Fertilizer Application, Clipping Management on Mean Annual Flow
Weighted P Concentrations in Runoff for 2005 to 2007 ...34 Table 5 Summary of Annual Application of Elemental Phosphorus and Annual Loading
of Dissolved Reactive Phosphorus and Total Phosphorus at Northland
Country Club ...35 Table 6 Geographic Characteristics and Lawn Management of Five Communities in the
Neuse River Basin, North Carolina ...37 Table 7 Geographic and Lawn Management Characteristics of Two Watersheds in
Maryland ...38 Table 8 Geographic, Social and Fertilizer Management Characteristics of a Watershed
in Oregon ...41 Table 9 Selected Chesapeake Bay Homeowner Lawn Management Survey Results ...46 Table 10 Summary of Socio-Demographic Research of Nutrient Management of
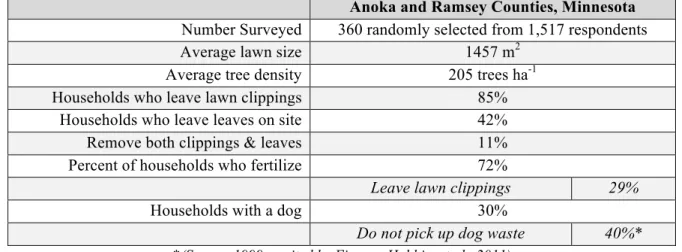
Residential Lawns ...49 Table 11 Summary of Lawn Maintenance Practices From Four US Reports ...50 Table 12 Survey Results from Randomized Sampling of Owner-Occupied, Single-
Family Houses in Minnesota ...52 Table 13 Creeks Sampled in Hobcaw Barony (HB) and Murrells Inlet (MI) ...60 Table 14 Mean Nutrient Concentrations in Storm Water Runoff from Eight Land
Use Types ...64 Table 15 Baltimore Catchment Characteristics and Estimated Annual Nitrate Yields ...66
Table 16 Catchment Characteristics and Stormwater Nutrient Concentration Results
for Dry and Wet Weather ...68
Table 17 Lawn Descriptions, Management Techniques and Annual Mass Nutrient Exports from Three Lawns in North Carolina ...75
Table 18 Monitored Event Load Data (kg/event) in Minnesota ...76
Table 19 Median Seasonal Nutrient EMCs in Minnesota ...76
Table 20 Comparison of Three Catchments in Oregon with Nitrate Mass Export from Three Storm Events ...77
Table 21 Characteristics and Nitrate Mass Export from Two Subdivisions ...79
Table 22 Treatment Efficiencies of Stormwater Control Devices ...91
Table 23 Suggested Documentation and Analysis Criteria for Future Research ...115
Table A.1 Lawn Care Practices: A Comparison of Nine Homeowner Surveys ...129
Table A.2 Comparison of Demographics for CWP and Chesapeake Bay Program Surveys ...130
Table A.3 Comparison of Demographics for CWP and Chesapeake Bay Program Surveys ...131
LIST OF FIGURES
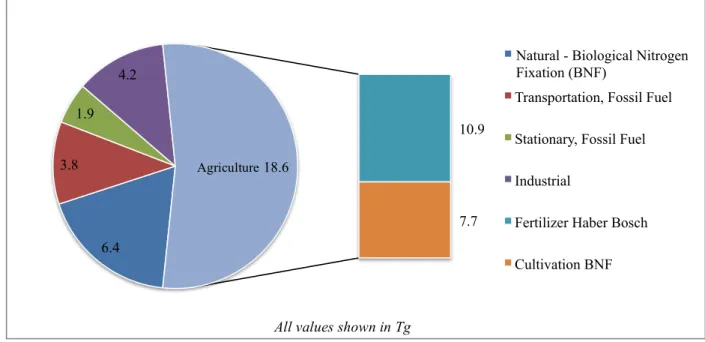
Figure 1 Reactive Nitrogen Sources by Sector in the US, 2002 ...12
Figure 2 Sources of Nutrient Pollution Entering the Chesapeake Bay ...12
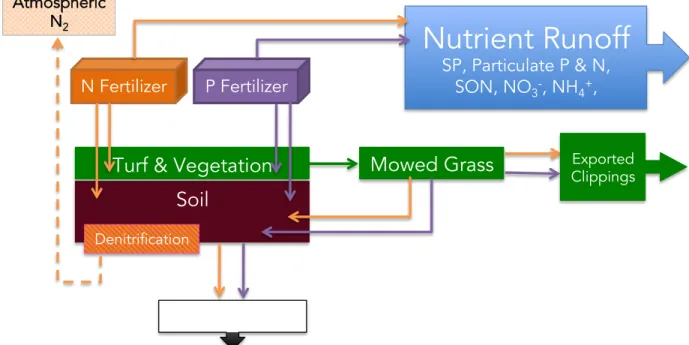
Figure 3 Selected Nutrient Cycles in a Turf Grass Ecosystem ...13
Figure 4 Distribution of Phosphate Species as a Function of pH ...19
Figure 5 Hypothetical Water Cycle Showing Potential Pathways for Nutrients to Enter Surface Waters and Groundwater ...19
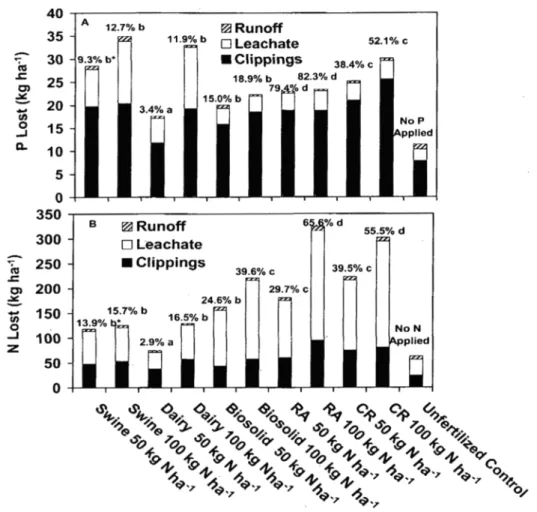
Figure 6 Mass Balance for (a) Phosphorus and (b) Nitrogen ...32
Figure 7 Summary of Fertilization and Irrigation Practices in Minneapolis-St. Paul, MN ...53
Figure 8 Average N Inputs into Modeled Households (Minnesota) ...55
Figure 9 Average P Inputs into Modeled Households (Minnesota) ...55
Figure 10 Model Method One for Carpinteria Creek Watershed for (a) Nitrate and (b) Phosphate in 2004 ...58
Figure 11 Measured vs. Predicted Annual, Wet-Season & Dry-Season Model Method Two (a) Nitrate and (b) Phosphate Loading for Carpinteria Creek Watershed in 2004 ...59
Figure 12 Average TP vs. TSS Concentrations for Five Residential Sites in Melbourne, Australia ...69
Figure 13 Nitrate Export Rates (kg ha-1 storm-1) for Three Storms in Three Study Catchments, Oregon ...78
Figure 14 Nutrient Export (1996-2004) from Traditional and LID Subdivisions ...80
Figure 15 Compilation of Average TN Concentrations (TN mg/L) Measured in Stormwater Runoff from Multiple Locations ...97
Figure 16 Compilation of Average TP Concentrations (TP mg/L) Measured in
Stormwater Runoff from Multiple Locations ...98
Figure 17 Residential Areas Distinguished by HERCULES ...107
Figure B.1 Seasonal Nitrogen Fraction Distribution Based on Creek Type ...132
Figure B.2 Seasonal Phosphorus Fraction Distribution Based on Creek Type ...133
ABSTRACT
Nonpoint source nutrient pollution is diffuse pollution lacking discrete origin and conveyance. This thesis synthesizes and critically reviews research on residential nitrogen and phosphorus loss to stormwater runoff and leaching. The evaluation pulls from research covering influential socio-demographic indicators, such as use of lawn maintenance services and
homeowner fertilizer practices. The extent to which such social and economic factors may influence the prevalence and fate of diffuse nutrients in stormwater runoff from residential areas has not been adequately established. Understanding the source and influencing factors of diffuse nutrient pollution is important in order to effectively protect surface and groundwater resources.
Research based on sampling campaigns of catchments, sampling of controlled turf systems and models of residential catchments were compiled for this review. Based on the compilation reviewed for this thesis, there are wide differences in approaches researchers have taken to attempt to quantify and understand diffuse nutrient pollution from residential and urban areas. There is not consistency in the chemical nitrogen or phosphorus species evaluated or in reported measurements (i.e. concentration vs. loading vs. yield).
This review revealed several important knowledge gaps. Determination of correlation between residential system nutrient loss to the environment and social factors, demographic characteristics, local fertilizer ordinances or nutrient management education programs has not been substantiated. More exploration of nutrient leaching from different soil types and turf grass species is needed to develop a complete understanding of nutrient loss from turf grass systems. Further, other specific management practices such as leaving grass clippings on lawns has not
been studied in depth for a variety of soil types and grass species. There is room for
improvement in future research and additional studies are needed to guide future policy and implementation of best management practices. Based on these and other findings, I recommend a concerted effort to standardize a portion of the reporting details of future stormwater research and for reevaluation of nutrient/fertilizer education efforts.
CHAPTER 1: INTRODUCTION
Water issues currently faced by society are many in number and varied in scope and complexity. Researchers and water managers continue to face quantity and quality issues amidst new challenges, such as emerging pollutants. Combined, these challenges emphasize the
importance of recognizing that no water should be polluted and cast aside; the entire hydrologic cycle is connected and all water resources are important. The obstacle addressed in this research is that of stormwater quality from residential areas, with a particular focus on nonpoint source nutrient pollution. Nutrients (nitrogen and phosphorus specifically) arise from multiple sources. One of the most potent nonpoint nutrient pollution sources is fertilizer, considered a nonpoint source due to its lack of discrete origin and conveyance. This is an important environmental topic to address because of the 67 million pounds of fertilizer applied by homeowners annually in the US, 40 to 60% of the fertilizer nitrogen ends up in surface and groundwater, while homeowners are attempting to achieve the look of the idealized highly manicured monoculture turf lawn (Welker & Green, 2004 [EPA], values from Congressional Hearings). Current water quality experts recognize historic and potential future impacts of these practices, which include the potential of acute water quality degradation.
1.1 Nitrogen and Phosphorus as Nutrients in the Environment
Nitrogen, in various biochemical forms, is a key building block to both protein and enzymes; it can drive certain metabolic processes in living organisms, and it is a component of plant chlorophyll (Sutton et al., 2011). It can be limited in terrestrial systems as a result of poor soil quality found in high sand content soil, which negatively impacts nitrogen retention and ion
exchange. Nitrogen is often the limiting nutrient in estuarine systems; this has resulted in a comparative lack of studies on phosphorus export from coastal watersheds (Tufford, Samarghitan, Mckellar, Porter, & Hussey, 2003).
Atmospheric nitrogen (N2 gas) makes up approximately 78% of the earth’s atmosphere.
Though abundant in this form, N2 gas is not bioavailable to organisms for use in metabolic or
other processes. However, the amount of nitrogen now circulating in bio-geochemical cycles has effectively doubled in the past century, meaning that anthropogenic production nitrogen via fertilizer, crop cultivation and combustion processes approximately matches natural production (Elser et al., 2007). Prior to industrial times, the primary avenue for conversion of N2 to a
terrestrial based form was by way of living organisms that could use carbohydrate energy to reduce gaseous N2 to produce ammonia (NH4). Extreme changes in the nitrogen nutrient cycle
are a result of industrial processes, population growth and technological advances, such as the Haber-Bosch process and combustion engines’ consumption of fossil fuels (Collins et al., 2010). The reaction of the Haber-Bosch process allowed the production of ammonia fertilizer, breaking the triple molecular bond of N2 and adding four hydrogen atoms to form ammonia as follows.
!!+3!! →2!!!
Equation 1
The Haber-Bosch process provided a breakthrough in fertilizer production, and concurrent ability to significantly increase food production, which directly contributed to population increase. The process was developed in the early 19th century, at which time internal combustion engines became further refined and more widespread (Alvord, 2000). However, combustion processes release unprecedented amounts of NOx into the atmosphere (Sutton et al., 2011). According to
the EPA Science Advisory Board (2011), humans have introduced 29 teragrams (Tg) of N into US terrestrial and water environments via the Haber Bosch process used in fertilizer manufacture,
other industrial reactive nitrogen (Nr) production and biological nitrogen fixation through
cultivation and combustion. In addition, due to anthropogenic influence on the bio-geochemical cycle and its resultant harmful effects, the National Academy of Engineers named “Management of the Nitrogen Cycle” as one of the “Grand Challenges for Engineering” in 2008 (National Academy of Engineering, 2008).
Figure 1 depicts the major sources of nitrogen introduced to the US. The term reactive nitrogen (Nr) refers to characteristically mobile species and encompasses biologically active,
chemically reactive and radiatively active nitrogenous species in the atmosphere and biosphere (EPA Science Advisory Board, 2011). Movement of nitrogen in human created ecosystems is inherently inefficient, with leakage at every step (Baker, Hope, Xu, Edmonds, & Lauver, 2001). Amplified releases to the environment means increased nitrogen inputs to aquatic ecosystems. Nutrient excess in aquatic systems can lead to algal blooms; as algae decays, it depletes the dissolved oxygen (DO) that other aquatic organisms need to survive. Collectively, such damaging impacts are referred to as eutrophication; eutrophication limits water resources
usability for industry, recreation and municipal purposes (King, Balogh, Agrawal, Tritabaugh, & Ryan, 2012). Additional effects of nutrient increases can include water body acidification and loss of biodiversity.
For phosphorus, mining phosphate has altered the phosphorus cycle by unearthing and processing reserves that took millions of years to form (Filippelli, 2011). Furthermore, 95% of mined phosphorus is used to produce fertilizer for the agricultural sector (Vaccari, 2011). Much like fossil fuels, phosphorus sedimentary deposits are not renewable on the human time scale. The global phosphorus input to the biosphere has been amplified by approximately four fold compared to preindustrial times (Falkowski et al., 2000).As an important nutrient for both
animals and plant biota, this significant alteration to the bio-geochemical cycle has not occurred without environmental consequence.
Nutrients in stormwater from residential areas can be generated as a result of fertilizer application to lawn turf, animal waste (such as pet bio-waste), leaky on-site wastewater systems (e.g. septic systems), and atmospheric deposition (Carey et al., 2013). Stormwater runoff
eventually flows to surface water such as streams, lakes, rivers, estuaries and oceans. High nutrient loading in stormwater can cause eutrophication and severe impairment to water bodies causing adverse impacts to healthy ecosystems. For example, the National Estuary Program Coastal Condition Report (EPA, 2007a), which evaluated the United States and its territories, rated two regions, Puerto Rico and Northeast Coast, at a “poor” overall condition and two large regions, Gulf Coast and West Coast estuaries, below fair. These assessments comprise evaluation of water quality, sediment quality, benthic index and fish tissue contaminant index. The overall US estuary condition was declared below fair. Specifically, approximately 62% of the nation’s National Estuary Program estuaries were experiencing moderate to high degrees of
eutrophication. As coastal waters become eutrophied, sea grasses are killed off, which eliminates important nursery and feeding ground for multiple aquatic species, including various crustaceans, fish and manatees (McClelland & Valiela, 1998).
Increases in nitrogen and phosphorus inputs into groundwater have caused environmental problems as well, including induced methemoglobinemia, a form of blue baby syndrome
resulting from high nitrate concentrations in water (EPA, 2007) National Center for Environmental Health 2012). Methemoglobinemia may also occur in livestock, where the
condition interferes with both the blood’s ability to carry oxygen and fetal viability (Carpenter et al., 1998). In humans, nitrates can be reduced to nitrite; nitrite oxidizes iron in blood hemoglobin
converting it to methemoglobin, which cannot carry oxygen (Weiner, 2013). Other societal threats of nutrient pollution include: decreased air quality, greenhouse gas imbalance,
ecosystems damage, loss of biodiversity, and soil quality degradation (Sutton et al., 2011). While degradation of water bodies can be measured in terms of lost species or amenities, we
simultaneously recognize that poor water quality is linked to increased cost of treating water for both potable and non-potable use (Carpenter et al., 1998).
Recent decades have seen a reduction of nutrient inputs to surface waters, in great part, as a result of reduction in nutrient point discharges from centralized wastewater treatment effluent. As the point source contribution of nutrients to stormwater and surface water has decreased, the overall percentage of nonpoint contribution of nutrients has increased (Davies, 1995). Diffuse nutrient pollution sources are, however, many and varied. This thesis attempts to elucidate factors that impact concentration and loading of the nutrients, nitrogen and phosphorus, from residential areas and lawns. This should be helpful to guide future research on understanding and reducing diffuse nutrient loading to water bodies.
1.2 Motivation
The word “urbanization” is generally understood to mean an expansion of urban area along with a growth in the number of people living in and around urban regions. Today, it is accepted as a trend in globalization (Pickett et al., 2007). Almost half of the world population and 80% of the US population reside in urban areas; it is expected that 60% of the world population will live in an urban area by 2030 (Burns et al., 2005). Such growth necessitates housing development, which may come in the form of high-density residential areas near urban centers, low-density, primarily single-family housing further away from urban centers or any number of variations in between. Currently, there is not a US or global standard for categorizing
urban or residential land use based on housing, population or vegetation density (Hitt, 1994). While proposed classification systems are available (e.g. Anderson, Hardy, Roach, & Witner, 1976), none of the research reviewed in this work showed consist utilization of any particular classification tool (Cadenasso, Pickett, & Schwarz, 2007).
As precipitation occurs on impervious surfaces and rainfall exceeds the capacity of soils to absorb (whether due to exceeding storage capacity or intensity of the rainfall event), runoff occurs. Combined with impervious surfaces, in urban and residential areas stormwater is produced. Impervious surface decreases infiltration, increases runoff and shortens the time for which runoff does occur (Brezonik & Stadelmann, 2002). Runoff from urban and residential areas carries nonpoint source nutrient pollution. The extent of potential anthropogenic
contribution to nutrient pollution is emphasized in figure 2; these charts enunciate urban impacts to the Chesapeake Bay. Although, it is not currently known what portion of urban anthropogenic nutrient pollution is made up of residential nonpoint sources, lawn fertilizer has the potential to be a major contributor.
The US Department of Agriculture has conducted land use pattern change analyses to account for the primary uses of public and private lands in the US (Nickerson, Ebel, Borchers, & Carriazo, 2011). The 2007 report showed that urban land acreage quadrupled from 1945 to 2007. The total urban area estimated for 2007 was 61 million acres, up nearly 2 percent since 2002 (as cited by Nickerson et al., 2011). Such increases in impervious area necessitate a corresponding development of stormwater management and treatment. Implications for growth in urban and residential areas remain. Residential development and urbanization converts regions previously undisturbed (forests, shrublands and deserts) into an entirely different ecosystem with high impervious surface and complicated networks of storm, sanitary and water supply pipes,
sometimes referred to as “urban karst” (Janke et al., 2013). Urban and residential development modifies hydrology by the implementation of “urban karst”, entombment of streams and further hydrologic alteration as a result of aging, leaky infrastructure (Janke et al., 2013). Residential areas make up a large component of urban space; its associated water infrastructure (and the various conditions and ages different regions have) play a significant role in watersheds’ hydrologic behaviors (Hammer, Stewart, Winkler, Radeloff, & Voss, 2004). Compared to pre-development, it is widely acknowledged that urban and residential development influence stormwater runoff characteristics in many ways, such as (Burns et al., 2005):
• Decreased groundwater recharge
• Increased surface water runoff • Greater magnitude of peak runoff
• Shorter lag time between rainfall onset and runoff response
Rainfall intensity and timing can also influence the amount of nutrients that are released by lawns, dislodged from impervious surfaces and carried away via overland flow and
stormwater. Nutrients carried by these storm events can have important implications for nearby aquatic health. Table 1 shows various concentrations at which some nutrients begin to disrupt aquatic ecosystems.
Due to high percentage of impervious surface coverage, stormwater management is essential to flood management. In the context of residential areas in the US, storm drains are a common community feature. Results from surface stormwater runoff research vary considerably, however, most show surface stormwater runoff to contain high concentrations of nutrients from nonpoint sources (Janke et al., 2013). As such, stormwater control measures often target nutrient removal (Janke et al., 2013). The need to estimate nonpoint source loading for effective
watershed management has driven a variety of research efforts in stormwater monitoring and modeling (Brezonik & Stadelmann, 2002). Some researchers have evaluated households as systems with flux of nutrients coming in and out. Such modeling efforts in the US upper Midwest revealed that approximately 25% of household nitrogen flux occurs through the lawn (Fissore, Baker, et al., 2011).
In 1997, the USDA stated that if lawns were classified as a crop, they would rank as the country’s 5th largest crop on the basis of acreage covered (Nielson & Smith, 2005). Nitrogen and phosphorus are the main constituents of commercial fertilizers at risk for leaching into
stormwater runoff and causing water quality problems (EPA Science Advisory Board, 2011). This phenomenon can be more pronounced as a result of over-fertilization or fertilizer applied during the incorrect season for optimal absorption. This research focuses on nutrients associated with residential lawn management such as fertilizer application, factors affecting fertilizer application, and subsequent impacts. Nitrogen concentrations in stormwater from urban areas can also be highly variable, but researchers have found that loadings are always greater from urban areas, compared to undisturbed natural regions (Collins et al., 2010). Evaluation of associated best management practices are merited as a result of such nutrient concentrations entering open water bodies.
Approximately 50% of turfgrass is estimated to not be fertilized, while the remainder is fertilized at different intensities (EPA Science Advisory Board, 2011). However, in some regions of the United States, fertilization of lawns can be a dominant source of nitrogen (EPA Science Advisory Board, 2011). Turfgrass, generally referring to a group of grass species used for lawns and golf courses, typically requires concerted management in both fertilization and intense watering (King, Balogh, & Harmel, 2007; Shore, Delgado, Totten, & O’Leary, 2014). King et al.
(2007) found that nitrate and dissolved reactive phosphorus exiting a managed turfgrass area to be significantly greater than those entering. This implies that current turf management practices are not successful in nutrient management.
Despite protection offered by the Clean Water Act, eutrophication due at least in part to excessive nutrient loading, is one of the most pervasive causes of water quality impairment in the US (EPA, 2012b). If adequate light is available, N and P are the limiting factors for growth of phytoplankton in aquatic environments; in coastal areas, nitrogen is often the limiting nutrient while phosphorus is often the limiting nutrient in fresh water (Florida LAKEWATCH, 2000; Howarth et al., 2000). Noted eutrophication impacts include: phytoplankton growth, macrophyte growth, benthic and epiphytic algae growth, gelatinous zooplankton growth, toxin release (from harmful algal blooms [HAB]), reduced carbon availability to food webs, loss of habitats, loss of coral reefs, loss of sport fisheries, odor problems and loss of recreational and aesthetic water use. (Badruzzaman, Pinzon, Oppenheimer, & Jacangelo, 2012)
Eutrophication in salt waters causes algal blooms, which can hinder light penetration over large regions of water (Bricker et al., 2007). This results in the inability of aquatic plants to thrive, destroying both habitat for small marine animals and eliminating the food source of other animals. Eutrophication in freshwater bodies can result in impaired fisheries, inability to use water for recreational purposes, and induced oxygen shortage (Bricker et al., 2007). Further, some algae growth can induce formation of carcinogens when impaired water is processed through conventional drinking water treatment processes (Sharpley, Mcdowell, & Kleinman, 2001).
The EPA has instigated multiple initiatives in attempt to prevent nutrients from ending up in stormwater runoff. Federal Water Pollution Control Act and the Clean Water Act have
effectively reduced pollution from point sources from both industrial and municipal discharges (Davies, 1995). Nonprofit organizations, such as the Chesapeake Bay Program and the Tampa Bay Estuary Program, serve both to further research on watershed protection and act as
advocates for sound water protection policy.
1.3 Objectives
The overall objective of this thesis is to synthesize existing literature and available data to evaluate concentration or loading of nitrogen and phosphorus associated with stormwater that originates from residential lawn management. Towards that overall objective, I specifically aim to: (1) explore and assess current practices in the evaluation of stormwater nutrient water quality, (2) identify key knowledge gaps in the existing literature, (3) propose specific objectives for future research that could contribute to alleviation of impacts from diffuse nutrient pollution, and (4) determine if any research has successfully linked nutrient loading to specific nonpoint source influences at a fine scale (i.e. at the scale of an individual household, versus an overly broad group of behaviors, such as “residential activities”).
The results of this thesis should aid in assessing impacts of nutrients in stormwater runoff from residential areas. Results of this thesis will also elucidate how factors such as geography or the socio-demographics characteristics of homeowners may affect nutrient concentrations and/or loadings to stormwater from residential locations. Moreover, it is important to have an
understanding of limitations to current residential lawn management practices in order to successfully implement or change best management practices (BMPs).
1.4 Organizational Overview of Thesis
This introductory chapter is followed by two chapters. Chapter 2 provides the literature review, analysis, results and discussion. That chapter explores nutrient cycles, aquatic nutrient
policies and regulations, characterization of urban and residential stormwater,
socio-demographic factors influencing lawn management practices and concentrations/loadings of nutrient and phosphorus from residential regions. Through the critical literature and review of existing research, I attempt to connect and analyze nitrogen and phosphorus concentrations/ loadings in stormwater from residential or primarily residential areas to potential specific socio-economic influences. Further, the review allowed for identification of factors that may improve or decrease the success of fertilizer and lawn management practices. It contributes to the current body of scientific knowledge by addressing the initial need to develop understanding of diffuse nutrient sources such that truly sustainable BMPs of residential stormwater controls for nutrient treatment use may be advanced.
Chapter 3 entails major findings, conclusions, recommendations for future research and additional considerations. In the final chapter, I explore important implications of this research, recommendations for BMPs in urban and residential areas and I present a set of guideline recommendations for future researchers to use when pursuing sampling campaigns and evaluations of nutrients from such regions.
Figure 1 Reactive Nitrogen Sources by Sector in the US, 2002 (Adapted from EPA Science Advisory Board, 2011)
Figure 2 Sources of Nutrient Pollution (Nitrogen on Left, Phosphorus on Right) Entering the Chesapeake Bay (adapted from EPA, 2010)
6.4 3.8 1.9 4.2 10.9 7.7 18.6
Natural - Biological Nitrogen Fixation (BNF)
Transportation, Fossil Fuel Stationary, Fossil Fuel Industrial
Fertilizer Haber Bosch Cultivation BNF 17% 26% 21% 36% Natural Crops Livestock Atmospheric Deposition Urban and Population Related 3% 19% 26% 52% Natural Crops Livestock Atmospheric Deposition Urban and Population Related All values shown in Tg
Table 1 Concentrations of Nutrient Species’ Aquatic Impact
Nutrient
Species Aquatic Level Reason for concern
NH4+/NH3 > 0.5 NH3-N mg/L Significant toxicity to fish
(Weiner, 2013)
NO3- > 400 mg/L
Impacts begin to occur on growth and feeding activities of fish
(Burton & Pitt, 2002)
NO2- > 0.7 mg/L
Fish mortality begins
*Nitrite is usually oxidized to nitrate, but if aquatic conditions favor formation of nitrite, it can severely
impact aquatic species at low concentrations. (Burton & Pitt, 2002)
TP > 0.1 mg/L
Accelerated eutrophication begins at concentrations
higher than 0.1 mg/L (Weiner, 2013)
CHAPTER 2: LITERATURE REVIEW, ANALYSIS, RESULTS, DISCUSSION
Figure 3 Selected Nutrient Cycles in a Turf Grass Ecosystem (adapted from Baker, Wilson, Fulton, & Horgan, 2008)
2.1 Literature Review
Increasing amounts of impervious surface from population growth and associated urbanization has been linked with indicators such as fish species loss, changes in channel morphology, loss of benthic organisms and increased stream baseflow. Although researchers have used different measurement techniques in the past, most agree that there is a definite relationship between impervious surface and stream health; several have found the threshold of degradation value to be at approximately 10% impervious surface cover (Dietz & Clausen, 2008). Through review of research published over the past several decades that address lawns as
complex ecosystems, homeowner management trends and stormwater sampling campaigns, we
Baker&et&al.&2008
&
Soil
Turf & Vegetation
N Fertilizer P FertilizerMowed Grass
Leaching Exported ClippingsNutrient Runoff
SP, Particulate P & N, SON, NO3-, NH4+, Denitrification Atmospheric N2can begin to weave narrative for understanding a temporally and biologically complex system. The basic nutrient cycle of the ecosystem reviewed in this thesis, the residential lawn, is depicted in Figure 3. Importantly, Figure 3 highlights three pathways for nutrient losses from the turf lawn system: atmospheric, leaching and stormwater. Within residential and urban areas, nutrient pollution in leaching groundwater and stormwater will be the focus of this review.
2.1.1 Nutrient Species
There are multiple species of organic and inorganic nitrogen that can enter the
environment. The relationship among these nutrients is complex and influenced by numerous external factors such as medium, temperature and pH. Nitrogen in chemical fertilizer can be composed of multiple nitrogenous species and may include ammonia, various ammonium species, such as diammonium phosphate ((NH4)2HPO4), ammonium nitrate (NH4NO3) and
ammonium sulfate ((NH4)2SO4), nitrate species such as calcium nitrate (Ca(NO3)2) and sodium
nitrate (NaNO3) and urea (N2H4CO) (Shakhashiri, n.d.).
Four commonly used water quality measures of nitrogen are total nitrogen (TN), total Kjeldahl nitrogen (TKN), nitrite+nitrate–nitrogen (NO3- + NO2- as N) and ammonia-nitrogen
(NH4+/NH3-N) (Aryal et al., 2010). TKN is the sum of organic nitrogen plus ammonia; organic
nitrogen can be converted into ammonia through ammonification (Atasoy, Palmquist, & Phaneuf, 2006). Ammonia can be converted into nitrite via oxidation, however, nitrite is unstable and is converted quickly to nitrate (Weiner, 2013). Nitrite (NO2-) and nitrate (NO3-) anions are
extremely soluble and, therefore, able to move through soil at approximately the same rate as water; furthermore, they are nonvolatile species, meaning they are likely to persist in water until uptaked by plants or other organisms (Weiner, 2012). Nitrate is also more likely to leach during
cool, wet seasons (Burton & Pitt, 2002). Equation 1 summarizes these possible transformations of nitrogen species in the natural environment.
!"#$%&'!!!!"#$%&'($()"#*!!!!! !"#$%&'() !"#$%&#!' !!!!!! !"#$%&'() !"#$%&#!' !!!!! Equation 2 (adapted from Weiner, 2013)
The prevalence of a given nutrient species varies depending on a variety of factors influencing the soil profile: land use, water column characteristics and a watershed’s hydrologic characteristics. The primary sources of inorganic nitrogen are potassium nitrate and ammonium nitrate; these salts are used primarily in fertilizer (Weiner, 2013). Organic sources of nitrates typically discharged to the environment include domestic wastewater and livestock manure (Weiner, 2013). Fertilizer, wastewater and livestock manure all have the potential to end up in stormwater via runoff or can leach from leaky pipes if not properly managed. When stormwater ends up in stormwater control devices, N can be altered or removed in three ways:
assimilation/uptake, adsorption and denitrification. Assimilation is usually accomplished by bacteria or plants, where the pollutant becomes part of the organism’s biomass (Collins et al., 2010).
Nitrogen is most commonly the limiting component to plant growth. In soil, many
microorganisms are capable of denitrification, but few are capable of nitrogen fixation. When the natural carbon to nitrogen ratio of soil is altered, such as by fertilization or plant uptake, soil microorganism restore a balance through carbon oxidation, nitrogen fixation or denitrification. In well-aerated soils with adequate moisture, ammonium and urea are converted to nitrate.
Groundwater contamination as a result of over-fertilization is highly pronounced during heavy rain seasons, heavy irrigation and when plants are seasonally inactive (Bohn, Myer, & O’Connor,
Nitrogen losses from ecosystems can occur from forest fires and leaching through the ground (Sutton et al., 2011). Due to its mobile nature, nitrate fertilizer application that exceeds the needs of plant uptake will leach through the soil profile to groundwater sources. Subsequent losses can be influenced by rainfall, cultivation and soil management techniques. Reactive nitrogen flux in terrestrial ecosystems is influenced by soil moisture content, temperature and properties such as clay content, organic carbon content, pH and the types of vegetation growing. This is important to understand because such conditions can influence transport of nutrient species from fertilized ground. Ammonium ion (NH4+) can adsorb to soil particles as a result of a
cation exchange processes, therefore, yielding lower concentration values in seepage water (Sutton et al., 2011).
Like nitrogenous species, phosphorus can be found in both organic and inorganic (phosphates, orthophosphates, polyphosphates) forms. Phosphorus in chemical fertilizer is generally comprised of multiple phosphate species, which can include diammonium phosphate ((NH4)2HPO4) and dihydrogen phosphate (Ca(H2PO4)2) (Shakhashiri, n.d.). Common water
quality measurements include total phosphorus (TP), soluble reactive phosphorus (SRP) and biologically available phosphorus (Aryal, Vigneswaran, Kandasamy, & Naidu, 2010). Total phosphorus is the sum of particulate and dissolved phosphorus (DP). SRP is the fraction of TP available for organisms to grow (Michaud, 1991). Particulate phosphorus is of concern for other specific types of environmental research, such a limnology (Mitchell & Prepas, 1990).
In general, soil has a relatively good capacity to retain a significant amount of various phosphorus species. Researchers have attempted to devise methods for releasing unavailable phosphorus in soils or methods to prevent fixation, but have, thus far, been unsuccessful (Bohn et al., 2001). Phosphorus immobilization (fixation) is influenced by multiple factors: (1) aluminum
and iron oxides influence P retention in acidic soils (2) calcium compounds influence solubility of P in calcerous soils and (3) organic matter aids P adsorption (Novotny, 2003). Plant growth accelerates as adsorbed P levels in soil increase from 0 to approximately 25 mg/kg soil; however this phenomenon has not been well studied for cool season turf (Baker et al., 2008). Residential lawns may, in fact, have much higher concentrations than this threshold of 25 mg/kg as a result of repeated and excessive application of fertilizer (Baker et al., 2008).
Phosphorus in nature, including that which is mined to produce fertilizer, is found in a bound phosphate form. In water, phosphate exists as phosphoric acid at low pH levels and dissociates into different species as a function of pH (Figure 4). The various phosphate species that commonly occur near neutral pH readily absorb to positively charged surfaces and ions to form stable components. In fact, it has been reported that at typical soil pH levels of 5.0 to 8.0, soil components can bind more P than can be used by plants (Thomason, 2002). As soil becomes more acidic, phosphate becomes increasingly bio-unavailable; under these conditions, phosphate binds to aluminum and iron (Bohn et al., 2001).
It is generally understood that pollutants bound to particulates may be found in higher concentrations during high intensity storms that mobilize particulates, as opposed to highly soluble species, such as nitrate, which are mobile during all rainfall events (Francey, Fletcher, Deletic, & Duncan, 2010).
Figure 5 illustrates different pathways by which nitrogen and phosphorus may be released and move through the environment. Although phosphorus is not known to be dry or wet
deposited in large concentrations as nitrogen species are via atmospheric pathways, most other avenues for nutrients to end up in aquatic systems are similar for N and P. Figure 5 illustrates how various nitrogen and phosphorus species can end up in runoff from fertilized crop land,
animal agriculture waste, industrial processes, urban runoff and residential runoff, particularly associated with lawn fertilization. Various N and P species originate from fertilizer and animal excrement, meaning that these pollutants can end up in runoff from agricultural areas (e.g. crop fertilizer, bovine bio-solids, swine-biosolids) and from residential areas (e.g. lawn fertilizer, pet excrement).
Figure 4 Distribution of Phosphate Species as a Function of pH
Figure 5 Hypothetical Water Cycle Showing Potential Pathways for Nutrients to Enter Surface Waters and Groundwater (Ærtebjerg, Andersen, & Schou Hansen, 2003)
0.0 1.0 2.0 3.0 4.0 5.0 6.0 7.0 8.0 9.0 10.0 11.0 12.0 13.0 14.0 {H^+} {OH^-} {H3PO4} {H2PO4^-} {HPO4^2-} {PO4^3-}
2.1.2 Stormwater Nutrient Policies and Regulations
At the Federal level in the United States, there are portions of the Clean Water Act that address both point and nonpoint source pollution. The National Pollution Discharge Elimination System (NPDES) was instigated as part of the Clean Water Act in 1972 to address point source pollution (EPA, 2013). Point sources permitted and regulated under NPDES include pipe or ditch conveyance, and municipal or industrial discharges (EPA, 2009). The approach of attempting to control the amount of pollution entering the environment is sometimes referred to as an end-of-pipe approach (Harwell, 1998). The NPDES stormwater program requires that states regulate discharge runoff by employing separate municipal stormwater collection systems (Collins et al., 2010). State environmental management agencies, such as the Florida Department of
Environmental Protection (FDEP), use the NPDES as a way to control water pollution by regulating point source discharges.
In 1987, nonpoint source management program was amended to the Clean Water Act to encourage states to assess nonpoint source problems in their jurisdictions and to develop protocol for mitigation and management. EPA regulations require cities to test and determine the
magnitude of urban nonpoint source problems and to develop plans to capture and treat
stormwater runoff (40 Code of Federal Regulations §§122, 123, 124, 504, 1988). These nonpoint source rules dictate that nonpoint sources of pollution be considered point sources after entering storm sewers (Marsh, 1993). Section 208 of the Clean Water Act requires states to plan and implement watershed-wide plans to address point and nonpoint source abatement. Section 303 explains solutions for such watersheds for situations where point source controls will not achieve goals set forth by the act (Novotny, 2003).
In 2001, the EPA implemented the Total Maximum Daily Loads (TMDL), which are provisions added to the Clean Water Act meant to address nonpoint source nonpoint source pollution. The provisions are based on best management practices (BMPs) for watersheds. Targeting nonpoint sources in residential areas, however, requires working with and obtaining collaboration from many individual private landowners (Nielson & Smith, 2005). Several social scientists have attempted to identify specific factors that influence lawn maintenance behaviors, but suggest these factors vary among economic class and geographic region, which is discussed in section 2.1.4.2 (Dietz, Clausen, & Filchak, 2004; Grove, Cadenasso, et al., 2006; Nielson & Smith, 2005). An understanding of nutrient source release and transport is necessary in order to implement BMPs that will be capable of meeting TMDLs.
2.1.3 Urban and Residential Land Use
Activities and atmospheric deposition taking place within an urban area can contribute to nutrient inputs of aquatic systems. For example, in a study conducted in Miami (Florida),
researchers found that in an area where directly connected impervious area accounted for 44% of the watershed, it accounted for 72% of the total runoff volume (Carey et al., 2013). A high amount of impervious cover has also been shown to increase runoff volumes, which enhances nutrient transport because of decreased infiltration. Notably, transportation areas such as parking areas and gas stations all contribute to nutrients in stormwater systems; this is thought to be a result of high automobile use and the resultant atmospheric pollution deposition in these areas (Carey et al., 2013). Accordingly, street traffic density can influence nutrient loads in stormwater.
Also highly relevant to urban and residential areas is new residential construction, such as for a subdivision or apartment complex. New construction can produce increased levels of
(Carey et al., 2013). In Fort Leavenworth, KS, average concentrations of total suspended solids (TSS) in stormwater runoff were over 24 times greater than those in low-flow samples from a watershed with construction sites (Brezonki & Stadelmann, 2002).
Measuring and modeling precisely where loadings originate is difficult because the
specific activities and weather patterns continually change spatially and temporally. Additionally, drawing clear, linear connections between eutrophication and nonpoint source pollution has been reported as difficult (Carpenter et al., 1998). Diffuse sources of pollutants also prove difficult to monitor and regulate. Nutrient loadings that result from fertilizer application are highly variable and can depend on rate of application, season, chemical form of fertilizer, application method, rainfall frequency and vegetative cover (Carpenter et al., 1998).
2.1.3.1 Residential Stormwater
Land use changes and spreading urbanization have also contributed to the altered nitrogen cycle. US citizens spent $8.9 billion on lawn-care inputs and equipment in 1999 (Robbins & Sharp, 2009). The public often views lawn management as a status symbol and a duty to their neighborhood. Extensive use of turfgrass and ornamentals has definitively increased the use of chemical fertilizers and other lawn management practices. Collins et al. (2010) note in particular that residential fertilizer use, pet wastes and septic systems to be major nonpoint source contributors to nitrogen pollution. Due to the characteristics of residential areas, such as altered terrain, impervious roads, roofs and compacted grounds, the characteristics of stormwater flow vary greatly from that of an undeveloped area. Compared to undeveloped land and
watersheds, researchers expect residential areas to exhibit respectively larger runoff volumes, greater peak flows, steeper hydrographs and to experience higher pollutant loading (Collins et al., 2010).
Urban vegetation serves a variety of positive purposes as well. It has the ability to create microclimates (offsetting urban heat island effects), sorb pollutants including particulate matter and radiation impacts can also be attenuated by vegetation. Vegetation can stabilize slopes, such as for swales and streams, while simultaneously contributing to stormwater management (Grove, Troy, et al., 2006).
2.1.3.2 Unique Challenges
Urban ecosystems are a heterogeneous land mix of roads, buildings, homes, vegetation, water infrastructure, agriculture, and natural and semi-natural ecosystems (Groffman, Law, Belt, Band, & Fisher, 2004). Combined, urban and residential regions are their own ecosystem with production, consumption, decomposition and nutrient flux. This diversity in use and impervious surface makes it difficult to assess the structure as an ecosystem (Groffman et al., 2004).
Groffman et al. (2004) stated that, “there is a great need to quantify pollutant delivery better from urban ecosystems to receiving waters and to understand the factors (for example, altered
hydraulics, population density, physical setting, and social factors) that influence this delivery.” In this quote, Grove et al. highlight some of the many complexities one encounters when trying to connect diffuse pollution to sources within the urban-residential setting.
Many municipalities throughout the US, especially the West and Southeast, have implemented reclaimed water systems. For reclaimed water, wastewater is treated to a slightly lower water quality standard than would otherwise be required for traditional discharge and can then be piped back out to the public and other customers via a non-potable pipe network for use in lawn irrigation. This reclaimed water is valuable because it also contains varying levels of nutrients. Use of reclaimed water for irrigation is now a well-established practice, particularly in arid regions. However, in this review, no studies were identified that addressed the long-term
implication of potential nutrient pollution caused by reclaimed water irrigation; this could be of particular concern to areas with high water tables, including Florida.
The authors explained that phosphorus deposition should also be a concern in Florida, as approximately 70% of Florida’s lakes are seepage lakes, which do not have inlets and outlets (Badruzzaman et al., 2012). Flux of atmospheric phosphorus deposition in Florida has been measured to range from 6 to 16 mg m-2 yr-1. Using the Florida total water area estimate of 3.05 ×
1010 m2, total P deposition to Florida water bodies was estimated to range from 1.8 × 10⁸ to 4.8 ×
108 g-P yr-1 (Badruzzaman et al., 2012).
In 2009, reclaim water production in Florida was estimated at 2.1 x 10¹¹ L yr-1. This reclaimed water is being used to irrigate home lawns, golf courses, parks and schools
(Badruzzaman et al., 2012). A study conducted by the Southwest Florida Water Management District (SWFWMD) showed that a single family residence with metered reclaim water will use 2,020 L day-1, but an unmetered household will use 3,710 L day-1 (Badruzzaman et al., 2012). Reclaimed water is desirable for irrigation because it provides some level of nutrient contribution to a lawn, offsetting a portion of fertilizer needs. However, nutrients in reclaimed water fluctuate and it is too cost and technologically prohibitive to find out the nutrient content of reclaimed water each time you wish to irrigate a lawn. Therefore, there is a continued risk of users over-fertilizing beyond the dose that the lawn requires.
The wide variation among homeowners’ lawn management techniques provides further difficulties in modeling and pollution assessment. If fertilizer is applied in excess or before a significant precipitation event, nutrient export can occur from managed lawns. Fertilizer restrictions are intended to aid in reducing nutrient export from residential areas and therefore improve local water quality. However, understanding how fertilizer restriction impacts nutrient
loadings may not be readily transferable across varied geographic regions. This is because the rate of application, type of fertilizer (i.e. regular or slow release), timing of fertilization, type of vegetation fertilized and soil properties may all impact uptake and potential nutrient exportation (Carey et al., 2013).
Another important issue impacting the amount of nutrients that may runoff from a residential lawn is the fact that vegetative nutrient uptake is strongly influenced by the current growth rate of the plant in question. Recent agronomy research has focused on the nuances of vegetative utilization and demand of nutrients. Kussow et al. (2011) listed the following characteristics of nutrient demand that drive plant growth: (1) Nutrient uptake and plant tissue content are more closely related to plant growth rates than external nutrient supply. (2) Nutrient uptake at a given level of external nutrient supply varies substantially in response to variable nutrient demand. (3) Plant tissue nutrient content tends to remain constant once external nutrient supplies allow plants to satisfy their demand. Based on this information, it can be noted that adding additional nutrients to the system does not necessarily lead to more or healthier vegetative growth. It is also extremely important to apply highly mobile nutrient sources (such as nitrate) at the time the plant is able to absorb the nutrient to meet its need. Mulching, laying down fibrous material (i.e. straw, wood fiber, bark fabric) before vegetation develops, has been suggested as a method for erosion control and pollutant reduction; however, the research reviewed in this thesis did not evaluate mulching in terms of nutrient pollution runoff (Novotny, 2003).
In addition, leaving grass clippings and leaf litter on lawns functions as a natural fertilizer (through the natural decay of organic matter), but also has the potential to facilitate nutrients in runoff, similar to the application of regular fertilizer. Some homeowners bag and throw away lawn clippings rather than composting or reapplying it to their lawn. Thus during summer
months, up to 20% of residential waste may be composed of yard waste that contains a large proportion of grass clippings. Legislation has passed in some areas of the US to eliminate lawn clippings from being disposed of with residential solid waste; the successfulness and extent of restriction enforcement was not addressed in the research reviewed for this thesis. Removing clippings and leaf detritus may, therefore, waste a product that could be natural fertilizer for lawns (Guillard & Kopp, 2004).
2.1.4 Diffuse Nutrients from Residential and Urban Catchments
This section contains three subsections. The first subsection reviews research on turfgrass and the lawn as an ecosystem. This section highlights the complexity of lawn systems and
reports on the significance of nutrient loss from such systems. The second subsection reviews studies that elucidate various social and psychological impetuses for lawn management practices, such as fertilization, irrigation or cultivation of particular vegetative species. Lastly, the third subsection summarizes multiple studies that have attempted to quantity nutrient pollution exiting residential lawns, turfgrass plots or residential watersheds.
2.1.4.1 Lawns and Turfgrass
Turf generally refers to a small number of vegetative species commonly used as lawn cover by homeowners and at golf courses. The turfgrass research reviewed in this study tended to focus on either leaching or runoff, rather than both simultaneously. Leaching refers to the loss of dissolved nutrients as water moves through the soil profile beyond the vegetative root layer; it is important to note in the context of a nutrient balance, as it can be a very important avenue for export or loss from a residential lawn system. Runoff refers to overland flow generated after precipitation saturates the ground, which is typically conveyed to streets or other stormwater system pathways in residential areas. The amount of nutrients found in fertilizer that can leach
from a turfgrass system is influenced by irrigation regime, precipitation patterns, fertilizer practices, the growth phase the grass is in at the time of evaluation and soil chemistry such as organic carbon content. The establishment period of turfgrass may be the most problematic time for nutrient loss. A low amount of ground cover coupled with frequent fertilization and heavy irrigation in an attempt to foster a quicker establishment of the grass creates a situation prone for water quality degradation via nutrient contamination (Easton & Petrovic, 2004).
Nutrient cycles within the residential lawn are subject to disturbance from a variety of influences including: soil organic carbon content, precipitation frequency and intensity, fertilizer frequency and loading, irrigation frequency and intensity, pH and temperature. For example, soil carbon content influences nitrogen mineralization (decomposition of organic matter into plant available substances), thereby impacting vegetative accessibility to nutrient uptake (Barton & Colmer, 2006). In addition, sandy soils have been shown to readily leach phosphorus (Easton & Petrovic, 2004). Though specific values are not reported in this manuscript, the authors stated that prolonged rainy periods following fertilizer application can induce significant nutrient loss, even on established turf (Easton & Petrovic, 2004). Barton and Colmer (2006) stated that landscape management practices, such as removing grass clippings, that increase carbon sequestration could have the potential to increase nitrogen storage in soil, thus potentially reducing nitrogen leaching.
Compared to other nutrients, nitrogen is applied in the largest quantity, but it is also generally the most mobile nutrient applied (Easton & Petrovic, 2004). Nitrogen losses can be as low as 5% per year from established turfgrass if it is neither over-irrigated or over-fertilized; however, current research suggests that up to 30% of applied nitrogen fertilizer is lost to leaching to subsurface (Barton & Colmer, 2006). An effective nitrogen management strategy must take
into account the needs of the specific vegetation, and the biological, chemical and physical attributes of the soil. Consider that a plant’s ability to take up nutrients will, in part, be influenced by the rate at which the nutrient penetrates the soil. Application of fertilizer at the time of active plant growth will thus minimize loss (Barton & Colmer, 2006).
Petrovic (1990) conducted a review of turf and fertilization research completed in the 1980’s; these studies evaluated both residential lawns and putting greens. He found that fertilizer nitrogen taken up by turf is highly variable, between 5 to 74%. In addition, losses can occur by volatilization and denitrification and these losses varied anywhere from 0 to 93% of total amount applied, with the atmospheric gaseous loss (volatilization of NH4+ and denitrification) portion
comprising 0 to 36%. This work also showed that denitrification was most significant (93%) on a particular soil type: fine textured, saturated, warm soils. Tracking nitrogen from fertilizer to determine where it ends up (i.e. as soil organic matter, as turfgrass biomass, volatilized, leached, etc.) is difficult and requires use of a tracer. 15N is an isotope label that can be used for such purposes (Petrovic, 1990). The work reviewed by Petrovic employing the isotope labeling method found that 15 to 26% of N applied would become part of the soil organic content. Petrovic also noted a highly specific type of research in this field that does not receive widespread attention: measuring of the ability to recover nutrients from clippings of different species under different management scenarios.
It stands to reason that highly soluble nitrate dissolved in irrigation water has a potential to leach below the root system if over-irrigation is occurring. Several such studies examined this issue. Researchers conducted sampling on five controlled turf plots. The 6 × 6 m2 experimental sections were located in a field and divided by 1.5 m wide buffer (Exner, Burbach, Watts, Shearman, & Spalding, 1991). They applied various pre-determined fertilizers to each plot, with
one control receiving no fertilizer. After 34 days of each receiving the same irrigation regime (1, 1.5, 2 or 2.4 kg N 100 m-2, respectively), the researchers collected 6-meter deep continuous core samples for each plot and analyzed them for nitrate, which should indicate leaching patterns. They found that as much as 95% of the applied nitrogen in the fertilizer could leach below the turfgrass root system, compared to 5 to 74% reported by Petrovic (1990). This means it was possible in this sandy loam under these particular fertilizer and irrigation regimes, the majority of applied fertilizer could pass beyond the reach of the turf’s root system to utilize. No matter the rate of fertilization used in the study, for each plot that received fertilization, a portion of nitrate leached below the turf root system. In this particular study, the authors also noted an inherent presence of nitrate in the control plot, meaning that nitrate in irrigation water could be the culprit for a portion of deep nitrate movement (Exner et al., 1991).
Schueler (2000) reviewed five studies on nitrate leaching from turfgrass. This review conveyed that, like other reports have concluded, crop plots export more nitrate than lawn turfgrass. Schueler (2000) also concluded there was a strong seasonal variation in nitrate export associated with the growing cycle of turfgrass itself; essentially exports are lowest at the onset of growing season and increase as the season progresses, peaking at the non-growth season. The best time to fertilize thus depends on the type of grass. Warm season grasses should be fertilized at the onset of the warm season and cool season grasses are best fertilized in early spring or fall. The growing and dormancy periods of grasses are dependent on the particular species and local climate where the species has been cultivated; that is to say that cool and warm season refer to the regional locations/temperature where the species thrives, rather than the time of year (Sod Solutions, 2013). Cool and warm season turfgrass characteristics for several species are summarized in Table 2.
Table 2 Turfgrass Characteristics and Common Species (Sod Solutions, 2013)
Characteristic Warm Season Turf Grass Cool Season Turf Grass
Ideal temperature range 80-95° F 65-75° F
Best region for growth South, Southwest Midwest, Pacific Northwest
Active growing season Spring & Summer Spring & Fall
Common Varieties Zoysia St. Augustine Bahiagrass Centipedegrass Bermudagrass (arid) Bluegrass Tall fescue Fine fescue Rye grass
Additional characteristics Goes dormant (turns brown) below approximately 65° F Does not have dormant period (except below freezing)
Easton and Petrovic (2004) conducted a mass balance of study of plots near Ithaca, NY, that were fertilized in different ways. They attempted to measure both nutrient leaching and runoff exports. Experimental plots were selected in an area with sandy loam soil. The researchers stripped the sod and seeded the area with 80% Kentucky blue grass and 20% perennial rye grass. Treatment consisting of five different fertilizer types at two different loadings was applied in triplicate with additional plots left untreated as controls, for a total of 33 plots. The two application rates were a low treatment amount at 50 kg ha-1 for each application and the other test plots received 100 kg ha-1. Plots also received different fertilizers: natural (swine compost, dairy compost, municipal biosolid) or synthetic (readily available NPK and controlled release NPK) nutrient sources. Rainfall depth and runoff were measured for the selected storm events; the first event (with the least established turf) produced the highest non-snowmelt runoff depth, the highest runoff as percentage of precipitation and some of the highest nutrient concentrations.
Overall, Easton and Petrovic (2004) found nitrate losses to be 2 to 5 times higher during the non-establishment period compared to post turf establishment, creating a direct correlation between nutrient loss and turfgrass density. The unfertilized plot had, at times, higher runoff and higher pollution concentrations (specifically NO3--N and NH4+-N) in the runoff compared to the
became more established, NH4+-N concentrations decreased in runoff. Table 3 shows mass losses
of phosphate and nitrate from all plots during the development stage (year one) and established stage (year two). They further pointed out that the root turnover and organic matter reduced the bulk density of the soil. This means that the soil porosity increased, allowing for faster
stormwater infiltration and increased water storage.
Table 3 Mass Loss of Phosphate and Nitrate from Fertilized Plots Over Two Years (Easton & Petrovic, 2004) Fertilizer source Fertilizer Rate (kg-N ha-1) Year PO43--P Loss (kg ha-1) NO3--N Loss Swine compost 50 1 0.8 8.2 Swine compost 50 2 1 2.9 Swine compost 100 1 1.2 6 Swine compost 100 2 1.2 3 Dairy compost 50 1 0.4 2.6 Dairy compost 50 2 0.7 2.9 Dairy compost 100 1 0.4 4.1 Dairy compost 100 2 0.7 2.5 Biosolid 50 1 0.4 8.7 Biosolid 50 2 1 4.4 Biosolid 100 1 0.2 8.5 Biosolid 100 2 0.6 2.5 Readily available 50 1 0.2 11.2 Readily available 50 2 0.6 3.1 Readily available 100 1 0.3 15.9 Readily available 100 2 0.6 4.1 Controlled-release 50 1 0.5 7.6 Controlled-release 50 2 0.6 4.3 Controlled-release 100 1 0.6 10.5 Controlled-release 100 2 0.7 2.8 Control 0 1 0.2 5.6 Control 0 2 0.3 3.8
Urea application at the highest rate (100 kg ha-1) to one plot was the only plot that yielded higher amounts of nitrate in runoff than the unfertilized control. The results of this experiment showed that nitrogen loss tended to follow solubility trends, meaning that synthetic fertilizers
with more soluble N also produced higher N losses. In addition, experimental plots receiving swine waste produced the highest concentrations of P in runoff. Among all systems, P was most likely to be lost in the form of clippings while N was most likely to be lost via leaching. The authors reported mass balance losses for phosphorus and nitrogen as percentage of total amount applied (see Figure 6). Phosphorus leached the most from plots that received swine and dairy fertilizer treatment. Leaching was found to be a function of fertilizer source, timing, infiltration rate, shoot density and antecedent soil moisture. Despite reductions in nitrogen loss over time as turf plots became more established, the concentrations found in the experiment were high enough to be problematic for aquatic organisms.
Figure 6 Mass Balance for (a) Phosphorus and (b) Nitrogen. Percent shown above each bar represents nutrient recovered rate in runoff, leachate and clippings as percent of applied after correcting for looses from the unfertilized control. (from Easton & Petrovic, 2004)
Another group of researchers conducted similar studies on phosphorus runoff from turfgrass as impacted by fertilization (Bierman, Horgan, Rosen, Hollman, & Pagliari, 2010). They carried out phosphorus runoff sampling on a series of 24 controlled plots in St. Paul, MN, of which the prior land use was pasture. They tested different application levels of fertilizer with different nutrient ratios: none, fertilizer with N and K only, and then two different levels of P with N and K. Their results showed that when soil was frozen, a higher percentage of
precipitation was lost as runoff: 1% precipitation on non-frozen soil converted to runoff while 5 to 27% of precipitation lost as runoff on frozen soil. Runoff depths and P loss in runoff for all years were impacted by fertilizer application and season. A summary of total P and reactive P runoff for the test plots is shown in Table 4.
The authors reported that for all years, plots receiving no fertilizer had lower quality turf, based on a visual rating scale. The fertilized plots, regardless of amount received, essentially all produced the same quality of grass. Clipping application improved turfgrass quality two years and had no effect the third year; clipping removal or application in whole did not produce consistent P runoff effects. All three years of the study showed significant linear increases of flow-weighted P concentrations. Phosphorus losses in runoff from turfgrass were most affected by fertilizer application, frozen versus non-frozen soil conditions, runoff depth, and turf
quality/growth. The authors reported an overall correlation of increased P when fertilizer applications were high and precipitation (leading to higher runoff) was high (Bierman et al., 2010). Bierman et al. (2010) found that in climates that have harsher winters, runoff during seasons when the soil is frozen can produce significant amounts of volumetric runoff along with P loading.