NBER WORKING PAPER SERIES
INTRA-INDUSTRY FOREIGN DIRECT INVESTMENT
Laura Alfaro
Andrew Charlton
Working Paper 13447
http://www.nber.org/papers/w13447
NATIONAL BUREAU OF ECONOMIC RESEARCH
1050 Massachusetts Avenue
Cambridge, MA 02138
September 2007
We thank Rawi Abdelal, Pol Antràs, Gordon Hanson, Steve Redding, Mathew Slaughter, Tony Venables,
Lou Wells and participants at the Trade and Investment Workshop at the NBER Summer Institute,
Harvard Kennedy School LDP seminar, and AGF workshop at ZEW Mannheim for valuable comments
and suggestions. We are grateful to Dun & Bradstreet and Dennis Jacques for helping us with the D&B
data set, and HBS and the Centre for Economic Performance at LSE for financial support. We further
thank Rodrigo Alegria and Pamela Arellano for excellent research assistance. The views expressed
herein are those of the author(s) and do not necessarily reflect the views of the National Bureau of
Economic Research.
© 2007 by Laura Alfaro and Andrew Charlton. All rights reserved. Short sections of text, not to exceed
two paragraphs, may be quoted without explicit permission provided that full credit, including © notice,
is given to the source.
Intra-Industry Foreign Direct Investment
Laura Alfaro and Andrew Charlton
NBER Working Paper No. 13447
September 2007
JEL No. F2,F23
ABSTRACT
We use a new firm level data set that establishes the location, ownership, and activity of 650,000 multinational
subsidiaries -- close to a comprehensive picture of global multinational activity. A number of patterns
emerge from the data. Most foreign direct investment (FDI) occurs between rich countries. The share
of vertical FDI (subsidiaries which provide inputs to their parent firms) is larger than commonly thought,
even within developed countries. More than half of all vertical subsidiaries are only observable at
the four-digit level because the inputs they are supplying are so proximate to their parent firms' final
good that they appear identical at the two-digit level. We call these proximate subsidiaries 'intra-industry'
vertical FDI and find that their location and activity are significantly different to the inter-industry
vertical FDI visible at the two-digit level. These subsidiaries are not readily explained by the comparative
advantage considerations in traditional models, where firms locate their low skill production stages
abroad in low skill countries to take advantage of factor cost differences. We find that overwhelmingly,
multinationals tend to own the stages of production proximate to their final production giving rise
to a class of high-skill intra-industry vertical FDI.
Laura Alfaro
Harvard Business School
Morgan Hall 263
Soldiers Field
Boston, MA 02163
and NBER
[email protected]
Andrew Charlton
London School of Economics
Houghton Street
London, WC2A 2AE, U.K
[email protected]
1 Introduction
In this paper we use a unique firm-level data set to analyze one of the enduring puzzles of the literature on foreign direct investment (FDI). Traditionally, the literature has distinguished between two forms of—and motivations for—multinational firms to locate their activities abroad. Whereas “horizontal” FDI is understood as locating production to be closer to customers and avoid trade costs (Markusen, 1984; Brainard, 1993), “vertical” FDI represents firms' attempts to take advantage of cross-border factor cost differences (Helpman, 1984; Helpman and Krugman, 1985). Most research has found that the bulk of FDI is horizontal. Our results suggest that, due to data limitations, the literature has systematically under-estimated vertical FDI, which, with our dataset, emerges as far more prevalent than previously thought.
We build on other recent findings that challenge the conventional wisdom about the dominance of horizontal FDI. Hanson, Mataloni and Slaughter (2001, 2005) and Yeaple (2003), using data on U.S. multinational activities, find strong evidence of vertical FDI. Moreover, using firm level trade data for the U.S., Bernard, Jensen, and Schott (2006) find the proportion of intra-firm trade to be higher between rich countries than between rich and poor countries, further evidence of important multinational vertical activity between rich countries.
The central challenge to date for the literature has been the absence of firm-level data to distinguish properly among the types of and motivations for FDI. The ideal data to examine these theories would consist of detailed plant level information about the location, ownership and intra-firm trading status of multinational enterprises.1 Researchers have instead used aggregate FDI flows from
balance-of-payments statistics as a proxy for MNC activity. A consistent finding based on such data is that models assuming low transport costs and comparative advantage are rejected in favor of models in which market access issues arise (see Carr, Markusen, and Maskus (2001, 2003), Markusen and Maskus, (2001, 2002), Blonigen, Davies, and Head (2003), Brainard (1993, 1997)).
With a new firm-level dataset provided by Dun & Bradstreet, however, we are able to present a much more comprehensive and nuanced picture of global multinational activity. In fact, with firm-level data on more than 650,000 multinational subsidiaries in 90 countries and 400 industries, we can identify the location, ownership, and product (at the four digit level) for each subsidiary. This remarkably detailed picture of global investment patterns is, to our knowledge, the first detailed characterization of global firm-level multinational activity. The limitation of our dataset is that we do not observe inter-plant trade within multinational firms. Instead we distinguish horizontal and vertical
1 From this data, horizontal FDI could be identified as those establishments that are owned by a foreign parent,
produce the same products as that parent, but sell them in their local market, while vertical FDI could be identified as establishments that are owned by a foreign parent, produce products that are intermediate inputs into the parent’s production, and exports those inputs to the parent country. This is a big ask of any dataset, but is especially difficult in the context of multinational firms. While there are several national databases of inward and outward foreign investment at the firm level, there is little in the way of a global source of information which includes multinational corporations of multiple nationalities.
FDI using a combination of product information and input-output matrices. We classify a horizontal subsidiary as a plant owned by a foreign parent in the same product code as that parent, while a vertical subsidiary is a plant owned by a foreign parent producing products that are inputs into the parent's product. The accuracy of this method is verified in a variety of ways.
Some of our plant–level findings require significant reconsideration of the conventional wisdom. First, consistent with the existing literature, we find that the bulk of multinational activity occurs between the rich nations of the world. Second, at the 2 digit industry level we observe considerably more horizontal FDI (subsidiaries in the same industry as their parent) than vertical FDI (subsidiaries which supply their parent with inputs). However, after disaggregating to the 4 digit level it is clear that many of the foreign subsidiaries in the same 2 digit industry as their parent are in fact producing highly specialized inputs into their parents’ production, namely, most of vertical activity is in sectors close to the parent firm. That is, contrary to the conventional wisdom, we find the number of vertical multinational (MNC) subsidiaries to be larger than commonly thought. We find important vertical activity in terms of both the number of subsidiaries (112,939 vertical versus 104,057 horizontal subsidiaries) and the number of employees (15.8 million versus 11.9 million).2 These
patterns prevail even within developed countries.
The most striking empirical finding is that a significant amount of vertical FDI may have been previously misclassified as horizontal FDI for three reasons. First, since much vertical FDI is north-north, it has been assumed to be market seeking (horizontal) when in fact, firm level data indicates that these are vertical relationships, i.e., parent firms sourcing inputs from their subsidiaries in other developed countries. Second, skill differences between parent and subsidiaries are small (even within vertical FDI) which also lends support to horizontal motivations of foreign activity.3 Third, we show
that the vertical nature of these relationships is missed at the 2 digit level (and visible only at the 4 digit level for example) since many subsidiaries are supplying goods to their parents where both the input and the final good are in the same 2 digit SIC code.
We call these subsidiaries unveiled at higher levels of disaggregation ‘intra-industry vertical
FDI’ and show that they are qualitatively different to vertical subsidiaries which cross two-digit industry codes (‘inter-industry vertical FDI’). In particular, intra-industry vertical subsidiaries are
generally supplying their parent firms with high-skill products and a large proportion of them are located in high-skill countries. Both inter- and intra-industry subsidiaries are vertical in the sense that they are providing inputs to their parent firms, but intra-industry FDI is much harder to explain with the standard theories of vertical FDI emphasizing factor cost differences as the primary motivation for
2 The data set is at the plant level for all industries. In the regression analysis we use only manufacturing
subsidiaries to compare our findings with the literature’s. See Section 2 for detailed explanation of the data.
3 Empirical tests in a framework that seeks to encompass both types of investment (such as Markusens’
knowledge-capital model) generally show that the location of foreign subsidiaries is mostly driven by factors consistent with the horizontal model, such as the size of the host market and the similarity between host and home factor endowments, Markusen and Maskus (2002). See discussion in Hanson, Mataloni, and Slauhgter (2001).
fragmentation. Using a sample of subsidiaries identified as being vertical suppliers of their parents at the two digit level we find strong evidence that vertical FDI is driven by comparative advantage, i.e., low skill activities tend to be located in low skill countries. However, when we move to the four digit level to examine those ‘intra-industry’ foreign-owned subsidiaries that are in the same two and three-digit industry as their parents, but in a four three-digit industry which is an input into their parents’ production, we find significantly less evidence that vertical FDI is driven by comparative advantage.
The example of the General Motors Corporation highlights the usefulness of distinguishing among industries with this level of detail when characterizing the type of and motivation for FDI. In our data we observe that General Motors Corporation has 2,248 entities which report it as their ‘global ultimate parent’4 and of those, 455 are subsidiaries outside the United States, and 123 are in
manufacturing industries.5 Of these foreign manufacturing subsidiaries, 68 are ‘horizontal’
subsidiaries according to our classification, (i.e., in the same primary 4 digit SIC code as their parent firm, GM SIC 3711 Motor Vehicles and Passenger Car Bodies) and using the U.S. input output matrix we classify another 42 subsidiaries as being ‘vertical’ FDI (i.e., in industries which are inputs in to the parent industry). These include inputs such as vehicle engines (SIC 3519) produced by Powertrain-Kaiserslautern in Germany, and specialized auto parts (SIC 3714) including the Delphi Interior Systems company which produces airbags in Mexico,6 GMI Engineering which produces diesel
engine parts in Japan, and GM Strasbourg which produces carburetors, pistons, rings, and valves in France. The average skill intensity of the industries of GM subsidiaries is not significantly different in rich and poor countries.7 Strikingly, the set of GM’s foreign subsidiaries does not include any firms
producing what might be called the ‘raw materials’ or ‘low skill inputs’ into the production of automobiles. That is not to say that these inputs are not produced, but rather that they are produced outside the boundaries of GM’s multinational network. If the production of automobiles is fragmented into ‘stages of production’ from raw materials to intermediate inputs to final goods, then GM’s ‘vertical FDI’ is focussed on the penultimate stages in the vertical production chain.
Finally, these empirical findings serve as the inspiration for a novel explanation for patterns of FDI that have, before the availability of these data, been misclassified and therefore mischaracterized. We argue that multinational firms have tended to embrace vertical FDI for high skill and later stages of production and arms-length transactions for lower-skill inputs and processes. Vertical FDI is the result of a combination of two decisions by a parent firm: to source an input from abroad and to source it from within the boundaries of the firm (rather than to purchase them from an unaffiliated foreign firm). Recent contributions to the theory of outsourcing have suggested that these
4 The Dun and Bradstreet data has detailed ownership information. Each firm reports a local owner (‘domestic
ultimate’) as well as a global parent (‘global ultimate’) which is the highest entity in the multinational network.
5 The non-manufacturing subsidiaries are primarily dealerships, credit, and insurance institutions. 6 And other parts of the world. Note this information is as of 1999.
7 Skill intensity is measures as the ratio of non-production to production workers: 0.17 and 0.16 in rich and poor
decisions relate to the characteristics of the two countries and the characteristics of the products being produced.8 Our strongest stylized fact is that parent firms choose to own the stage in the production
process which is closest to their own. We argue that a coexistent and correlated motivation for bringing an input inside the boundary of the firm relates not only to its characteristics or the characteristics of the country in which it is produced, but to its position in the production chain.
Although our data does not allow for a complete analysis of a firm’s decision to undertake arm-length transactions via (outsourcing) versus FDI, our evidence—together with that of the literature’s—suggests that early stages of production associated with raw/unskilled produces are undertaken via trade (see Bernard, Jensen, and Schott (2006)). As mentioned, the activities of parents are closely related to the activities of their children (i.e., most parents and children share the same 2 digit and even 3 digit industry codes) and skill differences are small. These two pieces of evidence suggest that parents choose to own those of their suppliers which conduct proximate stages of production rather than earlier stages or the production of raw materials. Different rationales may explain why firms choose to own these proximate stages of production.9 Given the data limitations,
fully explaining why firms choose to own the proximate stages of production is beyond the scope of this paper.10 However, we present evidence that the patterns of vertical foreign direct investment
(FDI) may relate to the position of various inputs in the production process. We construct a new variable which captures the proximity of two products in a vertical production chain using the proportion of the intermediate product used directly in the final good (i.e., raw materials have low proximity variables). We find that the average proximity between two industries is higher for parent subsidiary pairs indicating that parents are more likely to own their proximate inputs. We also show that the position of intermediate inputs in the chain of production explains the pattern of intra-industry FDI with goods closer to raw materials being less likely to be the subject of FDI than intermediate goods which are proximate to the final good.
Our results have several important implications. One is associated with the level of aggregation. Important elements of the pattern of foreign direct investment are missed at the 2 digit level and are not observable without industry data. This evidence suggests that conventional tests of MNC location theory using country or industry-level data are problematic and—echoing results by
8 Grossman and Helpman (2003, 2005) emphasize the role of the contract enforcement in the country; Bernard,
Jensen, and Schott (2006) use a measure of contractibility; in Antras (2003), product capital intensity and country capital abundance are positively related to intra-firm trade.
9 The activities involved in producing proximate inputs have more in common with the production of the final
good than do the activities involved in the production of raw materials due to information advantages associated with the co-ownership of these later stages. In addition, firms may worry about their intellectual property when the good is closer to their final good or parent firms may wish to “own” the penultimate stages of the production process because it gives them a monitoring advantage over arms length transactions. Bernard, Redding, and Schott (2006) use the term “core competencies.” See also Aghion and Tirole (1995).
10 Recent literature studying the boundary of the firm stresses different rationales including property rights,
transaction costs, incentive systems, and delegation of authority; see Helpman (2006) and Spencer (2005) for recent overviews of the literature. Our data is not rich enough to test alternative theories of the firm and more generally, data availability limits undertaking such test, see Antras (2003).
Schott (2003) for trade—highlight the importance of shifting away from industry analysis towards more disaggregated data to understand firm’s location decisions. Second, our analysis suggests that intrafirm trade and foreign investment activity may be better explained by more complex production processes involving several stages and decisions about not only where to source inputs but also whether to source them from inside or outside the firms boundaries.11
Firms’ motivations to undertake multinational activity have long been recognized to be complex. This debate matters as the different motivations differ on how multinational activity affects factor incomes within and across countries. If FDI is sensitive to relative factor prices it could put downward pressures on wages. That is, vertical FDI operates as a complement to trade and hence multinational activity may reduce absolute wage differences across countries and alter relative wages within countries. Horizontal FDI, on the other hand, substitutes for trade and hence multinational activity may raise income in each country without necessarily changing its distribution. Our findings suggest that intra-industry FDI could also have small effects on income distribution, as it seems to be driven primarily by proximity considerations rather than cross-border factor cost differences.
The rest of the paper is organized as follows. Section 2 describes the data. Section 3 presents the patterns of vertical and horizontal FDI in the data. Section 4 investigates the determinants of multinational activity. The last section concludes.
2. Multinational Activity: The WorldBase Data Base
We use data from WorldBase, a database containing more than 43 million firm level observations in more than 213 countries and territories compiled by Dun and Bradstreet for 2005.12
WorldBase is the core database with which Dun and Bradstreet populates its commercial data products including Who Owns Whom™, Risk Management Solutions™, Sales & Marketing Solutions™, and Supply Management Solutions™. These products provide information about the “activities, decision makers, finances, operations and markets” of the potential customers, competitors and suppliers to the clients of Dun and Bradstreet. Dun and Bradstreet compile their data from a wide range of sources—whereas other databases collect primarily from national firm registries—with a view to providing its clients contact details and basic operating information about potential customers, competitors, and suppliers. Sources include partner firms in dozens of countries, telephone directory records, websites, and self-registering firms. All information is verified centrally via a variety of
11 Equipment manufacturing, for example, tends to involve production stages-design, component production,
final assembly which are physically separable. Production stages exhibit different factor intensities with design activities being more skill intensive and others more labor intensities; see Hanson, Mataloni, and Slaugther (2001).
manual and automated checks. Information from local insolvency authorities and merger and acquisition records are used to track changes in ownership and operations.13, 14
Importantly, the unit of observation in WorldBase is the establishment rather than the firm. Establishments like firms have their own addresses, business names, and managers, but might be partly or wholly owned by other firms. We are therefore able to observe new enterprises spawned from existing firms, or by aggregating to the firm level, we can examine only independent new firms. In this paper our unit of observation is the establishment, unless otherwise specified. This paper uses four categories of data which WorldBase record for each establishment:
i. Detailed industry information: the 4-digit SIC code of the primary industry in which each establishment operates and for most countries the SIC codes of up to 5 secondary industries, listed in descending order of importance.
ii. Detailed ownership information including information about the firm’s family members (number of family members, its domestic parent and its global parent). There is also information about the firm’s status (joint-venture, Corporation, partnership) and its position in the hierarchy (branch, division, Head Quarter (HQ)).
iii. Detailed location information including the country, state, city, and street address of each family member.
iv. Basic operational information: including sales, employment, year of establishment, and an indicator of import and export activity for each establishment (less coverage).
Comprehensive Coverage of Foreign-Owned Firms
We describe an establishment as foreign owned if it satisfies two criteria: it must report to a global parent firm and that parent firm must be in a different country. Parents are defined in the data as entities which have legal and financial responsibility for another firm. Combining the location and ownership information, it is possible to identify 72,978 parent firms which have 625,427 affiliates in foreign countries reporting to them.
To give some sense of the coverage of the Dun & Bradstreet WorldBase, we compare our results to UNCTAD’s data on multinational firms.15 UNCTAD’s World Investment Report 2004
reports that there are 61,582 parent firms with 926,948 affiliates operating in the world. There are
13 For more information about the quality control process see: http://www.dnb.com/us/about/db_database/
dnbinfoquality.html.
14 Early uses of the D&B data include Caves’ (1975) comparisons of size and diversification patterns of
Canadian and U.S. domestic firms as well as subsidiaries of U.S. multinationals in Canada; and Lipsey’s (1978) comparisons of the D&B data with existing public sources. More recently, Harrison, Love and McMillian (2004) use D&B’s cross-country foreign ownership information. Other research includes Black and Strahan’s (2002) study of entrepreneurial firm activity in the U.S. and Acemoglu, Johnson and Mitton’s (2005) cross-country study of concentration and vertical integration.
several differences between our data and the UNCTAD data. First, our data is at the plant level, while their data is at the firm level. Thus we have a similar number of firms as they do in the US, but more plants. The analysis we undertake requires plant level data. Second, UNCTAD data is inflated by a huge number of Chinese observations (424 196). This represents all approved FDI projects registered by the Chinese, but is an overestimate of the number of actual foreign firms.
We also compare the U.S. owned subsidiaries in the WorldBase data with information on U.S. owned firms from the U.S. Bureau of Economic Analysis (see Figures 1a and 1b).16 The BEA’s
U.S. Direct Investment Abroad: Benchmark Survey is a census conducted every 5 years covering virtually the entire population of U.S. MNCs. In 2004, the BEA reports that sales (employment) by foreign affiliates of U.S. MNCs totaled $3,238 billion (10.02 million employees).17 In 2005 the DNB
data indicates that the sum of all sales (employment) by foreign establishments reporting U.S. parents was $2,795b (10.07 million employees). Not only is the total similar, but the distribution across countries is also consistent. Figure 1a plots the total sales (by country) of the foreign affiliates of U.S. MNCs by as reported in the BEA’s Benchmark Survey 2004 with the total sales (by country) of all firms in the D&B data which report a U.S. based parent.18 The correlation is striking suggesting that
the cross-country distribution of multinational activity in the D&B data matches that from the U.S. BEA’s benchmark’s survey.19
16 We also compare the US observations with that collected by the U.S. Census Bureau, Statistics of U.S.
Businesses. The U.S. census records 7,200,770 ‘employer establishments’ with total sales of $22 trillion located in the U.S. WorldBase includes 4,293,886 establishments with more than one employee with total sales of $17 trillion.16 The U.S. census records 3.7 million small employer establishments (fewer than 10 employees). Our
data include 3.2 million U.S. firms with more than one and fewer than 10 employees.
17 See Mataloni and Yorgason (2006) or the tables http://bea.gov/bea/di/usdop/all_affiliate_cntry.xls. 18 http://bea.gov/bea/di/usdop/all_affiliate_cntry.xls
19 This is likely to be due to errors and differences in classification of subsidiaries as U.S. or not.
Comparison U.S. Multinationals — BEA versus Dun and Bradstreet
Figure 1a: Sale U.S. Multinationals Figure 1b: Number of U.S. Subsidiaries
ARE ARG AUS AUT BEL BRA CAN CHE CHL CHN COL CRI CZE DEU ECU EGY ESP FIN FRA GBR GRC HKG HUN IDN IND IRL ISR ITA JPN KOR LUX MEX MYS NGA NLD NOR NZL PER PHL PRTPOL RUS SAU SGP THA
TURZAFVEN KOR 15 20 25 30 B E A s u b s id ia ri es of U S M N E s ( lo g s a le s ) 15 20 25 30
Dun and Bradstreet subsidiaries of US MNEs (log sales)
ARE ARG AUS AUT BELBRA BRB CAN CHE CHL CHN COL CRI CZE DEU DNK DOM ECU EGY ESP FIN FRA GBR GRC HKG HND HUN IDN IND IRL ISR ITA JPN KOR LUX MEX MYS NGA NLD NOR NZL PAN PER PHL PRTPOL RUS SAU SGP SWE THA TUR VEN ZAF KOR 2 4 6 8 10 BE A s u b s id ia ri e s o f U S M N Es ( lo g # o f fi rm s ) 2 4 6 8 10
These comparisons indicate that the D&B sample of multinational firms comprises close to the best estimates of the global population of multinational firms. Given the way the DNB data is collected, this is perhaps not surprising. D&B searches for firms using family networks. When their researchers enter one firm in the database they also immediately look for all firms in its ownership hierarchy increasing the likelihood that globally connected firms will enter the database.
General Patterns
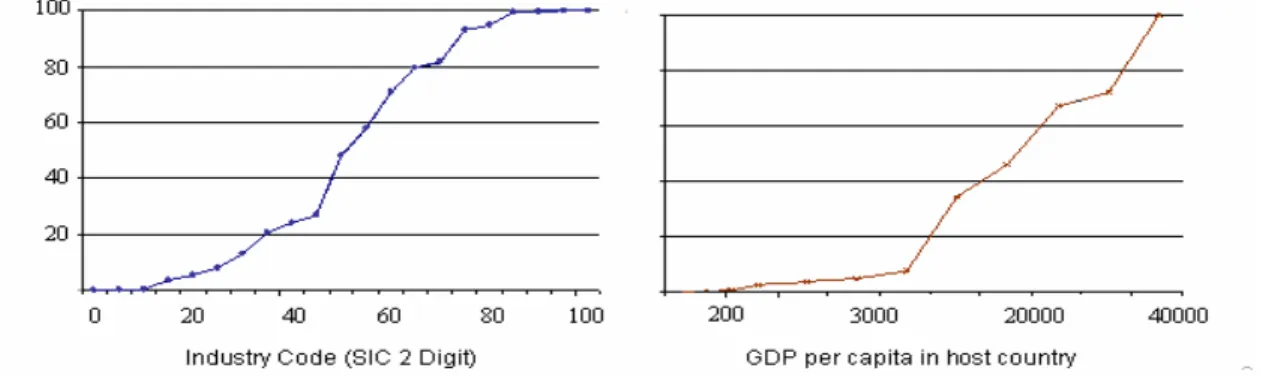
Consistent with the literature, Figure 2 indicates that the vast majority of our foreign owned subsidiaries are in richer countries (see also Table 1). There are 550,857 subsidiaries in rich countries and 53089 subsidiaries in poor countries. Figure 3 indicates that less than 2% of foreign subsidiaries are in agriculture (SIC00-10), almost 30% are in manufacturing (SIC20-40), and the remainder are in basic services (SIC 40-50) and trade (SIC 50-60), finance (SIC 60-70), and business and professional services (SIC 70-80). 20
Figure 2: Foreign Subsidiaries Across Industries Figure 3: Foreign Subsidiaries Across Countries
3. Vertical and Horizontal Foreign Investments 3.1. Measuring Vertical and Horizontal FDI
Although patterns have long been recognized to be complex, for analytical simplicity, multinational activity has been usually classified into horizontal FDI (HFDI) and vertical FDI (VFDI). A firm becomes multinational when through FDI it establishes in two or more countries business enterprises over which it exercises some minimum level of ownership control. A firm engages in horizontal FDI when it replicates a subset of its activities or production process in another country— in other words, when the same (horizontal) state of the production process is duplicated. A firm, for example, may set a foreign plant in addition to a home plant for some part of the production process.
These multi-plant firms often are motivated by potential savings of transaction and trading costs.21 In
contrast, firms engage in vertical FDI (VDFDI) when production is by function—that is, when they break the value added chain. Vertical multinational are firms that geographically separate various stages of production. As an example, a firm may decide to put all of its production of a particular component part in a separate foreign plant. Such fragmentation of the production process may be motivated by cost considerations arising from factor cost differences.22
In terms of studying the determinants of FDI, ideally one would like to separate the data into horizontal and vertical activities. However, this is difficult as the distinction is not always clear-cut (not all division of production can be neatly packaged as horizontal and vertical) and the exercise is practically very demanding of the data. In order to neatly divide the data, one would require firm-level information on the sales and on the purchases of inputs by foreign subsidiaries. Sales need to be classified according to their destination (sales to the local market, export to the home country, export to other countries), and inputs according to whether they are used for further reprocessing or for resale in the local market. Such data are generally not directly available.23
Hummels, Ishii, and Yi (2001) describe a concept of vertical specialization which captures a country’s role in the fragmentation of production into multiple stages involving value added in multiple locations. They use input-output tables to measure a country’s vertical specialization as its exports weighted by the share of imported inputs in its total output. Hanson, Mataloni, and Slaughter (2001, 2005) analyze vertical production using firm level data from the U.S. Bureau of Economic Analysis (BEA). The BEA records information about subsidiaries of U.S. parent firms including the volume of intermediate goods imported from their parents. They characterize vertical production as intra-firm flows of inputs which they observe flowing from parents in the U.S. to subsidiaries in other countries. This enables them to observe one-way U.S. bilateral intra firm trade.
We combine elements of both of these definitions and calculate bilateral horizontal and vertical FDI using firm ownership data and an input output matrix. For the purposes of analyzing the D&B dataset, we define horizontal FDI as the activity of those foreign owned subsidiaries in the same industry as their parent. Vertical FDI is the activity of foreign owned subsidiaries in industries which
21 In the models developed by Markusen (1984), Brainard (1997) and Markusen and Venables (2000) firms
with headquarters in a home country produce final output in plants that serve consumers in each of two national markets.
22 Helpman (1984) and Helpman and Krugman (1985), for example, model multinational firms that maintain
their headquarters in one country but manufacture elsewhere so as to exploit factor-price differences and conserve on production costs.
23 As Barba Navaretti and Venables (2004) note, detailed firm level data with which to analyze the activities of
multinational corporations are not widely available, restricting firm level analyses to a few countries such as the U.S. The BEA data on U.S. multinationals reports the extent to which subsidiaries export back to the U.S. It can be reasonable assumed that plants exporting a large share of their output back to the U.S. are VFDI, while those selling locally or exporting to their countries are HFDI. Note, however, that the BEA data do not track transactions between foreign affiliates of a given parent or production networks involving arm’s–length inter-firm transactions. Thus, the data do not allow observing the processing trade between foreign affiliates or between U.S. parents and foreign entities that they do not own. This implies that the data is not well suited to examine production networks in their entirety or questions of optimal firm boundaries.
are upstream from their parent’s industry (according to the U.S. input output matrix). Foreign owned subsidiaries are neither vertical nor horizontal if they satisfy neither of these criteria, and if they satisfy both we call them complex FDI.
As noted each firm reports up to six SIC codes for itself and its parent.24 Let S be the set of
SIC codes of the subsidiary, and let P be the set of SIC codes of the parent. We use notation x → z to denote any element x being an input into an element z where x Є S and z Є P. We define x → z if the input output coefficient from the U.S. input output matrix is greater than a threshold level which we vary. We define an owned establishment as:
i. Horizontal if S and P share any element (if x│x Є S ٧ x Є P) or if the sets are identical (if S=P) ii. Vertical if any element of S is an input into any element of P ( x│ x → z where x Є S and z Є
P) and if the sets are not identical (if S≠P)
i. Complex if they share any element (if x│ x Є S ٧ x Є P) and if any element of S is an input into any element of P ( x│ x → z where x Є S and z Є P) and if the sets are not identical (if S≠P). ii. Neither if none of these connections exist.
Our methodology to identify vertical FDI (subsidiaries which provide inputs to their parents) suffers from the data limitation that we do not observe intra firm trade. Instead we infer it from information about the goods produced in each of the firm’s establishments and the aggregate input-output relationship between those goods. The advantage of our approach is that we have a large amount of data for many countries and industries and we do not have to worry about the value of intra-firm trade being affected by transfer pricing. Hummels, Ishii, and Yi (2001) argue that another advantage of using I-O tables is that they avoid the arbitrariness of classification schemes that divide goods into “intermediate” and other categories. The disadvantage of our approach is that our identification of vertical subsidiaries as those which supply inputs to their parents relies on a number of assumptions. First we use an input output matrix to determine related industries. Given the difficulty in finding input and output matrices for all the countries in our data, we follow Acemoglu, Johnson, and Mitton (2005) and use U.S. input and output matrices and the firms’ industry codes to describe firms. The input output data comes from the Bureau of Economic Analysis, 1987 Benchmark I-O Tables which contain the make table, use table, direct and total requirements coefficients table. This information is provided using the BEA’s 6 digit industry codes (498-industry detail). These were
24 We also classified the data using only the primary SIC obtaining similar patterns. We prefer to report results
using all information available to us.
Vertical Horizontal Complex
matched to the 4 digit 1987 SIC codes used by Dun and Bradstreet using concordances provided by the BEA.25
The input output matrix gives us a vector of coefficients with which we determine which industries are connected via an input relationship. We select a threshold to determine the strength of the relationship required to assume that a subsidiary is a supplier to its parent. For the main results we use a threshold of 0.05 for the ‘total requirements’ coefficient (i.e., the use of a commodity directly and indirectly by an industry). We vary this between 0.01 and 0.1 and find that our results are robust. In addition we use an alternative vector of input-output coefficients based on the ‘direct requirements’ (i.e., the use of a commodity directly by an industry) which we use with a threshold of zero and again find that our results are robust. Appendix A discusses the sensitivity of the results to our assumptions.
3.1 Patterns of Vertical and Horizontal Investment
Using these definitions we can describe the most frequent manufacturing Parent-Subsidiary combinations.26 Within the manufacturing subsidiaries in the data, there are 112,939 vertical
subsidiaries and 104,057 horizontal subsidiaries.27 The overlap between categories is 50,000, i.e.,
there are 50,000 “complex” subsidiaries.28 Careful analysis of the results of our horiztonal and our
vertical classification gives us considerable comfort that the methodology is capturing a supply chain relationship between parents and subsidiaries.
Appendix Table 1 shows that the most common horizontal pairs are Motor Vehicle Parts and Accessories (SIC 3714) parent firms owning foreign subsidiaries also producing Motor Vehicle Parts and Accessories. Similarly, Appendix Table 2 reports the most common vertical industry pairs identified by our methodology. The most common vertical industry pair is 122 Medicinal Chemicals and Botanical Products firms (SIC 2833) being supplied by 475 of their foreign subsidiaries producing Pharmaceutical Preparations (subsidiary industry SIC 2834); the second most common is 79 Speciality Cleaning, Polishing, and Sanitary Preparations firms (SIC 2834) being supplied by 278 of their owned foreign subsidiaries producing Soaps and Other Detergents, Except Speciality Cleaners (SIC 2833). Casual observation indicates that the subsidiary industries in Appendix Table 1 are, without exception, clearly suppliers of inputs to the industries that our methodology pairs them with. This gives us some initial comfort that our methodology is capturing supply chain relationships.
25 Detail of this concordance is available on request. The BEA matches its 6 digit industry codes to 1987 US SIC
codes http://www.bea.gov/industry/exe/ndn0017.exe
26 Here and henceforth we focus on the manufacturing subsidiaries in order to compare our findings to the
existing literature. We have also excluded “neither” subsidiaries from the analysis. There were 21725 “neither” for a total 188721manufacturing subsidiaries.
27 Vertical and horizontal activity in manufacturing is about the same, but still this is much higher than in the
existing literature
In addition, we looked at our results at the firm level for several families of firms. For example, General Motors Corporation has 123 subsidiaries outside the United States in manufacturing industries.29 Of these foreign manufacturing subsidiaries, 68 are ‘horizontal’ subsidiaries according to
our classification, (i.e., in the same primary 4 digit SIC code as their parent firm, GM SIC 3711 Motor Vehicles and Passenger Car Bodies) and using the U.S. input output matrix we classify another 42 subsidiaries as being ‘vertical’ FDI (i.e., in industries which are inputs in to the parent industry). In descending order of frequency the top 5 industries in which these vertical subsidiaries were identifies were: Specialized Auto Parts (SIC 3714), e.g., GM Strasbourg which produces carburetors, pistons, rings, and valves in France; Vehicle engines (SIC 3519), e.g., Powertrain-Kaiserslautern in Germany; Electrical Equipment for Internal Combustion Engines (SIC 3694), e.g., Hughes Network Systems in Germany; Vehicular Lighting Equipment (SIC 3647), e.g., General Motors Do Brasil LTDA; and Steel Springs, Except Wire (SIC 3493), e.g., GM Canada.
An important concern in our methodology is that affiliates may not be shipping their products back to their parents’ country but instead to another plant in the same country or to a third country. There are reasons to include these “export platform” subsidiaries in a study of vertical FDI since they are to some degree motivated by the same comparative advantage considerations. However, they are not strictly vertical FDI and our methodology would over-estimate vertical activity if we did not exclude them. To address this concern we performed several additional exercises. In particular we eliminate any subsidiary which satisfies the definition of vertical FDI above, if the product produced by that subsidiary is an input into any product produced by another subsidiary of the same parent firm in the same host country. For example, if a GM subsidiary is producing specialised auto parts (SIC 3714) in Germany, and there is also a GM assembly factory in Germany (SIC 3711) then we exclude the parts maker from our vertical sample, on the assumption that it may be providing inputs to the German assembler rather than shipping its output back to the United States. This process causes us to eliminate just 4,378 vertical subsidiaries and does not materially change our results.
Finally, we compared the patterns of vertical and horizontal activity of U.S. affiliates in the DNB data against patterns of trade and related party trade from the U.S. Census Bureau.30 Figure 4
below supports our contention that there is a large share of vertical FDI between rich countries. There is a positive relationship between the level of development of each country and the proportion of the goods exported to the United States in the form of intra-firm (or related party) trade.
We also use the U.S. Census Bureau Data as a cross check on the DNB data. We find that the correlation between the total value of US imports from related entities reported by the U.S. Census Bureau and the aggregated sales of all U.S. vertical affiliates in the DNB data is 0.68, indicating that
29 The non-manufacturing subsidiaries are primarily dealerships, credit, and insurance institutions
30 Related-party trade includes import transactions between parties with various types of relationships including
“any person directly or indirectly, owning, controlling or holding power to vote, 6 percent of the outstanding voting stock or shares of any organization.” See the Data Appendix for further details.
the two data sources are similar. In order to control for size effects, we also calculated the ratio of vertical and horizontal sales of U.S. parents in the DNB data versus the ratio of related party imports to total imports in the US data (correlation 0.71). Examination of these firm and industry level results indicates that our vertical methodology is, to a reasonably level of accuracy, identifying multinational parents and the foreign-owned subsidiaries which supply them.
3.2 Intra- and Inter-Industry Vertical FDI
A consistent finding in the literature is that models assuming low transports costs and comparative advantage (consistent with vertical models) are rejected by the data in favor of models in which market access issues arise (consistent with horizontal models).31 Although recent evidence by
Yeaple (2003) and Hanson, Mataloni, and Slaughter (2001, 2005), however, does support the view that MNCs location decisions are affected by comparative advantage considerations, that is, by the desire to shift production activities to countries in which factors are relatively cheap, there has been consensus that the overwhelming proportion of FDI is horizontal.32 Markusen and Maskus (2002)
conclude that “horizontal investment is much more important in the world economy than vertical investment, or at least vertical investments motivated by factor-endowment differences.”
31 Brainard (1997), for example, finds little evidence that the pattern of factor abundance is related to FDI in a
way that suggests that firms are exploiting comparative advantage. Instead, she finds that that FDI is high in industry-country pairs in which transport costs are high and plant scale economies are low (market access motive). Carr, Markusen and Masksus (2001) find similar results, thus concluding that bilateral affiliate sales between the U.S. and 36 other countries between 1986-1994 are better explained by horizontal FDI measures (transport cost, plant level economies of scale) than by vertical FDI measures (relative factor endowment differences).
32 Yeaple (2003) notes that the evidence against the vertical nature of FDI comes from using data aggregated
across industries to the country level. He shows that in skill-labor scarce host countries, FDI flows are concentrated in low skill industries, whereas in skill-labor abundant host countries, FDI flows are concentrated in high skill industries.
AGO ALB ARG AUS BDI BEL BEN BGR BOL BRA CAN C HE C HL CHN CMR CRI DNK D ZA EC U EGY ESP EST ETH FIN FRA GAB GBR GEO GHA GIN GM B GR C GTM HN D HRV HUN IDN IND IRL IRN ISR ITA JAM JOR JPN KEN KOR KW T LBN LTU LVA MAR MEX MLI MOZ MUS MWI NER NIC NLD NOR NPL NZL OMN
PAKPERPAN POL PRT PR Y R OM RW A SDN SEN SGP SLE SVN SWE SW Z SYR TCD TGO THA TUN TZA UGA URY VEN VNM YEM ZAF ZMB ZW E 0 .2 .4 .6 .8 1 R a ti o o f r e la te d p a rty to to ta l i m p o rt s 0 10000 20 000 30000 40000 GD P per capita
We explain the discrepancy between our results and the previous literature by showing that the previous literature has misclassified a significant amount of vertical FDI as horizontal FDI. There are two reasons for this. First, since much vertical FDI is north-north, it has been assumed to be market seeking (horizontal) when in fact, firm level data indicates that these are vertical relationships, i.e., parent firms sourcing inputs from their subsidiaries in other northern countries. A large number of our vertical FDIs are located in high-income countries. Just 9% of vertical FDIs are located in poor countries as seen in Table 1.
Second, the vertical nature of these relationships is missed at the 2 digit level since many subsidiaries are supplying goods to their parents where both the input and the final good are in the same 2 digit SIC code.33 Many of these vertical firms are only visible at the 4-digit SIC level. The
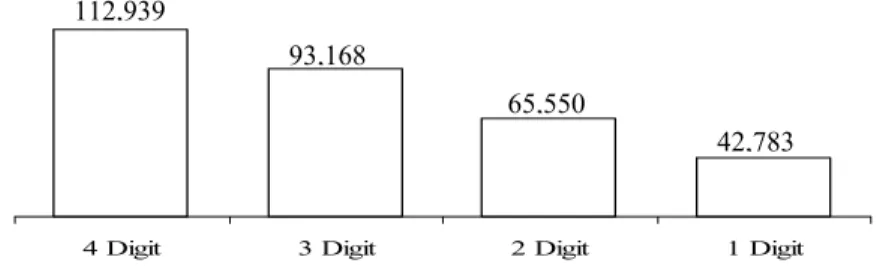
vertical nature of the ownership relationship is only apparent at low levels of industry disaggregation, and would be missed at higher levels. Figure 5 shows that at two digits much of the vertical FDI we observe appears to be horizontal FDI as it is in the same 2-digit industry code as its parent and highlights the number of observations lost when observing at smaller levels of aggregation. Figure 5 also indicates that about half of the vertical FDI we observe are not visible at the 2 digit level because only at finer levels of disaggregation is it clear that these subsidiearies produce inputs for their parents’ products. It is important to note that at finer levels of disaggregation some of the FDI we label Horizontal at the 4 digit level, may in fact be vertical. For this reason we think of our results as an upper bound on the number of horizontal subsidiaries. We argue that the distinction between those vertical investments visible at the 2 and 4 digit level is more than one of labelling—they are in fact different products where one is an input into the other (as evidenced by Appendix Table 1).
Figure 5: Vertical FDI Observed when Aggregating at the 1, 2, 3 or 4 Digit Standard Industry Code
We label vertical FDI which operates across 2 digit industry codes as ‘inter-industry vertical FDI’ and argue that it has very different motivations, product characteristics, and location determinants to the ‘intra-industry vertical FDI’ which is only observable across 4-digit industry codes. To continue with our example from General Motors, the parent SIC code is 3711 (Motor Vehicles and Passenger Car Bodies). Owned subsidiaries in Specialized Auto Parts (SIC 3714) are
33 In many cased the vertical relationship is only visible at the 4 digit level, i.e., owned subsidiaries supplying
intermediate inputs to their parent firm.
4 Digit 3 Digit 2 Digit 1 Digit
112,939
93,168
65,550
intra-industry vertical subsidiaries because they share the same three digit SIC code. Whereas owned subsidiaries in 3011 Tires or, further down the production chain, 3061 Molded, Extruded Rubber Goods are in different two digit industry codes and hence classified as inter-industry FDI.
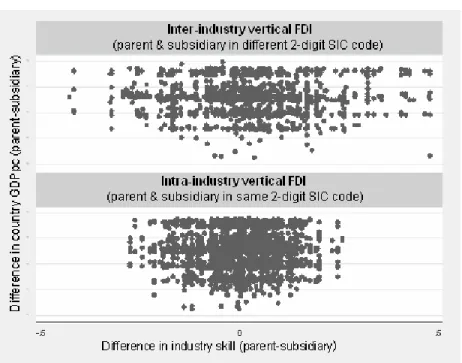
The top panel in Figure 6 shows the parent-subsidiary industry combinations for both intra and inter industry vertical FDI in the manufacturing sector (SIC 2000-3999). Looking at vertical FDI as a whole, it is striking how much vertical FDI is characterised by parents and subsidiaries in very similar industries as determined by their SIC codes. In the lower panels we observe that intra-industry subsidiaries are, by construction, bunched close to the 45 degree line but not on it while inter-industry FDI is more widely distributed.
Figure 6: Inter- and Intra-Industry Vertical FDI
(size of marker is proportional to number of subsidiaries, manufacturing only SIC 2000-4000)
The industry characteristics of inter-industry FDI are different to intra-industry FDI. Intra-industry vertical subsidiaries in industries with lower absolute skill levels, lower skill levels relative to their parent’s industry, and greater variance in parent-subsidiary skill differences (see Figure 7 and Table 2). In addition, the host country characteristics of inter- and intra-industry vertical FDI are also different. Inter-industry subsidiaries are, on average, in poorer and smaller countries.
Figure 7: Skill Difference for Vertical FDI (difference between parent and subsidiary industry skill)
3.3 Intra-industry Vertical FDI and the Intrafirm Trade Puzzle
The pattern of intra-industry vertical FDI resolves a hitherto puzzling contradiction between the FDI literature and the recent trade literature. The FDI literature has established that multinational subsidiaries which supply their parents with intermediate goods will be located in poorer countries for the purpose of taking advantage of low factor costs. This is supported by empirical evidence in the FDI literature by Yeaple (2003) and Hanson, Mataloni, and Slaughter (2001, 2005) who find that MNCs’ vertical location decisions are affected by comparative advantage considerations. The empirical implication is that most subsidiaries providing inputs for their parents will be located in poorer countries and hence intra-firm trade will be higher between rich and poor countries than between rich countries.
This conclusion is inconsistent with recent findings in the trade literature. Bernard, Jensen, and Schott (2006) find that in general, low income countries have lowshares of intra-firm exports to the US, while high income countries generally report above average intra-firm imports to the U.S. (as seen also in Figure 4). The authors report, for example, that imports from China are largely conducted at arms-length. The implication of their results from intra-firm trade data is that there is a lot of vertical FDI between rich countries. The conclusion of the trade literature is that across industries, low shares of intra-firm imports are associated with raw materials, early stages of products or labor intensive goods such as apparel and footwear. High shares of intra-firm imports are reported in capital
and technology intensive industries such as nuclear reactors, electrical machinery and organic chemicals.
The distinction between intra- and inter-industry vertical FDI resolves this contradiction. Analysis of FDI using data with industry information only at the 2 digit focusses exclusively on inter-industry FDI and misses intra-inter-industry vertical FDI. Consistent with the stylised facts above, firms engaging in inter-industry FDI are more likely to be sourcing low skill inputs from low skill countries, validating the results of FDI studies at the 2 digit level. However after including intra-industry vertical FDI which is predominantly between rich countries, the high share of intra-firm trade flows between rich countries observed in the trade data. As documented by Bernard, Jensen, and Schott (2006), across industries, low share of intra-firm imports are associated with raw materials, early sages of products or labor intensive goods such as apparel and footwear. High shares of intra-firm imports are reported in capital and technology intensive industries such as nuclear reactors, electrical machinery and organic chemicals.
4. Determinants of Intra-Industry Vertical FDI: Comparative Advantage, Proximity and Outsourcing
The patterns of intra-industry vertical multinational activity observed in the data are at odds with several elements of the conventional wisdom regarding the patterns and determinants of FDI.
The horizontal model does not account for the more than 50 percent of multinational subsidiaries which are in different industries to their parents and appear to be supplying their parents with inputs. The standard vertical explanation, at least the established models of Helpman (1984) and Helpman and Krugman (1985), has trouble accounting for most of these subsidiaries. Because so many of them are in rich countries and high skill industries—their location does not seem to be determined by the search for low factor costs.
The argument that we present in the next subsection is that the pattern of north-north intra-industry vertical FDI is explained by the decision to source certain types of inputs through outsourcing and others through FDI. Using the findings of the trade data, we argue that, on average, low skill inputs in poor countries are more likely to be outsourced, leaving us to observe FDI in high skill countries where multinational firms have sought to access their high skill inputs from within the firm. As a conceptual point, vertical FDI is the result of a combination of two decisions by a parent firm: to source an input from abroad and to source it from within the boundaries of the firm (rather than to purchase them from an unaffiliated foreign firm). Recent literature has suggested that these decisions relate to the characteristics of the two countries and the characteristics of the products being produced. In terms of the arm-length versus in-sourcing decision/trade-off, the literature analyzing the ability/capacity of firms to write contracts has focused on the characteristics of the specialized inputs (contractibility, capital intensity) and the characteristics of the country (capital abundance, capacity to
enforce).34 Our observation of significant intra-industry vertical FDI is also consistent with these
recent developments in the literature on outsourcing. One reason for the predominance of vertical FDI in rich countries is that parent firms are seeking to own the inputs which come from capital abundent countries but they outsource their supply of inputs from less capital abundant countries.
We argue that a coexistent motivation for bringing an input inside the boundary of the firm relates not to its characteristics or the characteristics of the country in which it is produced, but to its position in the production chain. A strong stylised fact in our data is that parent firms choose to own the stage in the production process which is closest to their own. As mentioned, the activities of parents are closely related to the activities of their children, i.e., most parents and subsidiaries share the same 2 digit and even 3 digit industry codes. Second, the differences between parent and child skill levels are small. These two pieces of evidence suggest that parents choose to own those of their suppliers which conduct proximate stages of production rather than earlier stages or the production of raw materials.
Several existing theories provide rationales for why firms choose to own these proximate stages of production. The activities involved in producing proximate inputs have more in common with the production of the final good than do the activities involved in the production of raw materials, so there are information advantages associated with the co-ownership of these later stages.35
In addition, firms may be more worried about their intellectual property when the good is closer to their final good. Also parent firms may wish to “own” the penultimate stages of the production process because it gives them a monitoring advantage over arms length transactions.If firms are more concerned to control the quality of their intermediate inputs than the quality of their raw materials which will be further transformed in later stages, then they may choose to own later stages of production to maximize quality control.36
We test both the importance of comparative advantage considerations in the determination of vertical FDI patterns and the importance of the position in the production process. Following Brainard (1997), Yeaple (2003), Carr, Markusen, and Maskus (2001) studies of the determinants of FDI, we run the following the following specification:
FDIijs = β2SumMktSizeij + β3Distanceij +β4 CountrySkilli + β5 CountrySkilli×IndustrySkillInts
+ β5 IndustrySkillInts + εijs (1)
34 See Antras (2003, 2005), Antras and Helpman (2004), Bernard, Jensen, and Schott (2006), Grossman and
Helpman (2003, 2005).
35 Bernard, Redding, and Schott (2006) model firm productivity as the combination of firm-level “ability” and
firm-product-level “expertise.” The authors find that in liberalization pressures firms to focus on their “core competencies.” See also Aghion and Tirole (1997).
36 This argument relies on the assumption that low quality in a previous stage is more costly than low quality in
the later stage. More generally, the argument relates to the proximate process in the last stages of productions. As mentioned, data by on intra-firm trade is consistent with our findings.
where subscript i and j indexes host and parent country, and the subscript s indexes the industry of the
subsidiary. FDI is a measure of the bilateral multinational activity in an industry, for which we use the
number of subsidiaries, their total sales, or their total employment. Due to bilateral data limitations at 4 digits, we restrict the analysis to a few main variables. Freight and tariff data, for example, are not available for all the countries in our sample at the level of digit level we require.37 We proxy trade
costs using bilateral distance between the home and host country, Distanceij. Market size is the sum of
the GDPs in the host and parent economies, SumMktSize. The comparative advantage motive enters
into equation (1) via proxy variables for a host country’s unit cost of production given by β5 CountrySkilli +β6 CountrySkilli*IndustrySkillInts +β7 IndustrySkillInts; where CountrySkilli proxies
the human capital abundance of the host country and IndustrySkillInts is the skilled labor intensity of
sectors. Standard errors are heteroskedastic consistent and allow for clustering at the industry level. All variables are in logs except when noted. Country skill is average years of schooling from World Bank, WDI; Industry Skill Intensity is the ratio of non-production to total workers. Appendix B explains data and sources in detail. We restrict analysis to the manufacturing sector in order to compare our results to the literature’s. 38
We follow Yeaple (2003) and focus on the interaction between the relative skilled-labor abundance of countries with the skilled-labor intensity of industries to determine if less skilled products tend to be produced in low skill countries. The market access motive should vary with country-industry pair characteristics as well as country characteristics such as market size. The comparative advantage also varies across country and industries, depending on the importance of factor price differentials across countries given an industry’s production technology.
4.1 Comparative Advantage
Table 3 presents the main results following equation (1), where we use a Tobit regression to account for the bilateral country-industry observations where no FDI is observed. In Column (1) we present results of the estimation of equation (1) using data observable at 2 digit level of aggregation using information on the number of firms with U.S. parent only (19 two-digit manufacturing industries). This is the specification most like the studies of Yeaple (2003). Overall, the results are in line with the literature. The GDP variables, is positive and significant. The variable bilateral distance, which proxies costs, is associated with less multinational activity (which is not consistent with the market access motive but similar results are obtained in the literature, see Carr, Markusen, and Maskus (2001)). In terms of the comparative advantage variables, the interaction terms of country
37 Given our sample of countries, it is difficult to find industry trade costs by bilateral pair (as those used in the
literature using U.S data). Our objective is to present evidence of the facts we uncovered, not to undertake a full fledged analysis of the determinants of FDI.
38 There results should be taken with caution as there are concerns regarding the use of reduced-form
skill and industry skill intensity is positive and significant. Column (2) presents results for the whole sample of 94 countries using number of firms while columns (3) and (4) use sales and employment as dependent variables, respectively. In all cases we obtain similar results. The interaction term of country skill abundance and industry skill intensity is positive and significant. In terms of the economic significance, estimates in column (2) imply that an increase in the distance between the parent and subsidiary country has a negative effect on the level of bilateral multinational activity; a movement from the 25th percentile (e.g., the UK and Norway) to the 75% percentile (the UK and Mexico) of the distribution of distances is associated with a reduction in the number of subsidiaries equivalent to 32% of the mean number of subsidiaries. An increase in the subsidiary country skill level has a negative effect on the level of multinational activity; a movement from the 25th percentile (e.g., Slovenia) to the 75% percentile (Germany) of the distribution of skills is associated with a decrease in the number of subsidiaries of 80% below the mean. An increase in the difference between the parent and subsidiary country skill levels has a negative effect on the level of bilateral multinational activity; a movement from the 25th percentile (e.g. the difference between the UK and Finland) to the 75% percentile (the difference between the UK and Brazil) of the distribution of bilateral skill differences is associated with a decrease in the number of subsidiaries of 28% below the mean.
Columns (5) to (13) present results using 4 digits level of aggregation data unveiling intra-industry vertical FDI. The GDP variable remains positive and significant. This again is explained by the fact that most FDI is in rich countries. However, the interaction term is no longer significant. Is this vertical attracted by factor differences as recent work finding evidence of vertical motivations seems to suggest? At the 2 digit level (inter-industry vertical FDI) we find similar results as Yeaple (2003), that is, at 2 digits, there is an important component of FDI that is driven by comparative advantage. But the effect is much weaker at the 4 digit level (where firms are sourcing intermediate inputs). When we replicate the analysis at the 4 digit level, we find that the comparative advantage variables become insignificant. This is because the 4-digit FDI is more proximate (therefore higher skill and in richer countries). At 4 digits, we find that the FDI that is misclassified is not being driven by comparative advantage considerations.
4.2 Proximity
We introduce two new variables into the literature which measures the proximity of two products in a vertical production chain. The first variable which we call ‘proximity’ is constructed for each pair of 4 digit SIC codes using the U.S. Input Output matrix. For each pair of codes we identify two different input-output coefficients: both the Direct Requirements Coefficient i.e., the amount of
the output of industry i used directly as an input into industry j and the Total Requirements Coefficient, i.e, the total amount of industry i used either directly or indirectly in the production of
industry j. Our measure of proximity is the ratio of direct/total requirements coefficients. The more of
the intermediate product used directly in the final good the higher the proximity variable, i.e., raw materials have low proximity variables. This variable may not effectively distinguish between two early stages of production if neither of them produce any direct inputs into the final good (i.e., the proximity of both will be zero). For this reason we also create an alternative variable which we call ‘closeness.’ This variable is simply the absolute difference between the four digit SIC codes of the two products. For example Motor Vehicles and Passenger Car Bodies (SIC 3711) has a closeness of 3 from Motor vehicle parts and accessories (SIC 3714) and a closeness of 246 from Stamped Body Parts for Passenger Cars (SIC 3465). This closeness variable merely takes advantage of the fact that the 1987 Standard Industrial Classification (SIC) groups similar industries together.
We test whether the average proximity variable is higher for parent subsidiary pairs. As seen in Table 4, we find that the average proximity between two industries is higher for parent subsidiary pairs: on average across all industries the ratio is 0.06 and for the average parent-subsidiary pair it is 0.58 indicating that parents are more likely to own their proximate inputs. We also find a positive correlation between the proximity variable and the skill level of the industry (0.25) suggesting, as expected, that raw materials have lower skill levels on average. We also find that the average proximity variable of subsidiaries in rich countries is higher than in poor countries, suggesting, again as expected, that rich countries specialise in intermediate inputs relative to raw materials.
We repeated the previous exercise at the 4 digit level adding in proximity variables and run an appended equation that includes our proximity variables.
FDIijsk = β2SumMktSizeij + β3Distanceij +β4 CountrySkilli + β5 CountrySkilli×IndustrySkillInts + β5 IndustrySKillInts + β6 Proximitysk + εijsk (2)
where subscript i and j indexes host and parent country, and the subscript s and k indexes the industry
of the subsidiary and parent. We used as proximity variables both the ratio of Direct Requirements/Total Requirements and the absolute difference in the 4 digit SIC code between the
parent and the subsidiary (closeness). Table 3 Columns (8) to (12) present the main results. The proximity variables are highly positive and significant. The market access and distance variable remain significant with the expected sign. We find that proximity is a significant determinant of vertical FDI. Multinational firms are more likely to own the stages of production closest to their final good. In terms of the economic significance, estimates in column (8) imply that an increase in the ratio of direct to total IO coefficients between two industries has a positive effect on the level of vertical multinational activity observed between those industries; a movement from the 25th percentile to the 75% percentile of the distribution of ratios of IO coefficients is associated with an increase in the number of vertical subsidiaries between those industries equivalent to 36% of the number of subsidiaries in the average industry pair. When measuring proximity as the difference in SIC code, estimates in column (9) imply that the further apart two SIC codes are, the less vertical
multinational activity observed between them; for every 2 digit SIC code further apart a parent and subsidiary are, the number of subsidiaries in that bilateral industry pair decreases by 17% below the mean.
5. Conclusions
The firm level data in this paper gives close to a comprehensive picture of the location, ownership, and activity of global multinational subsidiaries. A number of patterns emerge from the data. Most foreign direct investment (FDI) occurs between rich countries. In contrast to the existing FDI literature we find that the share of vertical FDI is larger than commonly thought, even within developed countries.
We explain the discrepancy between our results and the previous literature by showing that a significant amount of vertical FDI was misclassified as horizontal FDI because much of it is north-north FDI between parent and subsidiaries in similarly skilled activities, and since more than half of all vertical subsidiaries are only observable at the four-digit level because the inputs they are supplying are so proximate to their parent firm’s final good that they appear identical at the two-digit level. These ‘intra-industry’ vertical subsidiaries are qualitatively different to the inter-industry vertical FDI visible at the two-digit level. Intra-industry vertical subsidiaries are generally producing inputs which are of similar skill intensity to the final goods produced by their parents and they are overwhelmingly producing them in high skill countries, i.e., their production and location are not readily explained by the comparative advantage considerations in traditional models of vertical FDI.
We argue this pattern of intra-industry north-north vertical FDI reflect firms’ decision to outsource versus own the production of intermediate inputs. Overwhelmingly, multinationals source raw materials and inputs in early stages of production from outside the firm but tend to own the stages of production proximate to their final production giving rise to a class of high-skill intra-industry vertical FDI.
Appendix A: Sensitivity of Results to the I-O Methodology
How sensitive are these results to the IO methodology? We initially use a coefficient cutoff of 0.05 and vary this to test the robustness of our results to different coefficients. If we raise the cutoff coefficient to 0.075, we lose only one of the top 10 vertical pairs in Appendix Table 1. All of the others have coefficients greater than 0.075. The pair we lose is the parent firms in the Orthopedic, Prosthetic, and Surgical Appliances and Supplies (SIC 3842) and the subsidiaries in Surgical and Medical Instruments and Apparatus (SIC 3841). The IO coefficient is 0.063 and there are 201 such pairs. We are reluctant to cut this pair because it appears to be a bone-fide vertical relationship.