TAVERNS: Visualization and Manipulation of GIS data in 3D Large Screen
Immersive Environments
Simon Su
1, William Sherman
1, Frederick Harris
2, Mike Dye
21
Desert Research Institute, Reno, NV, 89512, USA
2
Dept. of Computer Science & Engineering, University of Nevada, Reno NV 89557, USA
[email protected]
Abstract
Currently there are many software packages that allow analysis of Geographic Information Systems (GIS) data. However, these software packages limit user interaction and exploration of the GIS data to 2-dimensional (2D) interface. Virtual Reality (VR) technology provides a great way for manipulating and visualizing 3-dimensional (3D) data in three dimensions. This paper presents the use of 3D large screen immersive environments for manipulation and interaction of GIS data in creating and editing GIS shapefiles.
1. Introduction
The creation of realistic training environments is crucial to enable the military to train its personnel in computer-simulated environments. The fields of computer graphics and visualization are the crucial components in the creation of realistic training environments. The military can alleviate much of the need for travel and equipment transportation associated with field training through the use of a computer generated realistic training environment. In addition, personnel can work their way through a simulation several times, honing their skills while using minimal resources.
Although advanced visualization techniques help to establish realism, a realistic recreation of real world geographic data is also necessary to achieve a fully immersive and realistic simulation environment. The geographic data in a simulation should be sufficiently realistic to represent the actual landscape of the simulated real environment. The ultimate goal of realistic visualization of geographic data is to give personnel the feeling they are present at the real-world location, even though they are actually in a simulated environment.
During geographic data acquisition, the specialist in geographical and geological disciplines must first perform an on-site survey and thoroughly analyze the location to obtain accurate information used in the simulation. However, the use of remote sensing methods allows geographic experts to gather and analyze data without ever visiting the location [1,2]. One such piece of data is a Digital Elevation Model (DEM) [3]. The DEM consists of spatially explicit digital values of height data. Another important type of data is Geographic Information Systems (GIS) vector layers [4]. GIS vector layers are maps that relate two-dimensional shapes on the physical terrain with attributes. These attributes can be assigned from a variety of sources including satellite imagery, site visits, and current databases. Although DEMs are also referred to as GIS raster layers, in this paper we refer to DEMs separately.
Software packages are currently available to provide geographic experts with the tools to analyze data layers. ESRITM [5] has available a wide array of
GIS software packages such as ArcGISTM [6] and
ArcSceneTM [7] for geographic experts to perform data
layers analysis. Although those software packages have been proven to be useful and accurate, geographic experts are forced to learn how to manipulate 3D data with 2D interfaces. This paper introduces a 3D immersive environment, TAVERNS, for geographic experts to interact with GIS data and DEMs.
TAVERNS is actually a crucial part of a project called Desert Terrain [8,9] and built on previous work done by Stuart et. al [10]. One of the main goals of the project is to realistically model dust behavior in desert regions and use the predicted dust behaviors to create a realistic environment for training simulations. The more accurate a training environment can be predicted and simulated, the better prepared are the personnel for the real-world scenario.
The remainder of this paper is structured as follows. Section 2 presents some of the related work on
geographic applications and previous research on using GIS data in an immersive virtual environment. Section 3 presents an overview of the execution environments. Section 4 presents our 3D immersive environment for visualizing, creating and editing of shapefiles. We present the results and discuss related issues in section 5. Section 6 presents our conclusion and several possibilities for future work.
2. Related Work
2.1 Geographic Information Systems
A GIS [4] is a computer system used for capturing, analyzing, and displaying geographically referenced information. In short, GIS revolves around the creation and management of spatial data identified according to location. It is a computer system that allows users to integrate, store, edit, analyze and display geographic data. Some of the practical applications of GIS are scientific investigations and military training.
Shapefiles are used to store non-topological geometry and attribute information for the spatial features in a data set [8]. It is used to represent features of spatial and geographic data for terrain analysis. Currently available software packages will only allow the 2D interaction and manipulation of the shapefiles. Therefore, no elevation data is available to the user in the shape creation process. During the editing and outlining process, a geographer will be forced to estimate the location of a mountain range since the slope information will not be available. The geographer would be estimating the location of the mountain range with a “birds-eye” aerial photo. Although expert geographers have vast resources available to them for a close estimation, inaccuracies will develop from the lack of a 3D perspective. The ability to interact and manipulate the data in 3D will allow for the creation of the more accurately outlined shapes on the 3D data. Figure 1 shows several data layers that represent different type of data for the same location [9].
Figure 1: Example data layers for a particular location [9].
2.2 Virtual Environment
VR provides a medium composed of immersive interactive computer simulations that provide real-time feedback to the users [11]. VR is a technology that can provide sophisticated real time 3D user interface for users to interact with 3D applications. Therefore, VR technology is a good candidate as a user interface for interaction with 3D GIS data. There have been various research efforts regarding the use of VR technology in different contexts [12, 13, 14, 15, 16].
Interaction within a virtual environment can generally be categorized into selection, manipulation, navigation, and system control [17]. Selection and manipulation techniques will be very different from one application to another as each application’s interaction requirements are different. Navigation techniques are mandatory for large scaled VR applications like terrain visualization since the user will need to be able to get from one point to another within the virtual environment. In system control interaction, the user will be able to control the state of the application at the system level where the execution mode of the application is changed.
The research of applying VR technology in the field of GIS is not a new research direction. Koller et al. [13] and some other research projects [17,18] have been trying to utilize technology to enhance user experience with GIS systems. The Virtual GIS project described the rendering of GIS data in a virtual environment and 3D interactive interaction techniques available to the user of that system with VR head-mounted display technology. However, the capability to edit and create shapefiles in a 3D large screen immersive environment has not been explored. In the research of large displays, Huang et al. [20] described some of the unique features provided by their use. These unique features provided by large displays could be beneficial in the viewing and interaction with large terrain dataset within the virtual environment.
3.0 Hardware and Software Environment
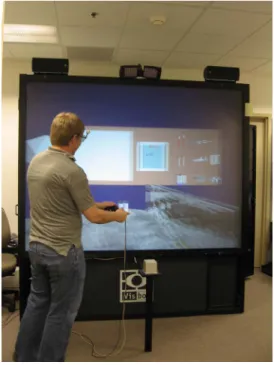
TAVERNS is currently implemented to run on virtual environments with FLEXTM (Figure 3) systemby Fakespace Systems Incorporated and VisBox-P1TM
(Figure 2) system by VisBox Incorporated. In the Fakespace Systems FLEX TM virtual environment, an
SGI PrismTM with four graphics channels is used to
drive four projectors. Tracking of the participants is accomplished with an Intersense IS-900 VETracker with wireless MiniTrax Head Tracker and wireless Wand with 5 Buttons and center click joystick. Both the viewpoint and the dominant hand are tracked at interactive rates to enable participants to interact with the application.
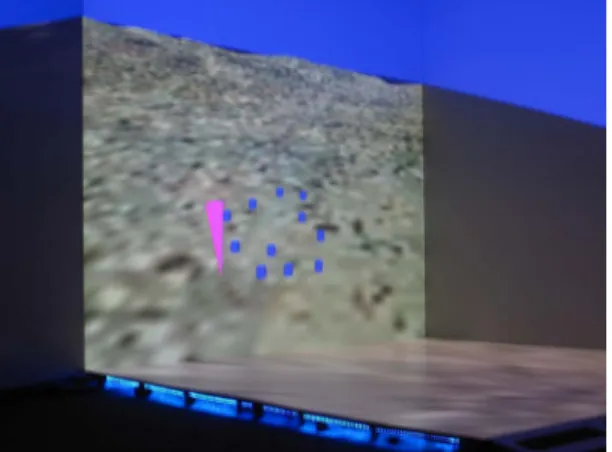
For the VisBox VisBox-P1TM virtual environment
system, a custom built dual OpteronTM graphics
workstation running OpenSUSE 10.0 with an NVIDIA Corporation GeForce 6800 GT with dual outputs is used to drive two projectors. Tracking of the participants is accomplished with an Ascension Technology Corporation Flock of Birds® with one sensor for positional tracking of the gamepad used for button and joystick inputs. The tracked gamepad is used by the participants to interact with the application. The viewpoint of the participant’s head is tracked using proprietary optical tracking solution.
The FreeVR VR library [21] and the OpenGL graphics library are being used to develop TAVERNS. Although we chose VisBox-P1TM and FLEX TM as the
display devices, the application can easily be modified to display on different virtual environment displays with various configurations supported by the FreeVR library. In addition, the FreeVR library also supports various virtual reality devices that enable the use of other tracking devices with the application.
Figure 2: VisBox-P1TM.
Figure 3: FLEXTM. 4.0 TAVERNS
TAVERNS allows for the real-time 3D display and manipulation of ESRITM shapefiles. At its core is a
shapefile library with functionality to load shapefiles created with software such as ArcGISTM and
ArcSceneTM. This library is wrapped within an
application utilizing the FreeVR VR toolkit and OpenGL graphics libraries, which allow for seamless interoperability on both FLEXTM and Visbox-P1TM
DEMs and huge textures (with a phototexture resolution as fine as one meter) with optimization techniques such as chunked level-of-detail and multiple phototexture resolutions. TAVERNS also allows the user to load multiple layers of shapefiles by using frame buffer objects. By utilizing these advanced graphical techniques, TAVERNS is capable of presenting the user with a real-time visualization of multiple layers of standard GIS formats in a virtual environment with real-time 3D manipulations.
The power of TAVERNS, however, is in its ability to allow the user to dynamically modify and create new shapes within the virtual environment. A creation subsystem tied to the shapefile library is used to create new shapes and new holes by means of a “pointer” that is the user’s means of interaction with the virtual environment. These new shapes and holes can then be saved to a file and read back in using any standard ESRITM tool.
In addition to a creation subsystem, TAVERNS employs a separate edit subsystem that is also tied into the shapefile library. This subsystem allows the pointer to be used to grab and move existing points to alternate locations. The shapefile is then updated and can, like in the creation subsystem, can be saved to a file to be read back in by any ESRITM tool.
In creating and editing shapefiles, a new paradigm for navigation and manipulation was created. Navigation and manipulation is accomplished by using the standard wand type of interface device usually associated with virtual environments. Shapes are edited by using the wand to position the pointer to the desired location. It is then a simple matter of pressing a button to either add another point to a shape or holding the button while on a shape and moving the pointer again to reposition the point to a new location. TAVERNS employs a variety of visual feedback techniques to advise the user of the different options available. For example, when a user moves the pointer over a shape point, the point will change color indicating that it is possible to grab and manipulate that point.
By structuring TAVERNS around FreeVR and OpenGL with multiple subsystems bound together by a central shape library, the user is able to load, edit, save, and create shapefiles entirely within a virtual environment, without the aid of external programs such as ArcGISTM and ArcSceneTM.
4.1 Key Features
TAVERNS allows users to control every aspect of shapefile creation and visualization, from six-degrees-of-freedom navigation to on-the-fly manipulation of pre-existing shapefile points.
Navigation. Navigation in TAVERNS can be achieved through two separate travel modes: Flight mode and Drive mode. Flight mode allows users a full six degrees of freedom as they explore the terrain and examine and modify the shapefile(s) currently loaded. Drive mode allows for a more immersive experience whereby the user is only allowed the four degrees of freedom one would experience by driving across the terrain.
Creation. TAVERNS allows for simple shapefile creation on top of the virtual terrain surface. By simply moving the pointer to the desired location and pressing a button, the user is able to add a point to the currently active shapefile, as seen in Figure 4. Menu options are available to start a new shape as well as create a hole for an existing shape.
Editing. In addition to simple shapefile creation, TAVERNS allows for editing of pre-existing shapes. This is done by moving the pointer to the point the user wishes to modify and pressing and holding a button. The user is then able to move the pointer around and watch as the current point is being updated in real-time to the desired position. There are several menu options available in edit mode that allows a user to remove points in addition to adding a new point between two existing points.
Visual Feedback. With the lack of normal interface devices such as a keyboard and mouse with which to provide the user for standard interaction, TAVERNS employs a variety of visual feedback cues that inform the user as to what they are capable of doing. When the pointer moves within the bounds of a pre-existing shape, the shape itself will become outlined, showing the lines as well as the existing points that the user can then edit to their discretion. Techniques, such as OpenGL frame buffer objects, are also employed to give the user more visual feedback as of the shapefile they are currently creating/editing.
5.0 Results and Discussion
Preliminary informal surveys with geologists and geomorphologists at the Desert Research Institute showed positive feedbacks in using TAVERNS. The geologists and geomorphologists especially like the ability to work with shapefiles in 3D immersive environment that provide them with a “like-real” environment while labeling and shaping out the terrain. From the discussion with the geologists and geomorphologists, most of their shapefiles labeling involve working on the data within 2D desktop environment and then verify their work on the actual site. The use of “like-real” environment will greatly improve the accuracy of the shapefiles editing process while manipulating the data in 3D environment.
Although the geologists and geomorphologists especially liked the large screened 3D immersive and interactive virtual environment that provided them with “like-real” execution environment, the interaction features provided by the current version of TAVERNS still lacks many label and interaction tools that the scientists require to perform their job effectively. The current version of TAVERNS can best be used as verification tools to the geologists and geomorphologists to perform preliminary verification of shapefile labeling before taking the data to the actual site for final verification. More intuitive and effective labeling tools will need to be designed into TAVERNS before the application can become a tool that geologists and geomorphologists utilize to perform they daily job functions.
6.0 Conclusion and Future work
TAVERNS provides geologists and geomorphologists working on shapefiles an alternative user-interface to interact with the data. Instead of being limited by the two-dimensional interaction and visualization of a desktop application, geologists and geomorphologists can utilize the three-dimensional interaction and visualization capability provided by FLEXTM and VisBox-P1TM. Geologists and
geomorphologists who have used the application were amazed by the 3D interaction and 3D navigation capabilities provided by TAVERNS. The added ability of 3D immersive environments provide the geologists and geomorphologists an impression of being present at the actual site where the GIS data was gathered while working on the data in the 3D immersive environment.
Although preliminary findings show great promise in the application of TAVERNS to provide a 3D
immersive environment for shapefile manipulation, additional interaction techniques will need to be implemented before the application can be used as a daily tool. In addition, to support future development and enhancement, TAVERNS would benefit from a higher level graphics library such as OpenSceneGraph 3D graphics toolkit [22]. Furthermore, a formal survey will also need to be conducted to determine the reaction of the potential users to the manipulation of shapefiles in 3D immersive environment. The usability of the interaction techniques design of TAVERNS will also need to be studied to determine the viability of using the interaction techniques designed in an actual working environment.
Acknowledgements
This material is based upon work supported by a grant from the U.S Army’s RDECOM’s Simulation & Training Technology Center. Any opinions, findings, and conclusions or recommendations expressed in this material are those of the authors and do not necessarily reflect the views of the funding agencies.
Reference
[1] Campbell, J.B.: Introduction to Remote Sensing. 3rd ed. The Guilford Press (2002)
[2] Curran, P.J.: Remote Sensing of Foliar Chemistry. In: Remote Sensing of the Environment. Volume 30. (1989) 271–278
[3] Community, G.: USGS SDTS format Digital Elevation Model data (DEM). http://data.geocomm.com/dem/ (Accessed June 20, 2006)
[4] USGS http://erg.usgs.gov/isb/pubs/gis_poster/ (Accessed June 20, 2006)
[5] ESRI: ESRI GIS and Mapping Software. http://www.esri.com/ (Accessed June 20, 2006)
[6] ESRI: ArcGIS. http://www.esri.com/software/arcgis/ (Accessed June 20, 2006)
[7] ESRI: ArcScene. www.esri.com/news/arcuser/0103/files/3display.pdf
(Accessed June 20, 2006)
[8] ESRI: ESRI Shapefile Technical Description. http://www.esri.com/library/whitepapers/pdfs/shapefile.pdf (Accessed June 20, 2006)
[9] Institute, D.R.: Identifying Terrain Similarities Between the World’s Deserts and the US Army’s Desert/Hot Weather Test Site, Yuma Proving Ground (YPG), Southwestern Arizona. http://www.dees.dri.edu/Projects/emcd_CAG.htm (Accessed June 20, 2006)
[10] Stuart, J., Jaquish, J., Bassett, S., Harris, F., and Sherman, W.: "An Interactive Visualization Method for Integrating Digitial Elevation Models and Geographic Information Systems Vector Layers," Proceedings of the First International Symposium of Visual Computing (ISVC
2005) December 5-7, 2005, Advances in Visual Computing LNCS 3804, pp 553-561.
[11] Sherman, W.R., Craig, A.: “Understanding Virtual Reality: Interface, Application, and Design,” The Morgan Kaufmann Series in Computer Graphics, Morgan Kaufmann Publishers, 2003.
[12] Chen, J., Fang, Y. C., Loftin, R. B., Leiss, E. L., Lin, C., and Su, S.:, "An Immersive Virtual Environment Training System on Real-Time Motion Platform," Proc. of the Computer Aided Design and Computer Graphic (CAD&CG'2001), vol2:951-954, 2001.
[13] Koller, D., Lindstrom, P., Ribarsky, W., Hodges, L.F., Faust, N., Turner, G.: Virtual GIS: A Real-Time 3D Geographic Information System. In: Proceedings of the 6th conference on Visualization ’95. (1995) 94
[14] Lin, C.Y., Loftin, R.B., Kakadiaris, I.A., Chen, D.T., Su, S.: Interaction with Medical Volume Data on a Projection Workbench. In: The Proceedings of 10th International Conference on Artificial Reality and Telexistence. (2000) 148–152
[15] Loftin, R.B., Pettitt, B.M., Su, S., Chuter, C., McCammon, J.A., Dede, C., Bannon, B., Ash, K.: PaulingWorld: An Immersive Environment for Collaborative Exploration of Molecular Structures and Interactions. In: NORDUnet’98, 17th Nordic Internet Conference. (1998) [16] Su, S., Loftin, R. B., Chen, D. T., Fang, Y.C., Lin, C.Y.:"Distributed Collaborative Virtual Environment: PaulingWorld." The Proceedings of 10th International Conference on Artificial Reality and Telexistence, Oct. 25-27, 2000, pp. 112-116.
[17] Andrienko, G.L., Birlinghoven, S., Andrienko, N.V.: Intelligent visualization and dynamicmanipulation: two complementary instruments to support data exploration with GIS. In:Proceedings of the working conference on Advanced visual interfaces. (1998) 66–75
[18] Burigat, S., Chittaro, L.: Visualizing the results of interactive queries for geographic data on mobile devices. In: Proceedings of the 13th annual ACM international workshop on Geographic information systems. (2005) 277–284 [19] Bowman, D.A., Kruijff, E., Laviola Jr., J.J., Popupyrev, I.: An Introduction to 3-D UserInterface Design. Presence: Teleoperators & Virtual Environments 10 (2001) 96–108 [20] Huang, E. M., Mynatt, E. D., Russell, D. M., and Sue, A. E.: Secrets to Success and Fatal Flaws: The Design of Large-Display Groupware. IEEE Computer Graphics and Applications, (Jan/Feb 2006) 37-45
[21] Sherman, W. R.: FreeVR. http://www.freevr.org/ (Accessed June 16, 2006)
[22] Community, O.: OpenSceneGraph. http://www.openscenegraph.org/ (Accessed June 16, 2006)
![Figure 1: Example data layers for a particular location [9].](https://thumb-us.123doks.com/thumbv2/123dok_us/10320397.2941528/2.918.486.800.104.564/figure-example-data-layers-for-a-particular-location.webp)