2017 Seventh International Conference on Affective Computing and Intelligent Interaction (ACII)
Evaluating Effectiveness of Smartphone Typing as an Indicator of User Emotion
Surjya Ghosh∗, Niloy Ganguly∗, Bivas Mitra∗, Pradipta De†
∗Department of Computer Science and Engineering, Indian Institute of Technology Kharagpur, INDIA 721302 †Department of Computer Sciences, Georgia Southern University, USA
Email: [email protected], {niloy, bivas}@cse.iitkgp.ernet.in, [email protected]
Abstract—In Affective Computing, different modalities, such as speech, facial expressions, physiological properties, smart-phone usage patterns, and their combinations, are applied to detect the affective states of a user. Keystroke analysis i.e. study of the typing behavior in desktop computer is found to be an effective modality for emotion detection because of its reliability, non-intrusiveness and low resource overhead. As smartphones proliferate, typing behavior on smartphone presents an equally powerful modality for emotion detection. It has the added advantage to run in-situ experiments with better coverage than the experiments using desktop computer keyboards. This work explores the efficacy of smartphone typing to detect multiple affective states. We use a qualitative and experimental approach to answer the question. We conduct an online survey among 120 participants to understand the typing habits in smartphones and collect feedback on multiple measurable parameters that affect their emotion while typing. The findings lead us to design and implement an Android based emotion detection system, TapSense, which can identify four different emotion states (happy, sad, stressed, relaxed) with an average accuracy (AUCROC) of73%(maximum of94%) based on typing features only. The analysis also reveals that among different features, typing speed is the most discriminative one.
1. Introduction
Automatic detection of users’ affective states uses clues from different modalities, like facial expression, voice, phys-iological signals etc. Keystroke dynamics, that records users’ typing pattern on a desktop keyboard, has been shown to be effective in emotion detection [1], [2], [3]. Emotion detection from keystroke dynamics requires no additional hardware, is less intrusive compared to physiological sen-sors, and raw data can be reliably collected with low over-head. The benefits of keystroke dynamics can be extended to typing on smartphones. With growing penetration of smartphones in our daily life, it becomes a suitable plat-form for long running in-situ experiments for self-report collection. In addition, growing number of typing based applications presents an opportunity to explore the potential of smartphone tap pattern to predict user emotion [4].
Existing touch-based emotion detection approaches us-ing smartphones can be broadly divided into two categories. One set of work focuses on emotion detection from specific
application usage. For example, Gao et al. analyzed finger-stroke features during gameplay on an iPhone to infer users’ affect [5]. Lee et al. designed a Twitter client app and collected data from typing activity to predict emotion [6]. Ciman et al. detected stress conditions by analyzing multiple features from swipe, scroll and text input interactions in a smartphone [7]. On the other hand, several other works focused on collecting contextual information and different sensor details to detect emotion. Kim et al. proposed an emo-tion recogniemo-tion framework analyzing touch engagements using 12 attributes from 3 on-board sensors [8]. Trojahn et al. verified different hypotheses of positive and negative emotion using typing speed, error rate, pressure, and context variables like gender, age, education level and time limit [9]. Despite several attempts, the state of the art literature mostly overlooked the potential of non-intrusive, low-overhead typ-ing activities in determintyp-ing multiple emotion states in a generic context (irrespective of specific application or con-textual scenarios). Our investigation is motivated by Epp et al.’s study on predicting emotion using typing patterns from a computer connected keyboard [2], and focuses only on smartphone typing behavior.
We follow a qualitative, as well as, an empirical ap-proach for this study. We launched an online survey (sec-tion 2) with 120 participants to study the diverse facets of typing based smartphone applications. Outcome of the survey points to the different typing features carrying unique signature of emotion states. We develop (section 3) an instrumented keyboard capable of recording typing speed, backspaces, deletion, special character usage, without stor-ing any textual information to avoid privacy breach. Side by side, we opportunistically collect the emotion ground truth via self-reports by designing an Experience Sampling Method (ESM) [10]. Finally, we combine the typing features and the emotion self-reports to train a personalized machine learning model for multi-state emotion prediction.
We perform a 3-week in-the-wild study, involving 22
participants to collect the dataset (section 4) for experi-mental evaluation. Our results (section 5) indicate that it is possible to detect multiple emotion states (happy, sad, stressed, relaxed) with an average accuracy (AUCROC) of
73% (maximum of 94%) using typing features only. Our analysis also reveals that typing speed is the most discrimi-nating feature followed by other features such as number of special characters, number of backspaces, typing duration.
2. Motivational Survey
We performed an online survey using Facebook among
120 participants of different age group (18 to 50 years). Main objectives of this survey were to study the (a) user involvement in typing and (b) different possible typing cues that vary with changes in emotion states.
Figure 1:Online survey result to find (a) Daily average time spent (in minutes) in typing by the participants (b) Frequency of different typing applications used (1
indicates most frequently used,5indicates rarely used)
Our study reveals that 56% of the participants spent more than half an hour daily in typing and 27% of the participants spent at least an hour daily in typing using smartphone (Figure 1(a)). This observation reinforces our claim to leverage on typing activities to detect emotion. We asked the participants to rank different typing related applications based on their usage frequency on a scale of1 -5, where1indicates most frequently used and5indicates rarely used application and record the highest percentage for a specific typing application. This reveals that among several typing intensive applications, WhatsApp is the one mostly used. DifferentInstant Messagingtools like Facebook mes-senger, Google Talk and Emailing are also considered to be fairly used. Amount of typing involved in texting (typing SMS) and browsing is found to be least as per this study (Figure 1(b)).
Figure 2:Online survey result to find different typing cues for emotion detection. (a) Application usage variation with emotion (b) Typing intensive application usage variation with emotion (c) Variation in typing speed with emotion (d) Variation in typing mistakes with emotion (e) Variation in special character / emoticons in specific emotion states (f) Variation of typing duration with emotion
In order to reinforce our belief on different cues that can reveal human emotion while typing, we ask the participants several survey questions. We identify the following source of information -application usage, typing application usage,
typing speed, typing mistakes, usage of special characters, typing duration and pose questions to identify if different emotions can be detected by observing the variations in these parameters. We observe from the study that applica-tion usageis strongly correlated with emotion variations and
55%of the participants indicated that theirapplication usage vary with current emotion state (Figure 2(a)). Interestingly, it is also revealed that when participants use differenttyping intensive applicationslike WhatsApp or Instant Messaging tools, 47% of the participants feel that their emotion states vary (Figure 2(b)). We queried further the participants to understand which aspects of typing are found to produce an observable effect against emotion variation. In this study,
60% of the participants indicated that typing speed vary with emotion (Figure 2(c)), while 47% of the participants expressed that rate of typing mistake also vary as their emotion state switches (Figure 2(d)). Almost 83% of the participants indicated that they use special characters or emojis more in specific emotion states (Figure 2(e)). It was also revealed by70%of the participants that thedurationof the conversation in different typing application is influenced by specific emotion states (Figure 2(f)).
In summary, results of this study indicate that (a) signifi-cant portion of people spent at least half an hour daily in typ-ing and (b) there are several typtyp-ing cues (like typtyp-ing speed, typing duration, typing mistakes), which are considered to have a direct correspondence with emotion. Based on these findings, in the following, we investigate the effectiveness of various typing features for emotion detection.
3. Methodology
In this section, we first introduce the experiment appa-ratus and then illustrate details of the conducted field study.
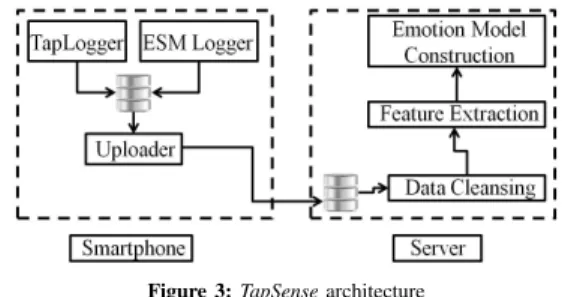
Figure 3:TapSensearchitecture 3.1. Experiment Apparatus
We design and implement a typing based emotion de-tection systemTapSense(Figure 3) and use it as experiment apparatus. It consists of the following key components.
TapLogger module tracks user’s typing activity. It is implemented by installing an instrumented QWERTY key-board using Android Input Method Editor (IME) facility. We collect the timestamp of each tap event, as well as, record the associated application name and any non alphanumeric char-acter typed. ESMLogger issues ESM probes for collection of self-reports. Once user performs typing in an application, we extract hertyping session, which we define as the period
of time user stays in the single application. Ideally, when the user comes out of the application after completion of typing, he should be probed for self-report; however this would lead to too many probes and may cause survey fatigue. Hence we design an ESM policy motivated from [11]. The proposed ESM outlined in Figure 4 triggers self-report UI only (a) if the user has performed sufficient amount of typing before changing the current application and (b) a minimum time interval has elapsed since the last ESM probe. We obtain these values based on initial field trials and note these in Figure 4. Both TapLogger and ESMLogger modules run on the smartphone and the Uploader module sends the collected data to the backend server.
Figure 4:ESMLoggerimplements hybrid ESM for collecting emotion labels. Based on initial field trials, we set the values of the config parametersT , L, W as15
seconds,80characters and30minutes respectively.
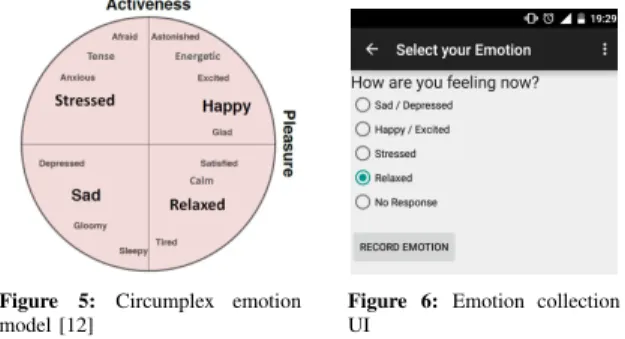
Figure 5: Circumplex emotion model [12]
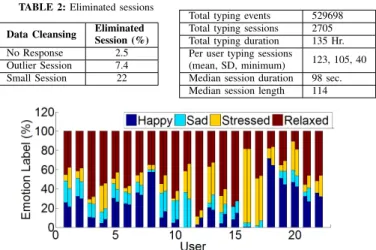
Figure 6: Emotion collection UI
We design the self-report user interface as shown in Fig-ure 6. The UI design is based on the following arguments.
• We select one dominant emotion state from each of the four different quadrants of the circumplex model (Figure 5). We select emotion states from different quadrants so that the user can distinguish them well during self-reporting.
• If the user is busy, and wants to skip a survey, there is aNo Responseoption. This choice prevents a user from randomly picking a label.
• By default, whenever the UI is shown,No Responseoption
is selected. In order to provide emotion label, user needs to select the appropriate emotion label and record. When a user provides self-report using this UI, we label the previoustyping sessionswith the emotion state recorded by the user.
On the server side, we take the raw inputs collected from self-reports and typing data, and process them for training a machine learning model for emotion prediction. As part of Data Cleansing, we remove sessions tagged with No Response and outlier sessions for which the elapsed time between typing completion and label collection is high (>3
hours). We also eliminate short sessions (length <50 key pressing events) as insufficient typing may not reveal the relationship between typing cues and perceived emotion. We set the values based on initial field trials.
TABLE 1:Features used for emotion classification
Category Feature Name
Keystroke Features
Mean Session ITD (MSI) Refined Mean Session ITD (RMSI) Number of special characters Number of backspaces (or delete) Session duration
Session text length
We extract following keystrokefeaturesas noted in Table 1. We use typing speed as a feature. For everysession, we compute the time interval between consecutive tap events, defined as Inter-Tap Distance (ITD). We computeMean Ses-sion ITD (MSI), by taking average of all Inter-Tap Distance (ITDs) present in a session. However, we find that it is possible to have overlapping ITD values in two different typing sessions tagged with different emotion states, if the emotion labels are captured within short time span. This may be due to the effect of last emotion on the current one. Therefore mean session ITD (MSI) computed using all ITD values for an emotion label may not provide clear demarcation between the two emotion states and there is a need for additional sophisticated mechanism to trace typing speed. So, we introduce the featureRMSI. We identify the set of ITDs present in a session, which actually reflects the emotion state of the current session. For this purpose, we identify the cluster of ITDs (major cluster), which is representative of current session’s emotion and use only those to computeRMSI. We outline the following clustering based approach to computeRMSIas shown in Algorithm 1.
Algorithm 1:RMSI Calculation Method
Input:Session ITDs(S)
Output:RMSI
[Cmajor, Cminor]←kmeans((S),2) itdmajor←mean(Cmajor) itdminor←mean(Cminor) Ssorted←sort(S) in ascending order
ifitdmajor< itdminorthen
RMSI←Compute mean using top80%samples ofSsorted
else
RMSI←Compute mean using bottom80%samples ofSsorted
We compute the fraction of backspace and delete keys present in a session and use it as a feature. We use this feature to get a general idea about the number of mistakes being made. Similarly, we use the fraction of special char-acters in a session, session duration and length of typed text in asession as features.Model Constructionis done at the server end. We build personalized models using these features for emotion classification of each user. We create the models using the Random Forest supervised machine learning algorithm as implemented in Weka [13].
3.2. Field Study
Survey Focus Group:We recruited30graduate students (25male,5female, aged24−33years) to useTapSense. We installed the application on their smartphones and instructed them to use it for 3 weeks to record their emotion. 3
participants left the study in between and 5 participants recorded less than 40 labels in total. Finally, we collected data from the remaining 22users (20male,2 female).
Instructions to the Focus Group:We instructed participants to select the TapSense Keyboard as the default keyboard. We informed the participants that when they switch from an application, which involved typing, they may receive a survey questionnaire as a pop-up, where they can record their emotion state. We also advised participants to record No Responselabel if they are busy and do not want to record emotion state.
4. Dataset
We collected a total of 605362typing events spanning across 3976 typing sessions. This adds up to 154 hours of typing. However, after the data cleansing operation, number of typing sessions reduced to 2705. In Table 2, we record thesessions removed at each of the data cleansing steps and in Table 3, we summarize the final dataset.
TABLE 2:Eliminated sessions
Data Cleansing Eliminated Session (%)
No Response 2.5 Outlier Session 7.4 Small Session 22
TABLE 3:Final dataset details Total typing events 529698 Total typing sessions 2705 Total typing duration 135 Hr. Per user typing sessions
(mean, SD, minimum) 123, 105, 40 Median session duration 98 sec. Median session length 114
Figure 7:Emotion distribution of each user. All but6users have recorded all4
emotion states. For every user, there are two bars, where the first bar indicates the distribution of emotion samples in original data as recorded by the participants. The corresponding second bar indicates the distribution of emotion samples after over-sampling using SMOTE.
4.1. Emotion Distribution
In Figure 7 we note the emotion distribution for each participant in the study. Except 6 users (U11, U12, U15, U17, U18, U22), all the users recorded four emotion states. We observe for most of the users relaxed is the dominant emotion state and all the emotion states are not uniformly distributed; thus creating data im-balance among the four emotion categories as observed in other studies conducted in-the-wild [14]. Overall we have recorded 18%,9%,21%,52% sessions tagged with happy, sad, stressed and relaxed emotion respectively from the participant provided self-reports.
4.2. Countering Data Imbalance using SMOTE We use Synthetic Minority Over-sampling Technique (SMOTE) [15] to counter the imbalance of emotion sam-ples. It re-samples the class with the minimum number of instances so that there are almost equal number of samples
TABLE 4:User-wise percentage of newly added samples using SMOTE
User Added Sample (%) User Added Sample (%) User Added Sample (%) U1 19.71 U9 19.61 U17 5.56 U2 7.55 U10 12.73 U18 10.71 U3 4.17 U11 22.41 U19 14.06 U4 4.27 U12 8.04 U20 10.44 U5 15.19 U13 13.23 U21 20.87 U6 4.08 U14 11.54 U22 12.35 U7 7.38 U15 8.02 - -U8 0.00 U16 0.00 -
-in each class. While us-ing SMOTE we ensured that - (a) we do not include any new state i.e. if the user has not originally recorded any emotion, the same is not added after sampling and (b) we try to add as few records as possible, so that the emotion state with least number of samples is boosted to have approximately as many samples as the category with the next higher count. By applying SMOTE we add9%new records. Amount of over-sample data per user is shown in Table 4. We also show the user-wise comparison of emotion sample distribution before and after applying SMOTE in Figure 7. All results reported in the following are based on this over-sampled data unless otherwise stated.
5. Evaluation
We tested three different models - L2-regularized Logis-tic Regression (LR), Support Vector Machines with Radial Basis Functions kernel (SVM), and Random Forests (RF) using 10-fold cross validation. We report the results of Random Forests (RF) since it generates the best classi-fication performance. We use AUCROC (Area under the Receiver Operating Characteristic curve) and F-score as the performance metric. We use the weighted average of AUCROC (aucwt) from four different emotion states as per equation 1, wherefi, auci indicate the fraction of samples and AUCROC for emotion stateirespectively.
aucwt= X
∀i∈{happy,sad,stressed,relaxed}
fi∗auci (1) We compare the performance of the proposed model with two baseline emotion models as outlined below.
• Model MRE - Most Represented Emotion Model: We construct a personalized model, which always produces the most represented emotion as the output. Given that for most of the users, there is one dominant emotion, comparing the proposed model with this model identifies its efficiency. It brings out the fact whether it is good to always predict the most represented emotion or predict emotion as per the proposed model.
• Model AGG - Aggregate Model: Assuming there is sim-ilarity in individual typing pattern, we construct an ag-gregate model by combining all users typing data and compare it with the proposed model. If it is found to be working, it can be used as an initial model for a new user, reducing the overhead of personalized training. We adopt leave-one-participant-out cross validation for validating the aggregate model i.e. for every user, we build the model using remaining users’ data and test the model using this user’s data and compute emotion classification metrics.
5.1. Classification Performance
We evaluate the performance of the proposed person-alized classification model trained using the features men-tioned previously in Table 1. We obtain an average accuracy (AUCROC) of73% (std. dev9%) and a maximum of 94%
as shown in Figure 8a. In Figure 8b, we observe that all states exceptrelaxedstate has the AUCROC close to78%, whereasrelaxedstate has the highest F-score (close to61%). In summary, we obtain high AUCROC (>80%) for32%of the participants, while attain decent performance for most of the users. 0 5 10 15 20 0 20 40 60 80 100 User AUCROC (%)
(a)User-wise AUCROC
Happy Sad Stressed Relaxed
0 20 40 60 80 100 Emotion State Mean Value (%) AUCROC F−score
(b)State-wise AUCROC, F-score
Figure 8: Emotion classification performance of the proposed model. Error bar indicates standard deviation.
We obtain poor performance (AUCROC≤60%) for 3
users. For users U11, U17 the classification performance drops as none of the explored typing features produce significant variations across emotion states. We validate the same with statistical tests1. For user U16, the performance degrades due to high imbalance in emotion distribution. The over-sampling technique also does not work as thesadstate has only one record. As a result, the overall AUCROC and state-wise performance deteriorate.
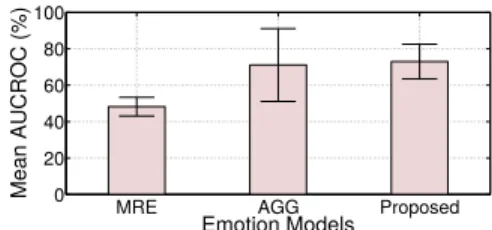
5.2. Comparison with Baseline Models
In Figure 9, we compare the performance of the pro-posed personalized model with other two models. We ob-serve that it outperforms baseline models with an average AUCROC of close to 73% (standard deviation 9%). The personalized model based onmost represented emotiononly (MRE model) attains significantly poor average AUCROC value of48% (standard deviation5%). However, the aggre-gate model (AGG model) attains comparable performance (average AUCROC of71%) with high standard deviation of
20%.
These observations indicate that always predicting the dominant emotion is not a good choice. Similarly, although aggregate model attains comparable AUCROC, it is due to the high AUCROC value for few participants. For most of the participants (42%of the participants have AUCROC less than60%) it performs poorly, resulting in such high standard deviation. This indicates the variability in individual typing pattern and the aggregate model does not capture this. So, 1. For every user, we select each feature separately and perform one-way ANOVA. We form separate group for every emotion. We group together the feature values having similar emotion state and observe significant (p < 0.05) difference across emotion states. Users having at least one significantly different emotion state are analyzed further by Tukey HSD test for pair-wise significance.
MRE AGG Proposed
0 20 40 60 80 100 Emotion Models Mean AUCROC (%)
Figure 9:Mean AUCROC across different models. Error bar indicates std dev. the proposed personalized model is a better choice, which captures individual typing patterns and performs better than most frequent emotion prediction model.
5.3. Effect of SMOTE on Emotion Classification We compare the difference in classification performance for the two cases - data with imbalance, and data processed using SMOTE. The average accuracy (AUCROC) is65%for the original dataset, while it is73%after applying SMOTE. We also report the F-score for each emotion category of both datasets in Table 5. We find that state-wise performance is poor in case of original data, however it improves fairly when we perform over-sampling using only 9% data. This shows that the proposed model can attain high classification performance with adequate data.
TABLE 5:Comparing average F-score for different emotion states on original data and over-sampled data
Dataset Happy Sad Stressed Relaxed
Original Data 0.399 0.299 0.153 0.606 Over-sampled Data 0.537 0.422 0.499 0.606
5.4. Feature Analysis
We measure the effectiveness of different features using information gain (IG). We use the InfoGainAttributeEval method from WEKA [13] to derive the information gain (IG) each of the attributes brings to the overall classification. Table 6 shows the average ranking of the features. The feature evaluation used10-fold cross validation.
TABLE 6:Discriminating features based on Information Gain
Feature Rank Avg. IG
RMSI 1 0.461
MSI 2 0.422
Number of backspace 3 0.368 Number of special character 4 0.202 Session text length 5 0.199
Session duration 6 0.197
These findings reveal that typing speed i.e.RMSI is the most discriminating feature followed by MSI and number of backspaces used in a session. This indicates that in our dataset both typing speed and typing mistakes are having strong effect on emotion classification, whereas other 3
features i.e.amount of special characters typed in a session, session text lengthand session duration are found to have a moderate effect. In summary, we find that the typing cues obtained during motivational survey (section 2) can be used for emotion detection. Our result also concurs with the survey since it finds that typing speed (RMSI, MSI) is the
TABLE 7:User coverage using one-way ANOVA. Each row indicates percentage of user having significantly (p <0.05) different feature value for at least one emotion.
Feature Users (%)
RMSI 54.5
MSI 31.8
Session length 31.8
Number of special character 18.2 Session duration 18.2 Number of backspace 13.6
most discriminative feature, as indicated by60%participants in the survey.
We delve deep to understand the influence of each feature independently on emotion classification. For this purpose, we note the percentage of users, for whom every individual feature plays significant (p <0.05) role in emo-tion classificaemo-tion using one-way ANOVA test. We record the summary result of these tests in Table 7. We observe that for most of the users RMSI, MSI play a crucial role, followed by other features like session length, number of special characters.
6. Discussion
Our results demonstrate the possibility of detecting mul-tiple emotion statesonlyfrom smartphone typing. However, the experiments need to be carefully designed to attain the desired performance level. For instance, we assume that during the entire typing session the emotion state of a user does not change. While 90% of the typing session have a session duration less than8 minutes, indicating this assumption unlikely to be false, this may not be always true. If emotion state of one user varies during a single (typing) conversation, TapSensebecomes unable to capture that. Moreover, in TapSense we do not include swype and auto-completion facilities since we mostly concentrated on exploring the typing characteristics. We also observe gender imbalance in our dataset. So, the evaluation using a large and balanced dataset may provide better insights.
There exists several challenges and extension possibili-ties in the development ofTapSense. During in-situ studies, we may not be able to collect sufficient data from the par-ticipants, which can hinder the prediction accuracy. While we adopt SMOTE to overcome the data imbalance, in case of deployable system, specialized machine learning models [16] for unbalanced dataset can be applied. Alternatively, intelligent ESM can be designed, so that once sufficient labels for each emotion state is collected, it collects the frequently occurring labels opportunistically, thus limiting the data imbalance. In this paper, we explored the efficacy of only typing. But it can be easily extended incorporating additional sensors and contextual data, along with typing, as shown in other studies [8] by weighing the additional resource cost and improvement in prediction accuracy.
7. Conclusion
This paper investigates the feasibility ofonlysmartphone typing for emotion detection. We design and implement an Android applicationTapSense, which traces smartphone
typing and records self-reported emotion state using an Experience Sampling Method (ESM). It extracts different typing features and builds a personalized multi-state emo-tion detecemo-tion model combining typing features and user provided emotion labels. We observe that using only typ-ing features, it is possible to identify four emotion states (happy, sad, stressedandrelaxed) with an average accuracy (AUCROC) of 73% (std dev. 9%) and a maximum of
94%. Analyzing the role of individual features, we find that proposed representation oftyping speedplays a major role in distinguishing multiple emotion states. This analysis reveals that other typing features likenumber of backspaces,typing duration, text length, are also important in distinguishing different emotion states.
References
[1] A. Kolakowska, “A review of emotion recognition methods based on keystroke dynamics and mouse movements,” inProceedings of IEEE Human System Interaction (HSI), 2013.
[2] C. Epp, M. Lippold, and R. L. Mandryk, “Identifying emotional states using keystroke dynamics,” inProceedings of ACM SIGCHI, 2011. [3] R. Bixler and S. D’Mello, “Detecting boredom and engagement
during writing with keystroke analysis, task appraisals, and stable traits,” inProceedings of the ACM IUI, 2013.
[4] U. Lee, J. Lee, M. Ko, C. Lee, Y. Kim, S. Yang, K. Yatani, G. Gweon, K.-M. Chung, and J. Song, “Hooked on smartphones: an exploratory study on smartphone overuse among college students,” inProceedings of the ACM SIGCHI, 2014.
[5] Y. Gao, N. Bianchi-Berthouze, and H. Meng, “What does touch tell us about emotions in touchscreen-based gameplay?”ACM Trans. on Computer Human Interactions, vol. 19, no. 4, Dec. 2012.
[6] H. Lee, Y. S. Choi, S. Lee, and I. Park, “Towards unobtrusive emotion recognition for affective social communication,” in Proceedings of IEEE CCNC, 2012.
[7] K. Wac, M. Ciman, and O. Gaggi, “isensestress: Assessing stress through human-smartphone interaction analysis,” inProceedings of the PervasiveHealth, 2015.
[8] H.-J. Kim and Y. S. Choi, “Exploring emotional preference for smartphone applications,” inProceedings of the IEEE CCNC, 2012. [9] M. Trojahn, F. Arndt, M. Weinmann, and F. Ortmeier, “Emotion recognition through keystroke dynamics on touchscreen keyboards.” inICEIS (3), 2013, pp. 31–37.
[10] J. M. Hektner, J. A. Schmidt, and M. Csikszentmihalyi,Experience sampling method: Measuring the quality of everyday life. Sage, 2007.
[11] S. Ghosh, N. Ganguly, B. Mitra, and P. De, “Towards designing an intelligent experience sampling method for emotion detection,” in
Proceedings of the IEEE CCNC, 2017.
[12] J. A. Russell, “A circumplex model of affect,”Journal of Personality and Social Psychology, vol. 39, no. 6, pp. 1161–1178, 1980. [13] M. Hall, E. Frank, G. Holmes, B. Pfahringer, P. Reutemann, and I. H.
Witten, “The weka data mining software: an update,”ACM SIGKDD explorations newsletter, vol. 11, no. 1, pp. 10–18, 2009.
[14] R. LiKamWa, Y. Liu, N. D. Lane, and L. Zhong, “Moodscope: Build-ing a mood sensor from smartphone usage patterns,” inProceeding of the ACM Mobisys, 2013.
[15] N. V. Chawla, K. W. Bowyer, L. O. Hall, and W. P. Kegelmeyer, “Smote: synthetic minority over-sampling technique,”Journal of ar-tificial intelligence research, vol. 16, pp. 321–357, 2002.
[16] Y. Tang, Y. Q. Zhang, N. V. Chawla, and S. Krasser, “Svms modeling for highly imbalanced classification,”IEEE Transactions on Systems, Man, and Cybernetics, Part B (Cybernetics), vol. 39, no. 1, pp. 281– 288, 2009.