The remarkable surface homogeneity of the Dawn mission target (1) Ceres
q
Benoît Carry
a,b,c,⇑, Pierre Vernazza
d,e,f, Christophe Dumas
c, William J. Merline
g, Olivier Mousis
h,
Philippe Rousselot
h, Emmanuël Jehin
i, Jean Manfroid
i, Marcello Fulchignoni
b, Jean-Marc Zucconi
h,1 aEuropean Space Astronomy Centre, ESA, P.O. Box 78, 28691 Villanueva de la Cañada, Madrid, Spain b
LESIA, Observatoire de Paris Meudon – CNRS, 5 place Jules Janssen, 92195 Meudon Cedex, France cEuropean Southern Observatory, Alonso de Córdova 3107, Vitacura, Casilla 19001, Santiago de Chile, Chile d
European Southern Observatory, K. Schwarzschild-Str. 2, 85748 Garching, Germany e
Laboratoire dAstrophysique de Marseille, 38 rue Frédéric Joliot-Curie, 13388 Marseille, France f
Research and Scientific Support Department, ESA, Keplerlaan 1, 2201 AZ Noordwijk, The Netherlands g
Southwest Research Institute, 1050 Walnut St. # 300, Boulder, CO 80302, USA h
Université de Franche Comté – CNRS, Institut UTINAM, 41 bis av. de l’Observatoire, F-25010 Besançon Cedex, France iInstitut d’Astrophysique et de Géophysique, Université de Liège, B-4000 Liège, Belgium
a r t i c l e
i n f o
Article history:
Received 3 May 2011 Revised 21 September 2011 Accepted 19 October 2011 Available online 28 October 2011
Keywords: Asteroid Ceres Surfaces Adaptive optics Infrared observations
a b s t r a c t
Dwarf-planet (1) Ceres is one of the two targets, along with (4) Vesta, that will be studied by the NASA Dawn spacecraft via imaging, visible and near-infrared spectroscopy, and gamma-ray and neutron spec-troscopy. While Ceres’ visible and near-infrared disk-integrated spectra have been well characterized, lit-tle has been done about quantifying spectral variations over the surface. Any spectral variation would give us insights on the geographical variation of the composition and/or the surface age. The only work so far was that of Rivkin and Volquardsen ([2010], Icarus 206, 327) who reported rotationally-resolved spectroscopic (disk-integrated) observations in the 2.2–4.0lm range; their observations showed evi-dence for a relatively uniform surface.
Here, we report disk-resolved observations of Ceres with SINFONI (ESO VLT) in the 1.17–1.32lm and 1.45–2.35lm wavelength ranges. The observations were made under excellent seeing conditions (0.600), allowing us to reach a spatial resolution of75 km on Ceres’ surface. We do not find any spectral vari-ation above a 3% level, suggesting a homogeneous surface at our spatial resolution. Slight varivari-ations (about 2%) of the spectral slope are detected, geographically correlated with the albedo markings reported from the analysis of the HST and Keck disk-resolved images of Ceres (Li et al. [2006], Icarus 182, 143; Carry et al. [2008], Astron. Astrophys. 478, 235). Given the lack of constraints on the surface composition of Ceres, however, we cannot assert the causes of these variations.
Ó2011 Elsevier Inc. All rights reserved.
1. Introduction
Ceres, discovered in 1801 by Giuseppe Piazzi, is – with a diam-eter of 935 km (Carry et al., 2008) – by far the largest asteroid in the main asteroid belt. Interestingly, recent simulations (e.g., Mor-bidelli et al., 2009; Minton and Malhotra, 2009) have shown that in the early Solar System there must have been many Ceres-sized bodies to explain the current size-frequency distribution of aster-oids. Ceres therefore appears to be a unique remnant of a dynam-ical removal process, which caused the Main Belt to lose most of its primordial mass. By furthering our understanding of the physical
properties (e.g., surface composition, density, internal structure) of the largest asteroids, we may be afforded a special opportunity to learn more about the formation process of large planetesimals from which terrestrial planets once accreted.
As one of the targets of the NASA Dawn mission (seeRussell et al. (2004)for instance), Ceres recently has been the subject of in-creased attention from the community (e.g.,Parker et al., 2002; Nazzario et al., 2003; Thomas et al., 2005; Vernazza et al., 2005; McCord and Sotin, 2005; Li et al., 2006; Rivkin et al., 2006; Cham-berlain et al., 2007, 2009; Kovacˇevic´ and Kuzmanoski, 2007; Drum-mond and Christou, 2008; Mousis et al., 2008; Milliken and Rivkin, 2009; Castillo-Rogez and McCord, 2010; Moullet et al., 2010; Rousselot et al., 2011and references therein). Three topics seem to have drawn the most attention: (1) characterization of the sur-face composition, (2) thermodynamic modeling of the interior, and (3) determination of the size, shape, spin, and albedo via disk-re-solved imaging. We summarize the main results here:
0019-1035/$ - see front matterÓ2011 Elsevier Inc. All rights reserved. doi:10.1016/j.icarus.2011.10.015
q
Based on observations collected at the European Organisation for Astronomical Research in the Southern Hemisphere, Chile – Program ID:080.C-0881.
⇑Corresponding author at: European Space Astronomy Centre, ESA, P.O. Box 78, 28691 Villanueva de la Cañada, Madrid, Spain.
E-mail address:[email protected](B. Carry).
1 Deceased.
Contents lists available atSciVerse ScienceDirect
Icarus
1. While Ceres’ exact surface composition remains elusive (see
Rivkin et al. (2010) for a review), the analysis of the 2.9– 4.0
lm region has allowed the possible detection of brucite
and carbonate assemblages on its surface (Milliken and Rivkin, 2009), suggesting that the thermal and aqueous alteration his-tory of Ceres differs from that in the record of carbonaceous meteorites.2. Modeling of Ceres’ thermo-physical–chemical evolution has pointed to a differentiated interior for Ceres, in accord with shape measurements (Thomas et al., 2005; Carry et al., 2008). The interior would consist of an inner core of dry sil-icates, an intermediate layer of hydrated silsil-icates, and an outer shell of water ice (Castillo-Rogez and McCord, 2010). However, an undifferentiated Ceres consisting of a homoge-neous mixture of hydrated silicates is still possible (Zolotov, 2009).
3. Disk-resolved imaging of Ceres has allowed determination of its size, shape, and spin with small uncertainties, in turn con-straining the density (Thomas et al., 2005; Carry et al., 2008). Finally, the images showed surface albedo variations of 6 % around the average surface value, with putative, broad-band, color variations (2–3%, see Li et al., 2006; Carry et al., 2008). The cause of the color contrast (e.g., geological features, composition, grain properties, surface age) could not be determined.
While Ceres’ visible and near-infrared spectrum has been well characterized, little has been done about quantifying spectral vari-ations over the surface. Disk-resolved analysis would give us in-sights on the geographical variation of the composition and/or variation in ages of surface units. The only disk-resolved analyses done so far were those of Parker et al. (2002), Li et al. (2006), and Carry et al. (2008), studying the albedo/color variations in the visible and near-infrared only. Observations at other wave-lengths were limited to disk-integrated observations and could only search for rotational modulation of the spectra. All studies showed evidence for a relatively uniform surface. A summary of the disk-integrated results is given here:
1. Polarization: no rotational variation reported at visible wave-lengths (Rivkin et al., 2010), although a slight variation of 0.1% in the degree of polarization can be surmised from the lit-erature (I. Belskaya, personal communication).
2. Visible photometry: low-amplitude lightcurve due to albedo features (Tedesco et al., 1983).
3. Near-infrared spectroscopy: marginal (1
r
) variations of bru-cite- and carbonates-associated absorption bands (Rivkin and Volquardsen, 2010), indicating a homogeneous mineralogy with tenuous evidence for variations.4. Far infrared radiometry: very low-amplitude lightcurve ( Alten-hoff et al., 1996; Moullet et al., 2010), indicating an overall homogeneous surface and subsurface properties (roughness, absorption coefficient, refractive index, and thermal inertia). Although the disk-integrated spectrum of Ceres presents more absorption features in the 2.9–4.0
lm region (e.g.,
Rivkin et al., 2010 and references therein), we report an analysis of ground-based disk-resolved spectral observations of Ceres’ surface in the near-infrared (1.1–2.4lm) to investigate with better spectral
res-olution the surface features detected byCarry et al. (2008)from disk-resolved, broad-band, imaging observations. At this time, high-angular-resolution imaging spectrographs can only operate in the near-infrared range. In Section2we describe the observa-tions and the data reduction, in Section3we present the spectral analysis, and in Section4 we discuss the spectral heterogeneity across Ceres’ surface.2. Observations and data reduction
We made disk-resolved observations of (1) Ceres on 2007 November 13, covering about 2/3 of its 9.074 h rotation ( Chamber-lain et al., 2007; Carry et al., 2008). The observations were made in the near-infrared with the integral-field spectrograph SINFONI (using the J: 1.17–1.32
lm and H + K: 1.45–2.35
lm gratings, with
a resolving power of 2000 and 1500 respectively, seeEisenhauer et al., 2003; Bonnet et al., 2004) at the European Southern Observa-tory (Cerro Paranal, Chile) with one (UT4/Yepun) of the four 8-m telescopes of the Very Large Telescope (VLT) facility.Atmospheric conditions were excellent, with a seeing at visible wavelengths of about 0.600(reaching 1.100at worst) and a coherence
time of 2–4 ms. The adaptive optics module of SINFONI was pro-viding a high-quality correction: the wavefront sensor used Ceres itself (V7.3) as a reference, allowing high-frequency correction (420 Hz). Identical settings were used for the observation of the standard stars (see below), and the quality of the correction was similar in both cases.
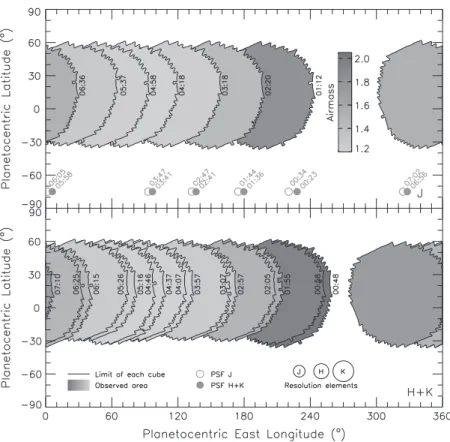
The apparent diameter of Ceres at the time of the observation was about 0.700, so to search for spectral variations across the
aster-oid surface, we used the high-angular-resolution mode with an equivalent pixel size on sky of 2512.5 milli-arcsec and a field of view of 0.80.8 arcsec. The high angular resolution, resulting from the adaptive-optics correction coupled with the excellent seeing conditions we had throughout the night (seeTable 1), al-lowed us to reach an average spatial resolution on Ceres’ surface of about 75 km (ranging from 55 to 98 km, depending on the wave-length, seeTable 2). The same jitter pattern was used at all epochs to ensure complete coverage of Ceres’ apparent disk given the nar-row field of view: a single exposure of Ceres is made at the center of the pattern, followed by four others, taken in (x,y) steps of ±0.2 arcsec from the central position. Then three sky exposures are taken 3000away from Ceres (East–North–West). Exposure times
were 90 s and 40 s in J and H + K, respectively (we used 4 s and 1 s, respectively, for the standard stars).
The observing circumstances are reported inTable 1. We list the mid-observation time (UT), grating used (J or H + K), longitude of the sub-Earth and subsolar points (SEPk and SSPk, respectively,
Table 1
Observing circumstances for (1) Ceres. For each observation, we report the mid-observation time in UT, the grating used to disperse the light, the longitude (k) of the sub-Earth point (SEP) and subsolar point (SSP), their respective latitudebbeing 3°and 0°, the airmass (X), and the seeing (s).
Time (UT) Grating SEPk(°) SSPk(°) X s(00)
00:48 H + K 211 213 2.04 0.79 00:58 H + K 204 206 1.92 0.67 01:12 J 195 197 1.77 1.28 01:55 H + K 167 169 1.49 0.73 02:05 H + K 160 162 1.44 1.10 02:20 J 150 152 1.37 1.09 02:57 H + K 125 127 1.27 0.61 03:07 H + K 119 121 1.25 0.57 03:18 J 111 113 1.23 0.61 03:57 H + K 86 88 1.19 1.10 04:07 H + K 79 81 1.19 1.11 04:18 J 72 74 1.19 1.10 04:37 H + K 60 62 1.19 1.04 04:46 H + K 53 55 1.20 n.a. 04:58 J 46 47 1.21 0.86 05:16 H + K 34 36 1.23 0.72 05:26 H + K 27 29 1.25 0.78 05:37 J 20 22 1.27 0.62 06:15 H + K 355 356 1.38 0.75 06:25 H + K 348 350 1.42 0.60 06:36 J 341 343 1.47 0.56 07:10 H + K 318 320 1.68 0.45
computed using the pole solution byCarry et al. (2008)), airmass (X), and seeing (s). During our observations, the latitude of the SEP and SSP was constant, of 3°and 0°, respectively.
Observations of standard (PSF) stars were interspersed with Ceres observations throughout the night. Two stars were used: HD 15474 (G5) and HD 28099 (G2V). Both stars have V8.1, slightly dimmer than Ceres (V7.3 at the time of the observa-tions), and were located at 8.5°and 22°from Ceres respectively. We list inTable 2the circumstances for those observations, namely the mid-observation time (UT), the grating used (J or H + K), the airmass (X), and the angular resolution measured on the star itself after data reduction (H, corresponding to its full width at half max-imum, FWHM). Although the seeing and airmass varied thorough the night, the angular resolution provided by the AO correction was very stable (Table 2). We therefore consider that the spatial resolution at Ceres was 55, 71, and 98 km in the J, H, and K-band wavelength ranges (the resolution decreasing continuously from the shortest wavelength to the longest).
The basic data reduction was performed using the ESO pipeline 2.0.5 (Modigliani et al., 2007): (1) correction of the object-sky pairs for bad pixels and flat-field effects, (2) wavelength calibration, (3) sky subtraction, and (4) reconstruction of the final image cubes (the 3-dimensional ‘‘cubes’’ consist of many 2-dimensional images of Ceres; the third dimension is wavelength, with one image for each wavelength channel). As already discussed by Carry et al. (2010), the grazing viewing angle near Ceres’ limb causes unreli-able flux measurement for the outer annulus of the asteroid’s apparent disk. Therefore, we restricted our study to a ‘‘region of interest’’ (ROI), covering the innermost portion of the apparent disk. The ROI was defined to be the central region of the disk, with-in 75% of Ceres’ radius, (followwith-ingCarry et al., 2008).
Each spectrum extracted within the ROI was divided by the spectrum of a standard star, taken close in time and in airmass (see Tables 1 and 2), to ensure the best possible correction for atmospheric effects, particularly water vapor. Remaining bad pix-els and cosmic rays were removed by applying a median filter to the reflectance spectra. The box size was set to 5 pixels, corre-sponding to 0.7 and 2.5 nm for J and H + K gratings respectively. This width is narrow enough to have no influence on the detection of absorption bands (resolving power remains of several hun-dreds). The spectra are normalized to unity at 1.17
lm and
1.50
lm, respectively. These reflectance spectra are plotted for
each epoch inFigs. 1 and 2.3. Spectral analysis
Our observations covered most of Ceres’s low-latitude regions (seeTable 1, andFig. 3). In both wavelength ranges, we observe very little deviation from the average (seeFigs. 1 and 2). To quan-tify precisely how the different reflectance spectra behave with re-spect to the average, we utilized the two following norms, sensitive to spectral deviation (i.e., presence of absorption band), that we ap-plied to all the spectra of each image-cube (both J and H + K; spec-tra within the ROI) before (casea) and after (case b) division by their spectral slope (continuum, re-normalized to unity at 1.17
lm and 1.50
lm, see Section
2):r
i¼ P kðSi1Þ P kðS I 1Þ ð1Þv
2 i ¼ P kðSi1Þ2 P kðS I 1Þ2 ð2Þwhere
r
iandv
2i are the reduced ‘‘deviation’’ and ‘‘chi-square’’ norms,SI
the slope-removed spectrum used to estimate the noise,Sithe spectrum normalized by the disk-integrated average spectrum (all the spectra within the ROI); the subscript i standing for casesa
andb.
Because both norms are reduced (i.e., they are normalized by a measure of the noise), they give the level of confidence at which a variation from the disk-integrated average spectrum is detected: a spectrum equal to the average spectrum at all wavelengths has a norm of 0, and a spectrum whose deviations to the average spec-trum are smaller than its intrinsic noise will have a norm below 1.
Table 2
Observing circumstances for standard stars. For each observation, we report the mid-observation time in UT, the airmass (X), the seeing (s), and the size of the resolution element, measured as the FWHM of the stars (H), for each band: J, H, and K (i.e., at 1.22, 1.60, and 2.2lm). The theoretical angular resolution (defined here as the diffraction limitk/D, withkthe wavelength andDthe telescope aperture) is also reported. The average FWHMs of the PSFs correspond to spatial resolutions of 55, 71, and 98 km respectively (projected to the distance of Ceres). The observation marked with a dagger ( ) corresponds to the single observation of HD 28099.
Time (UT) Grating X s(00) H
J(00) HH(00) HK(00) 00:34 J 1.82 0.72 0.030 – – 01:44 J 1.39 1.33 0.042 – – 02:47 J 1.23 0.75 0.045 – – 03:47 J 1.19 n.a. 0.042 – – 06:05 J 1.34 0.58 0.047 – – 07:02 J 1.92 0.53 0.043 – – 00:23 H + K 1.92 0.64 – 0.049 0.076 01:36 H + K 1.42 1.24 – 0.054 0.069 02:41 H + K 1.24 0.73 – 0.052 0.070 03:41 H + K 1.19 n.a. – 0.057 0.068 05:58 H + K 1.34 0.54 – 0.054 0.080 06:56 H + K 1.87 0.55 – 0.053 0.076 Average 0.041 0.052 0.073 Theoretical 0.031 0.041 0.057 Deviation 0.006 0.003 0.005
Fig. 1.Reflectance spectra obtained with the J grating. For each epoch, the average spectrum (black line) and all the individual spectra within the ROI (dark-gray area) are plotted. The wavelength ranges affected by telluric absorptions (i.e., the limits of the J-band) are displayed in light gray and the spectra are omitted for clarity. The mid-observation time (UT time on 2007 November 13) and the longitude of the sub-Earth point (SEPk, seeTable 1) are reported for each epoch.
We applied the norms before (a) and after (b) slope removal to test if the spectral variation was mainly a slope variation or if it could also be due to the presence of absorption bands.
We display inFig. 4the distribution of these two norms, com-puted for the 10 619 and 22 755 individual spectra obtained with the J and H + K gratings respectively. First, both distributions are sharper, and mostly below 1, after slope removal (caseb) than be-fore (casea). This computation highlights the small spectral varia-tion, mostly due to slope variavaria-tion, of each spectrum with respect to the average one.
We then focused our attention on spectra with
v
2bnorm above 1, to check whether the variation is real or due to an instrumental artifact, and if real whether the variation is due to the repeated presence of an absorption band. Reflectance spectra with higher norms appeared at fixed positions on the SINFONI detector, instead of following the rotation of Ceres. We thus conclude on the absence of absorption band in J, H and K-band wavelengths at our noise le-vel (1
r
): 3.7% in J, 1.4% in H, and 1.8% in K. Considering the depth of the characteristics absorption bands of water ice, centered at 1.6 and 2.2lm, this sets an upper limit of approximately 1% for ice
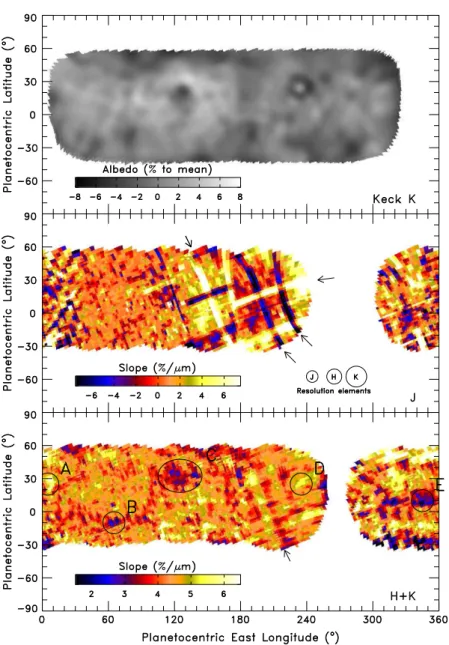
frost geometric coverage.We finally investigated the spatial distribution of the spectral slope variation. For each spatial pixel, we computed the spectral slope, and mapped it onto an Equidistant Cylindrical Projection (ECP) (Fig. 5), following Carry et al. (2010). The slope variations were reproduced from image cube to image cube, and were thus linked to the instrument. We corrected this cosmetic problem by subtracting an average slope map at each image cube. The first observations of the night were more affected by this noise pattern, and some residuals are still present in the slope maps presented in
Fig. 5, between 120°and 240°East in J, and between 180°and 250°
East in H + K (corresponding to high-airmass observations, see
Fig. 3andTable 1). The slope information at these location is not reliable, and interpretations must be cautious.
No slope variations are detected in the J-band wavelength range, all the deviations to the average spectral slope (neutral be-tween 1.10 and 1.35
lm) appearing suspicious. We, however,
de-tect possible genuine variations (slope only) over the H + K wavelength range in five regions, labeled A–E (Fig. 5). Three of them (B, C, and E) present a lower spectral slope (about 2%/lm) than the surroundings (the average spectral slope of Ceres in that wavelength range is of about 4%/lm). These location are associated with low-albedo markings at visible and near-infrared wave-lengths: feature #7, central part of #2, and East of #6 in Fig. 5 byLi et al. (2006) and features d1 and d3 in Fig. 7 by Carry et al. (2008). The other two features (A and D) have higher spectral slopes (above 5%/lm) and are associated with high albedo mark-ings: features #1 and #5 in Fig. 5 byLi et al. (2006)and feature b4in Fig. 7 byCarry et al. (2008).
Feature D is one of the highest slopes measured in the J-band map, although it falls on one of the main noise residuals. It corre-sponds to the dark feature with a central bright peak seen in the near-infrared images (Carry et al., 2008). If this round-shaped fea-ture is associated with an impact crater, the observed differences in reflectivity and spectral slope may be related to differences in surface age (‘‘fresher’’ material excavated), or regolith properties (different packing). Given the relative lack of constrains on the sur-face composition of Ceres, we cannot assert the causes of these variations. We only report here on the detection of spectral slope variations correlated to albedo markings.
4. Discussion
The handful of features detected here contrasts with the wealth of albedo markings reported by Li et al. (2006) and Carry et al. (2008)based on broad-band photometry in the visible and near-infrared with HST/ACS and Keck/NIRC2, respectively. However, both analyses used deconvolution techniques, which enhance the spatial resolution and photometric contrast. The data presented here still suffers from aberrations introduced by the not fully-cor-rected atmospheric turbulence, and non-perfect optics of the instrument and telescope. The encircled energy within a resolution element (the core of the PSF, corresponding to about 75 km on the surface of Ceres) will thus only be a portion of the total energy.
Fig. 2.Reflectance spectra obtained with the H + K grating. For each epoch, the average spectrum (black line) and all the individual spectra with the ROI (dark-gray area) are plotted. The wavelength ranges affected by telluric absorptions (i.e., the limits of the H- and K-bands) are displayed as the light gray area and the spectra are omitted for clarity. The mid-observation time (UT time on 2007 November 13) and the longitude of the sub-Earth point (SEPk, seeTable 1) are reported for each epoch.
Absorption features at 2.05lm visible in spectra taken at 00:48, 00:58, and 07:10 are telluric absorption not fully-corrected due to the high airmass of Ceres during the observations.
The information is thus spread out and averaged with nearest-neighbor pixels, lowering the photometric contrast (albedo varia-tions are barely distinguishable on non-deconvolved images of Ceres used byCarry et al. (2008)although being perfectly distin-guishable after deconvolution). This highlights the need for decon-volution algorithms for spectro-imaging.
Nevertheless, the apparent homogeneity of the surface compo-sition of Ceres might be consistent with the hypothesis of a differ-entiated interior.McCord and Sotin (2005)have suggested that a
thin ice-silicate crust would be probably unstable if it overlays a less dense liquid–water layer. In this case, the crust would tend to break up and founder probably soon after the liquid–water man-tle formed in the first tens of Myr after formation. A new crust would then quickly freeze out and thus resurface Ceres by mixing and/or depositing minerals on the surface, erasing major albedo and morphological features (Li et al., 2006; Carry et al., 2008). If this mixing was efficient, then the surface of Ceres may have ac-quired a homogeneous composition at early epochs of its evolu-tion. Alternatively, this homogeneity could be also explained by resurfacing processes induced by (ancient or more recent) cryovol-canism (Castillo-Rogez and McCord, 2010). In both scenarios, the short sublimation timescale of the ice brought to the surface of the asteroid makes its detection unlikely.
5. Conclusion
We present the first disk-resolved spectroscopic observations of dwarf-planet (1) Ceres in the near-infrared (1.1–2.4
lm). Our
observations used SINFONI on the ESO Very Large Telescope and had an angular resolution of about 0.05000, corresponding to 75 km on the surface of Ceres, and a spectral resolving power of about 1500.We did not detect any absorption band at the 3.0%, 1.2%, and 1.3% levels in J, H and K bands, respectively. Variations of the spec-tral slope are observed over the surface, with dark and bright albe-do markings (few percent variations detected from visible and near-infrared imaging, seeLi et al., 2006; Carry et al., 2008) pre-senting respectively a lower and higher spectral slope (couple of percent per micron) than the surroundings. The surface of Ceres
Fig. 4.Reduced deviation (r, left) and chi-square (v2
, right) norms distribution for both J (top) and H + K (bottom) spectra, before (casea, gray histogram) and after (caseb, black histogram) slope removal.
Fig. 3.Equidistant Cylindrical Projections showing the coverage of our observations (ROI only) on Ceres’ surface. Each image cube is delimited by a black contour and shaded as a function of airmass at the time of the observation (Table 1). The observing time of each image cube is reported near its eastern border.Top: the 7 image cubes using the J grating. Filled and empty circles (arbitrary size), labeled with UT times, indicate the rotational phase of Ceres at the observation time of the standard stars with the H + K and J grating, respectively.Bottom: the 15 image cubes using the H + K grating. The size of the resolution elements at each wavelength range (55, 71, and 98 km at J, H, and K-band) are represented here, as if projected on Ceres equator.
is thus remarkably homogeneous at our spatial and spectral resolutions.
Acknowledgments
This research used IMCCE’s Miriade VO tool and NASA’s Astro-physics Data System. A great thanks to all the developers and maintainers. B.C. and P.V. thank the ESA Visiting Scientist Program. E.J. and J.M. are Research Associate and Research Director of the FRS-FNRS, Belgium. We thank both anonymous referees for their valuable comments that helped us in improving this manuscript. References
Altenhoff, W.J., Baars, J.W.M., Schraml, J.B., Stumpff, P., von Kap-Herr, A., 1996. Precise flux density determination of 1 Ceres with the Heinrich–Hertz– Telescope at 250 Hz. Astron. Astrophys. 309, 953–956.
Bonnet, H. et al., 2004. First light of SINFONI at the VLT. The Messenger 117, 17–24. Carry, B. et al., 2008. Near-Infrared Mapping and Physical Properties of the
Dwarf-Planet Ceres. Astron. Astrophys. 478 (4), 235–244.
Carry, B., Vernazza, P., Dumas, C., Fulchignoni, M., 2010. First disk-resolved spectroscopy of (4) Vesta. Icarus 205, 473–482.
Castillo-Rogez, J.C., McCord, T.B., 2010. Ceres: evolution and present state constrained by shape data. Icarus 205, 443–459.
Chamberlain, M.A., Sykes, M.V., Esquerdo, G.A., 2007. Ceres lightcurve analysis period determination. Icarus 188 (2), 451–456.
Chamberlain, M.A., Lovell, A.J., Sykes, M.V., 2009. Submillimeter photometry and lightcurves of Ceres and other large asteroids. Icarus 202, 487–501.
Drummond, J.D., Christou, J.C., 2008. Triaxial ellipsoid dimensions and rotational poles of seven asteroids from Lick observatory adaptive optics images, and of Ceres. Icarus 197, 480–496.
Eisenhauer, F. et al., 2003. SINFONI – Integral field spectroscopy at 50 milli-arcsecond resolution with the ESO VLT. SPIE 4841, 1548–1561.
Kovacˇevic´, A., Kuzmanoski, M., 2007. A new determination of the mass of (1) Ceres. Earth Moon Planets 100, 117–123.
Li, J.-Y. et al., 2006. Photometric analysis of 1 Ceres and surface mapping from HST observations. Icarus 182, 143–160.
McCord, T.B., Sotin, C., 2005. Ceres: Evolution and current state. J. Geophys. Res. (Planets) 110, 5009–5023.
Milliken, R.E., Rivkin, A.S., 2009. Brucite and carbonate assemblages from altered olivine-rich materials on Ceres. Nat. Geosci. 2, 258–261.
Minton, D.A., Malhotra, R., 2009. A record of planet migration in the main asteroid belt. Nature 457, 1109–1111.
Modigliani, A. et al., 2007. The SINFONI pipeline. Astrophysics. ArXiv e-prints.
Fig. 5.Equidistant Cylindrical Projection maps of the spectral slope measured in J (middle) and H + K (bottom) wavelength ranges, compared with the K-band albedo map (top) fromCarry et al. (2008). The size of the resolution elements at each wavelength range (55, 71, and 98 km at J, H, and K-band) are represented here (middle map), as if projected on Ceres’ equator. No features above the noise level are reliably seen in the J-band map, and most of the small-scale features seen in H + K are likely noise. There are five regions where the slope deviates from the average (about 4%/lm in H + K), labeled from A to E on the H + K map. The main uncorrected noise patterns (stripes crossing the field of view) are highlighted with arrows (see text).
Morbidelli, A., Bottke, W.F., Nesvorny´, D., Levison, H.F., 2009. Asteroids were born big. Icarus 204, 558–573.
Moullet, A., Gurwell, M., Carry, B., 2010. Thermal rotational lightcurve of dwarf-planet (1) Ceres at 235 GHz with the submillimeter array. Astron. Astrophys. 516, L10.
Mousis, O. et al., 2008. Origin of volatiles in the main belt. Mont. Notices Roy. Astron. Soc. 383, 1269–1280.
Nazzario, R., Hyde, T.W., Barge, L., 2003. Dust grain orbital behavior around ceres. Adv. Space Res. 31, 2591–2597.
Parker, J.W. et al., 2002. Analysis of the first disk-resolved images of Ceres from ultraviolet observations with the hubble space telescope. Astron. J. 123, 549– 557.
Rivkin, A.S. et al., 2010. The surface composition of Ceres. Space Sci. Rev. 101, 1–22. Rivkin, A.S., Volquardsen, E.L., 2010. Rotationally-resolved spectra of Ceres in the
3-lm region. Icarus 206, 327–333.
Rivkin, A.S., Volquardsen, E.L., Clark, B.E., 2006. The surface composition of Ceres: Discovery of carbonates and iron-rich clays. Icarus 185, 563–567.
Rousselot, P. et al., 2011. A search for water vaporization on Ceres. Astron. J. 142, A125.
Russell, C.T. et al., 2004. Dawn: A journey in space and time. Planet. Space Sci. 52, 465–489.
Tedesco, E.F. et al., 1983. Worldwide photometry and lightcurve observations of 1 Ceres during the 1975–1976 apparition. Icarus 54, 23–29.
Thomas, P.C. et al., 2005. Differentiation of the asteroid Ceres as revealed by its shape. Nature 437, 224–226.
Vernazza, P. et al., 2005. Analysis of near-IR spectra of 1 Ceres and 4 Vesta, targets of the Dawn mission. Astron. Astrophys. 436, 1113–1121.
Zolotov, M.Y., 2009. On the composition and differentiation of Ceres. Icarus 204, 183–193.