Comparison of the Clinical
sensitivity of the Idylla platform
and the oncoBeAM RAs CRC Assay
for KRAs Mutation Detection in
Liquid Biopsy samples
Ana Vivancos
1, enrique Aranda
2, Manuel Benavides
3, elena Élez
4,
Maria Auxiliadora Gómez-españa
2, Marta toledano
5, Martina Alvarez
6,
Maria Rosario Chica parrado
6, Vanesa García-Barberán
7& eduardo Diaz-Rubio
7KRAS mutations are common in colorectal cancer (CRC). In this setting, mutation status determination in circulating-free DNA from blood samples (liquid biopsy) has been shown to be a viable alternative to tissue testing. the objective of this study was to compare the sensitivity of two liquid biopsy methods for detecting KRAS mutations in plasma samples from metastatic CRC patients. samples with a positive (KRAs-MUt+) result and a mutant allelic fraction (MAF) < 5% according to the OncoBEAM RAS CRC assay were pairly analyzed by the Idylla ctKRAs Mutation test (n = 116). In a cohort of 71 patients with at least 1 year of follow-up, the progression-free survival (PFS) was determined according to MAF values. Idylla detected KRAS mutations in 81/116 OncoBEAM KRAS-MUT+ samples with MAF < 5% and in 48/79 samples with MAF < 1%. Concordance between OncoBEAM and Idylla significantly improved at higher MAF values. PFS rates at 6 and 12 months tended to be lower in patients with MAF levels between 1% and 5% than in those with levels <1%. OncoBEAM demonstrated greater sensitivity for plasma detection of KRAS mutations than Idylla. Importantly, our data identified a “gray zone” below 1% MAF where Idylla showed reduced KRAS mutation detection, highlighting the importance of an accurate method to provide the mutational status of CRC patients.
International guidelines recommend testing for hotspot mutations in the rat sarcoma viral oncogene homolog (RAS) gene family, including the kirsten RAS (KRAS) and neuroblastoma RAS (NRAS) proto-oncogenes, to exclude RAS mutation-positive metastatic colorectal cancer (mCRC) patients from receiving anti-epidermal growth factor receptor (EGFR) therapy1,2. This is because anti-EGFR agents do not provide meaningful survival
benefits versus anti-angiogenic/chemotherapy regimens in mCRC patients whose tumors are not wild type (WT) with respect to RAS genes3–6. Accurate detection of RAS mutations in these patients is therefore of high clinical
importance for therapy selection. Traditionally, formalin-fixed paraffin-embedded (FFPE) tumor samples have been used to determine the RAS mutation status of CRC patients in routine clinical practice. However, RAS status determination in circulating-free DNA from blood samples (known as liquid biopsy) has been shown to be a viable alternative to FFPE sample testing7–11. The use of liquid biopsy RAS mutation tests that lack the necessary
sensitivity may lead to mischaracterization of mCRC patients as WT and in turn may diminish patient response to anti-EGFR therapy and lead to worse outcomes. Therefore, a direct comparison of available methods for RAS
1Cancer Genomics Group, Vall d’Hebron Institute of Oncology, Barcelona, Spain. 2Department of Medical Oncology, Reina Sofía University Hospital, CIBERONC, Córdoba, Spain. 3Department of Medical Oncology, Hospital Universitario Regional y Virgen de la Victoria, Málaga, Spain. 4Department of Medical Oncology Vall d’Hebron Institute of Oncology (CIBERONC), Barcelona, Spain. 5IMIBIC Instituto Maimonides Investigación Biomédica de Córdoba, Córdoba, Spain. 6Laboratorio de Biología Molecular del Cáncer. Centro de Investigaciones Médico Sanitarias, Universidad de Málaga, Málaga, Spain. 7Laboratorio de Investigación Traslacional, IdISSC, Hospital Clínico San Carlos, CIBERONC, Madrid, Spain. Correspondence and requests for materials should be addressed to A.V. (email: [email protected])
Received: 28 February 2019 Accepted: 7 June 2019 Published: xx xx xxxx
mutation status from liquid biopsy samples is warranted in order to evaluate the relative performance during routine clinical practice.
Several different platforms are available to perform blood-based RAS mutation analysis and each has varying levels of performance representative of the underlying test methodology. From an analytical standpoint, it is well established that digital PCR (dPCR) technologies inherently provide greater sensitivity than quantitative PCR (qPCR) techniques for somatic mutation detection12,13. The Idylla ctKRAS Mutation Test is a qPCR assay that
has an analytical sensitivity of ≤1% for KRAS mutations in exons 2 and 3 and ≤5% for mutations in exon 414.
The OncoBEAM RAS CRC15 is a dPCR assay that detects mutations in both KRAS and NRAS oncogenes with
an analytical sensitivity determined to be <0.02% mutant allelic fraction (MAF)16. The main goal of the present
study was to evaluate the sensitivity of these two liquid biopsy methods for detecting KRAS mutations in plasma samples from mCRC patients, both of which detect mutations in codons 12, 13, 59, 61, 117 and 146 of the KRAS
gene. In addition, we examined the clinical sensitivity of Idylla and OncoBEAM plasma KRAS mutation detec-tion at <1% MAF by comparing plasma mutadetec-tional analysis obtained by both platforms to those obtained by standard-of-care (SOC) FFPE tumor RAS testing on paired primary tumor tissue specimens.
Results
patient cohort and samples for analysis.
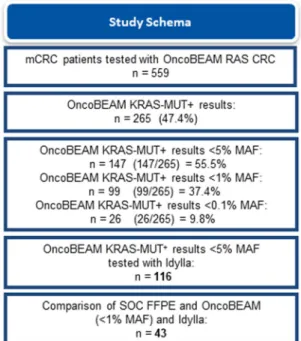
A total of 559 mCRC patients met the selection criteria. Median age was 66.9 years (range, 36–80) and the majority of them (97.3%) had colorectal adenocarcinoma. The most frequent site of metastasis was the liver (74.6%) followed by the lung (33.8%). Among the 559 plasmasamples tested with the OncoBEAM RAS CRC assay, 265 (47.4%) were KRAS-MUT+, of which 147 (55.5%) had
MAF < 5%. The 1-ml plasma requirement for Idylla testing could only be met for 116 out of the 147 samples, so the comparative analysis included only these 116 patients that were analyzed by the two liquid biopsy methods. SOC FFPE KRAS testing results on primary tumor specimens were only available for 43 KRAS-MUT+ patients with MAF values < 1% at the hospital centers performing OncoBEAM testing (Fig. 1).
Concordance in mutation status between oncoBeAM and Idylla.
The proportions of mutated sam-ples at 3 different OncoBEAM-determined MAF% value ranges are shown in Table 1. Idylla detected KRAS muta-tions in 81 out of 116 OncoBEAM KRAS-MUT+ samples with MAF <5%, resulting in a PPA of 69.8%. Idylla detected KRAS mutations in 48 out of 79 OncoBEAM KRAS-MUT+ samples with MAF <1%, with a PPA of 60.7%. Concordance between OncoBEAM and Idylla significantly improved at higher MAF values.MAF and pFs.
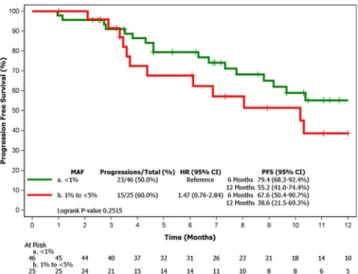
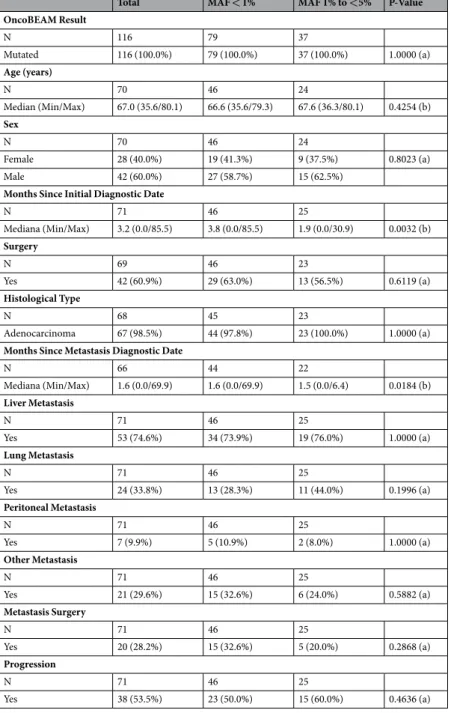
PFS rates at 6 and 12 months were lower in patients with MAF levels between 1% and 5% than in those with levels <1% (Fig. 2), although the difference was not statistically significant (Hazard Ratio 1.47, 95% CI 0.76–2.84). Selected characteristics of patients with MAF < 1% and 1–5% are shown in Table 2.Liquid biopsies versus tissue-based methods.
Idylla ctKRAS and OncoBEAM plasma testing results were compared with KRAS mutation results obtained by SOC FFPE tumor tissue testing in 43 mCRC patientsthat were OncoBEAM KRAS-MUT+ with MAF values <1%. The median time between tissue sampling and
blood sampling was 247 days. The overall agreement (concordance) of OncoBEAM vs SOC FFPE KRAS testing results was 31/43 or 72.1%, whereas concordance of Idylla with SOC FFPE KRAS results was 20/43 or 46.5% Figure 1. Flow chart of sample availability and analysis. Abbreviations: FFPE: formalin-fixed
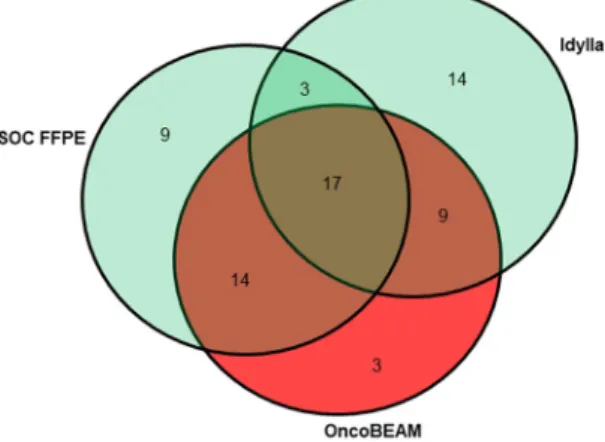
(p = 0.0275). Idylla ctKRAS testing showed WT results in 14 out of 31 patients that were called KRAS-MUT+ by both OncoBEAM and SOC. Eight out of these 14 discordant cases were seen in patients with liver metastases (see Fig. 3 for further description of the mutation status determined by the three methods). Both Idylla and OncoBEAM calls were RAS-MUT+ in 9 out of 12 patients determined to be WT by tissue analysis (Fig. 4).
Discussion
The accurate detection of hotspot mutations in the KRAS gene is integral to the diagnostic workup of mCRC patients to inform the appropriate use of targeted therapy2. A number of blood-based methods to detect KRAS
mutations are currently available for clinical use17, though their head-to-head performance has previously
not been directly compared. In the present study, results from the OncoBEAM RAS CRC mutation test were compared with the results obtained by the Idylla ctKRAS assay from paired plasma samples of mCRC patients analyzed by the two platforms. We only included those samples in which OncoBEAM had positive results (KRAS-MUT+) and MAF values were <5%, in order to examine the clinical sensibility at lower MAF. Patients with mCRC have been shown to exhibit a range of MAF values across newly diagnosed patients with primary tumor intact and those presenting with recurrent disease7,18. In cases with MAF < 1% by OncoBEAM, plasma
mutational analysis was also compared to tissue-based methods on paired primary tumor specimens in order to independently examine the clinical sensitivity of Idylla and OncoBEAM plasma KRAS mutation detection.
The KRAS mutation frequency of 47.4% as determined by the OncoBEAM kit is in agreement with previ-ously published reports of KRAS mutations in mCRC patients6,7,19. Overall, Idylla detected mutations in 69.8% of
OncoBEAM KRAS-MUT+ samples, with higher concordance between the two methods at higher MAF levels.
OncoBEAM has been shown to detect mutations as low as 0.02% MAF16, whereas the reported Idylla KRAS
detection sensitivity is ≤1% MAF14. This means that most of the samples with low MAF analyzed by the Idylla
ctKRAS kit will result in false-negative KRAS WT results and patients would inappropriately receive anti-EGFR therapy. In this scenario, the use of Idylla may incorrectly select patients for anti-EGFR therapy, exposing patients to undue side effects, increased medical costs, and worse outcomes due to lack of demonstrated clinical benefit of anti-EGFR therapy in patients with RAS mutations. Accordingly, the testing with Idylla ctKRAS resulted in a 16.9% reduction in clinical sensitivity for KRAS mutation detection vs SOC FFPE and OncoBEAM plasma testing. Since 37.4% of the 559 mCRC patients in this study were KRAS-MUT+ <1% MAF using OncoBEAM, it is estimated that a 16.9% drop in clinical sensitivity by Idylla might result in false negative calls for 45 out of 559 patients in this study. Even in cases of liver metastases, supposed to have greater shedding properties due to high vascularization19,20, Idylla was not able to detect KRAS mutations in 8 of 22 patients with tissue mutated status.
Total MAF < 0.1% MAF 0.1% to <1% MAF 1% to <5% P-Value
N 116 16 63 37
OncoBEAM Result: Mutated 116 (100.0%) 16 (100.0%) 63 (100.0%) 37 (100.0%) 1.0000 (a) ldylla result: Mutated 81 (69.8%) 7 (43.8%) 41 (65.1%) 33 (89.2%) 0.0005 (a) p-value OncoBEAM vs ldylla (b) <0.0001 0.0077 <0.0001 0.1336
Table 1. Comparison of Idylla and OncoBEAM KRAS mutation detection rates in plasma at different MAF %. (a) Exact-Mantel-Haenszel; (b) paired McNemar Test. Abbreviations: MAF, mutated allele fraction.
Figure 2. Kaplan-Meier curve of PFS according to MAF levels by BEAMing in plasma samples (n = 71).
Abbreviations: CI: confidence interval; HR: hazard ratio; MAF: mutant allele fraction; PFS: progression-free survival.
While OncoBEAM exhibited superior clinical sensitivity when compared to Idylla on replicate samples across MAF values, 12 out of 43 patients that were KRAS-MUT+ by OncoBEAM at <1% MAF were WT by SOC FFPE tissue testing. Our initial suspicion was that these low MAF samples might be false positives determined by OncoBEAM, but 9 out of 12 were also determined to be KRAS-MUT+ by Idylla. Although these data represent a small subset, it lends support to the conclusion that some of these patients may in fact be KRAS-MUT+ and were missed by SOC tissue testing either due to molecular heterogeneity or an insufficiency of the tissue muta-tion method. Testing of DNA from a single primary tumor tissue block may wrongly assign KRAS WT status in 8–11.6% of patients21,22. When inter-tumor heterogeneity between primary tumors and metastases is examined
there is frequent mutational discordance23,24, and tumor genomic evolution likely occurring between tissue and
blood sampling can also contribute to discordant results. Thus, the use of liquid biopsy methods is a valuable alternative to tissue-based testing to identify patients eligible for anti-EGFR therapy in routine clinical practice, avoiding the sample bias associated with intra- and inter-tumor heterogeneity. In addition, serial circulating tumor DNA (ctDNA) analysis enables monitoring of genomic changes during therapy and profiling of the global status of genomic alterations across different sites of disease25.
Testing for extended RAS mutation status is now vital component of routine standard of care workup for newly diagnosed mCRC patients, which includes hotspots regions of both KRAS and NRAS genes2,26. Since
Total MAF < 1% MAF 1% to <5% P-Value OncoBEAM Result N 116 79 37 Mutated 116 (100.0%) 79 (100.0%) 37 (100.0%) 1.0000 (a) Age (years) N 70 46 24 Median (Min/Max) 67.0 (35.6/80.1) 66.6 (35.6/79.3) 67.6 (36.3/80.1) 0.4254 (b) Sex N 70 46 24 Female 28 (40.0%) 19 (41.3%) 9 (37.5%) 0.8023 (a) Male 42 (60.0%) 27 (58.7%) 15 (62.5%)
Months Since Initial Diagnostic Date
N 71 46 25 Mediana (Min/Max) 3.2 (0.0/85.5) 3.8 (0.0/85.5) 1.9 (0.0/30.9) 0.0032 (b) Surgery N 69 46 23 Yes 42 (60.9%) 29 (63.0%) 13 (56.5%) 0.6119 (a) Histological Type N 68 45 23 Adenocarcinoma 67 (98.5%) 44 (97.8%) 23 (100.0%) 1.0000 (a) Months Since Metastasis Diagnostic Date
N 66 44 22 Mediana (Min/Max) 1.6 (0.0/69.9) 1.6 (0.0/69.9) 1.5 (0.0/6.4) 0.0184 (b) Liver Metastasis N 71 46 25 Yes 53 (74.6%) 34 (73.9%) 19 (76.0%) 1.0000 (a) Lung Metastasis N 71 46 25 Yes 24 (33.8%) 13 (28.3%) 11 (44.0%) 0.1996 (a) Peritoneal Metastasis N 71 46 25 Yes 7 (9.9%) 5 (10.9%) 2 (8.0%) 1.0000 (a) Other Metastasis N 71 46 25 Yes 21 (29.6%) 15 (32.6%) 6 (24.0%) 0.5882 (a) Metastasis Surgery N 71 46 25 Yes 20 (28.2%) 15 (32.6%) 5 (20.0%) 0.2868 (a) Progression N 71 46 25 Yes 38 (53.5%) 23 (50.0%) 15 (60.0%) 0.4636 (a)
Table 2. Patients characteristics according to MAF values determined by OncoBEAM assay. (a) Exact-Fisher; (b) Student T-test. Abbreviations: MAF, mutated allele fraction.
Patient Sex N = Stg. IV newly-diag.R = Recurrent SOC FFPE KRAS result OncoBEAM result (MAF %) Idylla ctKRAS result Location of metastases
1 M N WT KRAS12 (1.00) WT LUNG
2 M R WT KRAS13 (0.96) KRAS13 PERITONEAL
3 M R MUT KRAS12 (0.94) KRAS12 LUNG
4 M R MUT KRAS12 (0.92) KRAS12 LIVER + OTHER
5 M N WT KRAS12 (0.91) KRAS12 LIVER + OTHER
6 F N MUT KRAS13 (0.89) KRAS13 LIVER + OTHER
7 M R MUT KRAS12 (0.88) KRAS12 LIVER + OTHER
8 F N MUT KRAS12 (0.88) KRAS12 LIVER + OTHER
9 F N MUT KRAS12 (0.84) KRAS12 LIVER + OTHER
10 M R MUT KRAS12 (0.79) KRAS12 LIVER + OTHER
11 M N MUT KRAS12 (0.67) KRAS12 LIVER
12 M N MUT KRAS61 (0.62) KRAS61 LUNG
13 M N WT KRAS12 (0.62) KRAS12 LIVER
14 M N WT KRAS12 (0.56) KRAS12 LIVER + OTHER
15 M R MUT KRAS12 (0.34) WT OTHER
16 F N MUT KRAS12 (0.28) WT LIVER
17 F N MUT KRAS13 (0.24) KRAS13 LIVER
18 F R MUT KRAS12 (0.23) KRAS12 LIVER
19 M N MUT KRAS12 (0.23) KRAS12 LIVER + LUNG
20 M R MUT KRAS61 (0.22) WT LIVER
21 F R WT KRAS61 (0.22) KRAS61 LIVER
22 F N MUT KRAS12 (0.21) KRAS12 LUNG
23 M N MUT KRAS12 (0.21) KRAS12 LIVER + OTHER
24 F N MUT KRAS12 (0.20) WT LIVER
25 F N MUT KRAS12 (0.20) WT LUNG, PERITONEAL
26 F N MUT KRAS13 (0.19) WT PERITONEAL
27 M N MUT KRAS12 (0.16) WT LIVER, PERITONEAL
28 M N MUT KRAS13 (0.16) WT LIVER + LUNG
29 M R WT KRAS61 (0.16) KRAS61 LUNG
30 M R WT KRAS12 (0.15) KRAS12 LIVER
31 F N MUT KRAS146 (0.15) WT LIVER
32 F N MUT KRAS12 (0.14) WT PERITONEAL, OTHER
33 F N MUT KRAS12 (0.11) KRAS12 LIVER
34 M R WT KRAS12 (0.11) KRAS12 LIVER
35 M R MUT KRAS12 (0.09) WT LUNG
36 F R MUT KRAS12 (0.08) WT LUNG + OTHER
37 F R WT KRAS12 (0.07) WT OTHER
38 M N MUT KRAS12 (0.06) WT LIVER
39 F R MUT KRAS12 (0.03) WT LIVER + LUNG
40 M N MUT KRAS12 (0.03) KRAS12 LIVER
41 F N WT KRAS61 (0.02) WT LIVER + OTHER
42 M N WT KRAS12 (0.01) KRAS12 LIVER, PERITONEAL
43 M N MUT KRAS13 (0.004) KRAS13 LIVER
Figure 3. Descriptive summary of plasma and tissue mutation results (n = 43). Concordant and discordant
results are highlighted in green and red, respectively. Discordance between Idylla vs OncoBEAM and SOC testing in patients with liver metastases are highlighted in yellow. Examples where both OncoBEAM and Idylla agree on KRAS-MUT+ call, but disagree with the SOC WT result are highlighted in orange. Abbreviations: F, female FFPE, formalin-fixed paraffin-embedded; M, male MAF, mutant allele fraction; MUT, mutated; SOC, standard of care; WT, wild-type.
Figure 4. Venn diagram showing the numbers of KRAS mutated and wild-type samples according to the
approximately 50% of the tested samples will return a WT KRAS result, these samples should also be tested for
NRAS mutations. Therefore, it is valuable an extended RAS test to detect not only KRAS mutations but also NRAS
mutations. The OncoBEAM RAS CRC kit evaluates both KRAS and NRAS mutations concurrently whereas Idylla testing for KRAS and NRAS is split into two different test runs to be performed sequentially. For both methods, the incorporation of the RAS mutational status in the initial histological report is now possible, enabling rapid initiation of targeted therapy and global assessment of tumor mutation status in newly diagnosed metastatic patients. An advantage of the BEAMing technology is its quantitative nature and high sensitivity. It has been shown that high RAS ctDNA MAF is associated with low survival27, so ctDNA levels as reflection of tumor load
could provide valuable information to predict the disease evolution in RAS mutant patients prior to, during, or following treatment28,29.
This concept of MAF as a prognostic tool is consistent with our prior investigations and supported by the observation that patients with higher abundant KRAS mutations (MAF ≥ 1%) had a shorter PFS compared with those carrying low abundant KRAS mutations (MAF < 1%)19. Moreover, rapid progressors in our study had
sig-nificantly higher MAF than slower progressors. This information can be readily incorporated to inform the cli-nician of those patients that may be “high risk” and require more intense treatment and radiological follow-up. As ctDNA can reveal occult metastatic disease that is not evident on radiological imaging30, we are now able to
identify CRC patients at high risk of metastatic relapse and/or local recurrence, which is consistent with studies showing that ctDNA can signal residual disease after surgical resection31,32. It is unlikely that a single time-point
following surgery will identify all patients who are going to relapse, but longitudinal sampling may resolve this issue and improve the sensitivity30. Moreover, WT patients that do receive anti-EGFR therapy can be monitored
during treatment to detect acquired resistance due to RAS mutation emergence19,29,33.
Certain limitations exist in our study. One is the retrospective nature of the study and the lack of clinical infor-mation in a substantial proportion of patients, including the treatment they received and its potential effect on MAF values. Second, the small number of available tissue samples hindered a consistent comparison of concord-ance between plasma-based and tissue-based methods. Third, our data were limited to KRAS mutations, while we are now at the point where the technology should detect all RAS mutations beyond KRAS mutations, which is not the case for this Idylla kit. Finally, since there were no wild-type samples there was no evaluation of specificity, out of the scope of the study.
Conclusion
Given that the frequency of mutant DNA alleles in cell-free DNA is as low as 0.01%34, highly sensitive and specific
detection methods are required for ctDNA to deliver a clinically feasible and accurate approach. In this study, OncoBEAM demonstrated greater sensitivity for plasma detection of KRAS mutations than Idylla. Importantly, our data identified a “gray zone” below 1% MAF where Idylla shows reduced KRAS mutation detection accuracy vs OncoBEAM and SOC FFPE tumor KRAS testing. These findings serve as a reminder that liquid biopsy assays with diminished sensitivity may lack the dynamic range to provide the accurate mutational status to properly guide individualized anti-EGFR treatment decisions and risk stratification that may benefit patient outcomes.
Methods
study design and patients.
This was a multicenter, retrospective study performed in 4 Spanish centers from April 2016 to November 2017. The study was approved by the Institutional Review Board at each hospital (CEIC del Hospital Clínico San Carlos de Madrid, Comité de Ética de la Investigación Provincial de Málaga y CEIC Hospital Vall d’Hebron) and was conducted in accordance with the principles of the Declaration of Helsinki. Prior to the analysis, all patients signed informed consent accepting the use of their blood samples stored in the Biobank for research purposes. Data from adult patients with a diagnosis of mCRC were included in the analysis if KRAS mutation status was determined in plasma both by OncoBEAM and Idylla kits and OncoBEAM KRAS-MUT positive results were <5% MAF. Patients having surgery of primary tumor or metasta-sectomy or that received chemotherapy/biologic agents <2 months prior the blood draw were excluded.procedures.
Blood was collected in either Streck BCT or EDTA tubes and processed into plasma using meth-ods suitable for testing by both the OncoBEAM RAS CRC assay (3 mL) and the Idylla ctKRAS test (1 mL). Plasma samples were tested with OncoBEAM RAS CRC and KRAS mutant allele fraction was determined according to the kit’s instructions for use in those samples positive for KRAS mutation (KRAS-MUT+). Idylla testing was performed following the instructions and positive percent agreement (PPA) of KRAS-MUT+ results obtained by OncoBEAM and Idylla was calculated for patient samples having KRAS mutations at <5%, <1%, and <0.1% MAF by OncoBEAM. Due to the retrospective nature of the study, patient outcomes were available for a subset of patients and we determined the progression free survival (PFS) according to MAF values (1–5% vs <1%) in a cohort of 71 patients with at least 1 year of follow-up.Finally, the clinical sensitivity of Idylla and OncoBEAM was evaluated by comparing plasma mutational anal-ysis obtained by both methods on replicate samples to those obtained by standard-of-care (SOC) FFPE tumor
KRAS (pyrosequencing, QIAGEN) testing on paired primary tumor specimens of KRAS-MUT+ patients with
MAF values < 1% as determined by OncoBEAM.
statistical analysis.
Categorical variables were summarized in numbers and percentages, continuous var-iables were presented as medians, minima and maxima. Comparison of detection thresholds was performed using the exact Mantel-Haenszel test. The PPA was also calculated. Paired proportions were compared using McNemar’s test. Relationships between MAF levels and clinical pathological characteristics were assessed using the Fisher exact test and the Student t-test. Median PFS was calculated by Kaplan-Meier estimation and comparedwith the log‐rank test. A p-value lower than 0.05 was considered statistically significant. Statistical analyses were performed using the statistical software SAS version 9.4.
Data Availability
The datasets generated during and/or analysed during the current study are available from the corresponding author on reasonable request.
References
1. Allegra, C. J., Rumble, R. B. & Schilsky, R. L. Extended RAS gene mutation testing in metastatic colorectal carcinoma to predict response to anti-epidermal growth factor receptor monoclonal antibody therapy: American Society of Clinical Oncology Provisional Clinical Opinion Update 2015 Summary. J Oncol Pract 12, 180–181, https://doi.org/10.1200/jop.2015.007898 (2016).
2. Van Cutsem, E. et al. ESMO consensus guidelines for the management of patients with metastatic colorectal cancer. Ann Oncol 27, 1386–1422, https://doi.org/10.1093/annonc/mdw235 (2016).
3. Amado, R. G. et al. Wild-type KRAS is required for panitumumab efficacy in patients with metastatic colorectal cancer. J Clin Oncol
26, 1626–1634, https://doi.org/10.1200/jco.2007.14.7116 (2008).
4. Karapetis, C. S. et al. K-ras mutations and benefit from cetuximab in advanced colorectal cancer. N Engl J Med 359, 1757–1765,
https://doi.org/10.1056/NEJMoa0804385 (2008).
5. Douillard, J.-Y. et al. Panitumumab–FOLFOX4 treatment and RAS mutations in colorectal cancer. New Engl J Med 369, 1023–1034,
https://doi.org/10.1056/NEJMoa1305275 (2013).
6. Sorich, M. J. et al. Extended RAS mutations and anti-EGFR monoclonal antibody survival benefit in metastatic colorectal cancer: a meta-analysis of randomized, controlled trials. Ann Oncol 26, 13–21, https://doi.org/10.1093/annonc/mdu378 (2015).
7. Schmiegel, W. et al. Blood-based detection of RAS mutations to guide anti-EGFR therapy in colorectal cancer patients: concordance of results from circulating tumor DNA and tissue-based RAS testing. Mol Oncol 11, 208–219, https://doi.org/10.1002/1878-0261.12023 (2017).
8. Thierry, A. R. et al. Clinical utility of circulating DNA analysis for rapid detection of actionable mutations to select metastatic colorectal patients for anti-EGFR treatment. Ann Oncol 28, 2149–2159, https://doi.org/10.1093/annonc/mdx330 (2017). 9. Thierry, A. R. et al. Clinical validation of the detection of KRAS and BRAF mutations from circulating tumor DNA. Nat Med 20,
430–435, https://doi.org/10.1038/nm.3511 (2014).
10. Spindler, K. L., Pallisgaard, N., Vogelius, I. & Jakobsen, A. Quantitative cell-free DNA, KRAS, and BRAF mutations in plasma from patients with metastatic colorectal cancer during treatment with cetuximab and irinotecan. Clin Cancer Res 18, 1177–1185, https:// doi.org/10.1158/1078-0432.ccr-11-0564 (2012).
11. Diehl, F. et al. Detection and quantification of mutations in the plasma of patients with colorectal tumors. Proc Natl Acad Sci USA
102, 16368–16373, https://doi.org/10.1073/pnas.0507904102 (2005).
12. Hench, I. B., Hench, J. & Tolnay, M. Liquid Biopsy in Clinical Management of Breast, Lung, and Colorectal Cancer. Front Med (Lausanne) 5, 9, https://doi.org/10.3389/fmed.2018.00009 (2018).
13. Wang, W., Song, Z. & Zhang, Y. A Comparison of ddPCR and ARMS for detecting EGFR T790M status in ctDNA from advanced NSCLC patients with acquired EGFR-TKI resistance. Cancer Med 6, 154–162, https://doi.org/10.1002/cam4.978 (2017).
14. Biocartis. Technical sheet Idylla
™
ctKRAS Mutation Test, https://media.biocartis.com/biocartis/documents/Tech_Sheet-ctKRAS-IVD-A4_web.pdf (2017).15. INOSTICS, S. OncoBEAM RAS Colorectal Cancer (CRC) Kit, https://www.sysmex-inostics.com/products-services/product-single-view/oncobeamTM-ras-crc-kit-ivd-3855.html (2016).
16. Diehl, F. et al. Analysis of mutations in DNA isolated from plasma and stool of colorectal cancer patients. Gastroenterology 135, 489–498, https://doi.org/10.1053/j.gastro.2008.05.039 (2008).
17. Matsunaga, M. et al. A comparison of four methods for detecting KRAS mutations in formalin-fixed specimens from metastatic colorectal cancer patients. Oncol Lett 12, 150–156, https://doi.org/10.3892/ol.2016.4576 (2016).
18. Grasselli, J. et al. Concordance of blood- and tumor-based detection of RAS mutations to guide anti-EGFR therapy in metastatic colorectal cancer. Ann Oncol 28, 1294–1301, https://doi.org/10.1093/annonc/mdx112 (2017).
19. Vidal, J. et al. Plasma ctDNA RAS mutation analysis for the diagnosis and treatment monitoring of metastatic colorectal cancer patients. Ann Oncol 28, 1325–1332, https://doi.org/10.1093/annonc/mdx125 (2017).
20. Garcia-Foncillas, J. et al. Prospective multicenter real-world RAS mutation comparison between OncoBEAM-based liquid biopsy and tissue analysis in metastatic colorectal cancer. Br J Cancer 119, 1464–1470, https://doi.org/10.1038/s41416-018-0293-5 (2018). 21. Baldus, S. E. et al. Prevalence and heterogeneity of KRAS, BRAF, and PIK3CA mutations in primary colorectal adenocarcinomas
and their corresponding metastases. Clin Cancer Res 16, 790–799, https://doi.org/10.1158/1078-0432.ccr-09-2446 (2010). 22. Watanabe, T. et al. Heterogeneity of KRAS status may explain the subset of discordant KRAS status between primary and metastatic
colorectal cancer. Dis Colon Rectum 54, 1170–1178, https://doi.org/10.1097/DCR.0b013e31821d37a3 (2011).
23. Kim, M. J. et al. Different metastatic pattern according to the KRAS mutational status and site-specific discordance of KRAS status in patients with colorectal cancer. BMC Cancer 12, 347, https://doi.org/10.1186/1471-2407-12-347 (2012).
24. Mostert, B. et al. KRAS and BRAF mutation status in circulating colorectal tumor cells and their correlation with primary and metastatic tumor tissue. Int J Cancer 133, 130–141, https://doi.org/10.1002/ijc.27987 (2013).
25. Crowley, E., Di Nicolantonio, F., Loupakis, F. & Bardelli, A. Liquid biopsy: monitoring cancer-genetics in the blood. Nat Rev Clin Oncol 10, 472–484, https://doi.org/10.1038/nrclinonc.2013.110 (2013).
26. Allegra, C. J. et al. Extended RAS Gene Mutation Testing in Metastatic Colorectal Carcinoma to Predict Response to Anti-Epidermal Growth Factor Receptor Monoclonal Antibody Therapy: American Society of Clinical Oncology Provisional Clinical Opinion Update 2015. J Clin Oncol 34, 179–185, https://doi.org/10.1200/jco.2015.63.9674 (2016).
27. Morelli, M. P. et al. Characterizing the patterns of clonal selection in circulating tumor DNA from patients with colorectal cancer refractory to anti-EGFR treatment. Ann Oncol 26, 731–736, https://doi.org/10.1093/annonc/mdv005 (2015).
28. Misale, S. et al. Emergence of KRAS mutations and acquired resistance to anti-EGFR therapy in colorectal cancer. Nature 486, 532–536, https://doi.org/10.1038/nature11156 (2012).
29. Toledo, R. A. et al. Clinical validation of prospective liquid biopsy monitoring in patients with wild-type RAS metastatic colorectal cancer treated with FOLFIRI-cetuximab. Oncotarget 8, 35289–35300, https://doi.org/10.18632/oncotarget.13311 (2017). 30. Lee, R. J. et al. Circulating tumor DNA predicts survival in patients with resected high-risk stage II/III melanoma. Ann Oncol 29,
490–496, https://doi.org/10.1093/annonc/mdx717 (2018).
31. Siravegna, G. & Bardelli, A. Genotyping cell-free tumor DNA in the blood to detect residual disease and drug resistance. Genome Biol 15, 449, https://doi.org/10.1186/s13059-014-0449-4 (2014).
32. Tie, J. et al. Circulating tumor DNA analysis detects minimal residual disease and predicts recurrence in patients with stage II colon cancer. Sci Transl Med 8, 346ra392, https://doi.org/10.1126/scitranslmed.aaf6219 (2016).
33. Klein-Scory, S. et al. Significance of Liquid Biopsy for Monitoring and Therapy Decision of Colorectal Cancer. Transl Oncol 11, 213–220, https://doi.org/10.1016/j.tranon.2017.12.010 (2018).
Acknowledgements
The authors would like to acknowledge Springer Healthcare (Anabel Herrero, PhD) who provided medical writing support. This assistance was funded by Sysmex Inostics, Inc. Sysmex Inostics, Inc. had no role in the design of the study, collection, analysis, and interpretation of data.
Author Contributions
A.V., E.A., E.D.R. and M.B. conceived and designed the analysis, contributed data or analysis tools, performed the analysis, and wrote the paper; E.E. and M.A.G.E. contributed data or analysis tools, performed the analysis, wrote the paper; M.T., M.A., M.R.C.P. and V.G.B. collected the data, contributed data or analysis tools, wrote the paper. All authors approved the final version of the manuscript.
Additional Information
Competing Interests: Dra. Ana Vivancos has received consulting fees from Sysmex Inostics. Dr. Eduardo Díaz-Rubio: Consulting/Advisory Role: Amgen, Bayer, Genomica, Servier, Merck. Speaker: Servier, MSD, Amgen. The rest of authors declare no conflicts of interest relevant to this article.
Publisher’s note: Springer Nature remains neutral with regard to jurisdictional claims in published maps and institutional affiliations.
Open Access This article is licensed under a Creative Commons Attribution 4.0 International License, which permits use, sharing, adaptation, distribution and reproduction in any medium or format, as long as you give appropriate credit to the original author(s) and the source, provide a link to the Cre-ative Commons license, and indicate if changes were made. The images or other third party material in this article are included in the article’s Creative Commons license, unless indicated otherwise in a credit line to the material. If material is not included in the article’s Creative Commons license and your intended use is not per-mitted by statutory regulation or exceeds the perper-mitted use, you will need to obtain permission directly from the copyright holder. To view a copy of this license, visit http://creativecommons.org/licenses/by/4.0/.