Institute for Molecular Medicine Finland (FIMM), Helsinki Institute of Life Science (HiLIFE),
Doctoral School in Health Sciences (DSHealth), Doctoral Program in Biomedicine (DPBM)
University of Helsinki, Helsinki, Finland.
Transcriptomic data integration for precision
medicine in leukemia
Ashwini Kumar
ACADEMIC DISSERTATION
To be presented, with the permission of the Faculty of Biological and Environmental Sciences, University of Helsinki, for public examination in Lecture Hall 2, Biomedicum 1, Helsinki on Friday, October 11th 2019
at 12 noon.
Helsinki 2019
Supervised by
Caroline Heckman, PhD Group leader,
Institute for Molecular Medicine Finland (FIMM),
Helsinki Institute of Life Science (HiLIFE), University of Helsinki, Helsinki, Finland
Pirkko Mattila, PhD Docent,
Institute for Molecular Medicine Finland (FIMM),
Helsinki Institute of Life Science (HiLIFE), University of
Helsinki, Helsinki, Finland Thesis Advisory Committee
Sampsa Hautaniemi, PhD Professor,
Research Program in Systems Oncology, Faculty of Medicine University of Helsinki, Helsinki, Finland Antti Honkela, PhD Associate Professor, Department of Computer Science, University of Helsinki, Helsinki, Finland Reviewed by Throsten Zenz, MD, PhD Professor, Department of Medical Oncology and Hematology, University Hospital Zurich,
Francesco Iorio, PhD Group Leader,
Wellcome Sanger Institute, Wellcome Genome Campus, Hinxton, Cambridge, UK Zurich Switzerland
Official opponent Inge Jonassen, PhD Professor,
Computational Biology Unit, University of Bergen, Norway
ISBN 978-951-51-5516-0 (paperback) ISBN 978-951-51-5517-7 (PDF) https://ethesis.helsinki.fi
Unigrafia Oy Helsinki 2019
1 Table of Contents
1 LIST OF ORIGINAL PUBLICATIONS ... 3
2 ABSTRACT ... 5
3 INTRODUCTION ... 7
4 REVIEW OF THE LITERATURE ... 9
4.1 Precision medicine in cancer ... 9
4.1.1 Overview of precision medicine ... 9
4.1.2 Genomic precision medicine ... 11
4.1.3 Functional precision medicine ... 12
4.2 Tools for precision oncology ... 13
4.2.1 RNA-sequencing ... 13
4.2.2 Whole exome-sequencing ... 16
4.2.3 Functional assays ... 17
4.3 Bioinformatic approaches for precision medicine ... 18
4.3.1 Transcriptomics data analysis... 18
4.3.2 Machine learning approaches for data integration ... 19
4.4 BCL-2 inhibition in AML ... 22
4.4.1 Acute myeloid leukemia ... 22
4.4.2 Apoptosis ... 24
4.4.3 Venetoclax as effective BCL-2 inhibitor... 25
4.4.4 Biomarkers for venetoclax response ... 26
5 AIMS OF THE STUDY ...28
6 MATERIALS AND METHODS ...29
3DWLHQWPDWHULDO 51$VHTXHQFLQJ ([RPHVHTXHQFLQJ ([YLYRGUXJVHQVLWLYLW\DQGUHVLVWDQFHWHVWLQJ'657 51$VHTXHQFLQJGDWDDQDO\VLV 3DWKZD\DQGQHWZRUNDQDO\VLV 4XDQWLWDWLYHUHYHUVHWUDQVFULSWLRQ3&557T3&5 6WDWLVWLFDODQDO\VHV 7 RESULTS ...33
2
7.2 Biomarkers for venetoclax response (Publication II and III)... 36
8 DISCUSSION ...40
9 FUTURE PERSPECTIVES...45
10 ACKNOWLEDGEMENT ...46
3
1 LIST OF ORIGINAL PUBLICATIONS
This thesis is based on the following original publications, which are referred to in the text by their Roman numerals:
I. Kumar A, Kankainen M, Parsons A, Kallioniemi O, Mattila P,
Heckman CA. The impact of RNA sequence library construction protocols on transcriptomic profiling of leukemia. BMC Genomics. 2017;18(1):629. Epub 2017/08/19. doi: 10.1186/s12864-017-4039-1. PubMed PMID: 28818039.
II. Kontro M, Kumar A, Majumder MM, Eldfors S, Parsons A, Pemovska T, Saarela J, Yadav B, Malani D, Floisand Y, Hoglund M, Remes K, Gjertsen BT, Kallioniemi O, Wennerberg K, Heckman CA*, Porkka K*. HOX gene expression predicts response to BCL-2 inhibition in acute myeloid leukemia. Leukemia. 2017;31(2):301-9. Epub 2016/08/09. doi: 10.1038/leu.2016.222. PubMed PMID: 27499136.
III. Karjalainen R*, Liu M*, Kumar A, Parsons A, Kontro M, Porkka K, Heckman CA. Elevated expression of the S100A8/S100A9 complex in AML correlates with reduced sensitivity to the BCL-2 inhibitor venetoclax. Leukemia. 2019 Jun 7. doi: 10.1038/s41375-019-0504-y. PMID: 31175323
* Equal contribution
The original articles (I-III) were reproduced with permission from the copyright holders.
4
ABBREVIATIONS
ABL Abelson murine leukemia viral oncogene homolog ALL Acute lymphoblastic leukemia
AML Acute myeloid leukemia AUC Area under the curve
BAD BCL2 associated agonist of cell death BAX BCL2 associated X
BCL-2 B-cell lymphoma-2
BCL-XL B-cell lymphoma-extra large BCR Breakpoint cluster region BH-3 Bcl-2 homology domain 3 BM Bone marrow
CCLE Cancer Cell Line Encyclopedia CPM Counts per million
CR Complete remission DNA Deoxyribonucleic acid DNMT3A DNA methyltransferase 3A DMSO Dimethylsulfoxide
DSRT Drug sensitivity and resistance testing DSS Drug sensitivity score
ELN European Leukemia Net FDA Food and Drug Administration
FHRB The Finnish Hematology Registry and Biobank FLT3 Fms-like tyrosine kinase 3
HOX Homeobox
HSCT Hematopoietic stem cell transplantation IC50 Half-maximal inhibitory concentration IDH Isocitrate dehydrogenase
ITD Internal tandem duplication NGS Next-generation sequencing
NRAS Neuroblastoma RAS viral oncogene homolog NPM1 Nucleophosmin gene 1
MAPK Mitogen-activated protein kinase
MCL-1 BCL2 family apoptosis regulator (myeloid cell leukemia sequence 1) NCI National Cancer Institute
PA Poly-A enrichment PCR Polymerase chain reaction RD Ribo-depletion
RNA Ribonucleic acid
RT-qPCR Reverse transcriptase quantitative polymerase chain reaction TCGA The Cancer Genome Atlas
TMM Trimmed mean of M-values
5
2 ABSTRACT
This thesis is comprised of three studies demonstrating the application of different statistical and bioinformatic approaches to address distinct challenges of implementing precision medicine strategies for hematological malignancies. The approaches focus on the analysis of next-generation sequencing data, including both genomic and transcriptomics, to deconvolute disease biology and underlying mechanisms of drug sensitivities and resistance. The outcomes of the studies have clinical implications for advancing current diagnosis and treatment paradigms in patients with hematological diseases.
Study I, RNA sequencing has not been widely adopted in a clinical diagnostic setting due to continuous development and lack of standardization. Here, the aim was to evaluate the efficiency of two different RNA-seq library preparation protocols applied to cells collected from acute myeloid leukemia (AML) and acute lymphoblastic leukemia (ALL) patients. The poly-A-tailed mRNA selection (PA) and ribo-depletion (RD) based RNA-seq library preparation protocols were compared and evaluated for detection of gene fusions, variant calling and gene expression profiling. Overall, both protocols produced broadly consistent results and similar outcomes. However, the PA protocol was more efficient in quantifying expression of leukemia marker genes and drug targets. It also provided higher sensitivity and specificity for expression-based classification of leukemia. In contrast, the RD protocol was more suitable for gene fusion detection and captured a greater number of transcripts. Importantly, high technical variations were observed in samples from two leukemia patient cases suggesting further development of strategies for transcriptomic quantification and data analysis.
Study II, the BCL-2 inhibitor venetoclax is an approved and effective agent in combination with hypomethylating agents or low dose cytarabine for AML patients, unfit for intensive induction chemotherapy. However, a limited number of patients responding to venetoclax and development of resistance to the treatment presents a challenge for using the drug to benefit the majority of the AML patients. The aim was to investigate genomic and transcriptomic biomarkers for venetoclax sensitivity and enable identification of the patients who are most responsive to venetoclax
6 treatment. We found that venetoclax sensitive samples are enriched with WT1 and IDH1/IDH2 mutations. Intriguingly, HOX family genes, including HOXB9, HOXA5, HOXB3, HOXB4, were found to be significantly overexpressed in venetoclax sensitive patients. Thus, these
HOX-cluster genes expression biomarkers can be explored in a clinical trial setting to stratify AML patients responding to venetoclax based therapies. Study III, venetoclax treatment does not benefit all AML patients that demands identifying biomarkers to exclude the patients from venetoclax based therapies. The aim was to investigate transcriptomic biomarkers for ex vivo venetoclax resistance in AML patients. The correlation of ex vivo venetoclax response with gene expression profiles using a machine learning approach revealed significant overexpression of S100 family genes, S100A8 and S100A9. Moreover, high expression of S100A9 was found to be associated with birabresib (BET inhibitor) sensitivity. The overexpression of S100A8 and S100A9 could potentially be used to detect and monitor venetoclax resistance. The combination of BCL-2 and BET inhibitors may sensitize AML cells to venetoclax upon BET inhibition and block leukemic cell survival.
Taken together, we demonstrated the utility of transcriptomics and bioinformatics data analysis strategies for precision medicine in leukemia. The evaluation of RNA-seq library preparation protocols and identification of gene expression biomarkers for drug responses were investigated in patients with hematological malignancies.
7
3 INTRODUCTION
The molecular understanding of cancer has introduced novel approaches for routine clinical practice in diagnosis, prognosis, and treatment decisions making. The Human Genome Project resulted in the complete mapping of the human genome in 2003. Since then, the technological innovations, increasing speed and reducing the cost of next-generation sequencing (NGS) has facilitated an in-depth investigation of the molecular basis of cancer. It has also catalyzed the invention of newer technologies and computational tools that have transformed the cancer genomic research. Multiple types of cancer patients were sequenced in The Cancer Genome Atlas Program (TCGA) and the International Cancer Genome Consortium (ICGC) projects. The emerging genomic and transcriptomic information has facilitated biomarker discovery for disease monitoring, risk prediction and developing treatment modalities. The recent developments in cancer genomic and transcriptomic fields have built a platform for precision medicine.
The core components of current precision medicine include multi-omics studies, large-scale cohort trials, and big data integration. Standardization of sequencing protocols and the quality of data are key challenges to overcome in order to incorporate NGS-based tools for precision medicine. With a lack of standardized data processing, the outcomes of sequencing studies have been of low reliability. Therefore, establishing robust and standard protocols for clinical use are very crucial to implement precision medicine. Especially for RNA-sequencing (RNA-seq), subsequent data analysis pipelines must deliver accurate information with reproducible and robust performance. Moreover, establishment and standardization of methods for assessing reproducibility, accuracy and precision in a variety of clinically relevant conditions are needed to facilitate the adoption of RNA-seq data in the clinical laboratory.
Current precision medicine synonymizes genomics medicine to match the right drug to the right patient at the right time and dose. Although several breakthrough therapies have been discovered for cancer patients with specific genetic lesions, most cancer patients lack targeted therapies. Hence, to make precision medicine successful and applicable for cancer patients’ treatment, it is essential to incorporate additional tools. Functional
8 precision medicine offers an alternative solution by measuring signals from cancer cells upon therapeutic perturbation. Moreover, combining genomic profiling with functional testing provides promising precision medicine approaches not only to obtain a panoramic view of cancer cells but also to discover effective therapies to individual patients. This powerful approach helps to identify molecular denominators of drug sensitivity and resistance to stratify patients who are most likely to respond to the therapies. Utilizing modern statistical, bioinformatics and machine learning methods, play a crucial role in identifying robust genomic and transcriptomic biomarkers for drug responses. Therefore, it is crucial to combine multiple technologies and analytical tools to extract clinically relevant information from the complex biology of cancer cells.
9
4 REVIEW OF THE LITERATURE
4.1 Precision medicine in cancer
According to the president’s council of advisors on science and technology the USA, precision medicine is defined as: “the tailoring of medical treatment to the individual characteristics of each patient to classify individuals into subpopulations that differ in their susceptibility to a particular disease or their response to a specific treatment. Preventative or therapeutic interventions can then be focused on those who will benefit, sparing expense and side effects for those who will not”1. Precision
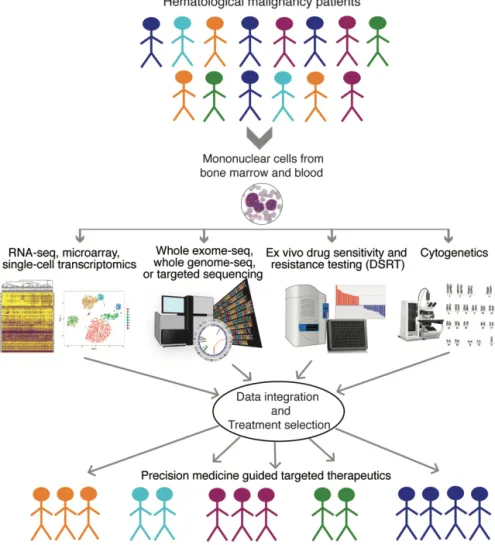
medicine is an approach to stratify patients in order to improve diagnosis and treatment by integrating clinical and molecular information to understand the biological basis of human disease2,3 as shown in Figure 1.
It also considers the environmental exposures and additional traits of an individual and their lifestyle to create a tailor-made treatment4,5. As the
definition suggests, the power of precision medicine lies in its ability to; i) optimize and improve health care by applying an innovative approach to disease prevention and treatment that takes into account individual differences in genetic make-up, environments, and lifestyles ii) help understand/discover mechanisms underlying the disease iii) provide relevant tools to better understand the complex mechanisms or disease condition to clinicians iv) predict which treatments will be most effective6,7.
4.1.1 Overview of precision medicine
The term personalized medicine was re-coined as precision medicine after 2013 to recognize the shifting goals of modern medicine concerning the continuous development of technologies8,9. Personalized medicine refers to
an approach for patients that considers their genetic make-up but with attention to their preferences, beliefs, attitudes, knowledge and social context, whereas precision medicine describes a systems model for health care delivery that relies heavily on data, analytics and information8. In
2011, the USA National Research Council (NRC) expressed concern with the term “personalized medicine” as it may be misunderstood to mean that completely individualized treatments are available for each unique patient.
10 The report defines precision medicine as “the tailoring of medical treatment to the individual characteristics of each patient.” The report added, “it does not literally mean the creation of drugs or medical devices that are unique to a patient, but rather the ability to classify individuals into subpopulations that differ in their susceptibility to a particular disease, in the biology and/or prognosis of those diseases they may develop, or in their response to a specific treatment.”1
Figure 1. An example of precision medicine workflow in patients with hematological malignancies: Technologies implemented for patient stratification and therapy recommendation.
11
4.1.2 Genomic precision medicine
The ultimate goal of genomic precision medicine for cancer is to identify somatic genetic alterations (point mutations, amplifications, translocations) and match them with effective the treatments. The tyrosine kinase inhibitor imatinib was the first example of genomic precision medicine to treat chronic myeloid leukemia (CML) patients the carrying BCR-ABL1 fusion gene10. Imatinib helped to improve the overall survival rates of CML
patients to 90% over five years and 88% over eight years11. Another
example is trastuzumab which is approved for treatment of breast cancer patients with amplification or overexpression of human epidermal growth factor receptor 2 (HER2). Compared to chemotherapy alone, the addition of trastuzumab to chemotherapy significantly slowed the disease progression (i.e., median, 4.6 vs. 7.4 months), prolonged survival time (i.e., median, 20.3 vs. 25.1 months), and reduced the risk of death by 20%12.
Gefitinib13,14 was approved for epidermal growth factor receptor (EGFR)
mutant non-small-cell lung cancers and crizotinib was approved for patients with EML4-ALK fusion gene15,16. Furthermore, vemurafenib and
dabrafenib were approved for advanced-stage BRAF V600E mutant melanoma17.
Recent genomic precision medicine studies conducted on different cancer types with a heavy focus on NGS of tumor samples18-26. As an example,
Lagana et al. demonstrated a unique approach where genomic and transcriptomic features were integrated of 64 multiple myeloma patients to generate treatment recommendations27. In this study, patients were
assigned therapies based on both gene expression and somatic mutation findings. For acute myeloid leukemia (AML), the FMS like tyrosine kinase 3 (FLT3) inhibitor midostaurin was approved for the treatment of patients with a FLT3 mutation28,29. Ivosidenib and enasidenib were
approved for relapsed or refractory AML patients with isocitrate dehydrogenase 1 and 2 (IDH1/2) mutations, respectively30,31. Although
genomic precision medicine approaches have been accepted in the clinic for treatment decision making, the response rates have remained modest25,32.
Recently, large-scale genomic precision medicine approaches were systematically applied for individual solid tumor patients in clinical trial
12 settings. In the systematics analysis, molecular profiling was performed for recurrent metastatic cancer patients to guide clinical treatment decision making. Within the TARGET study, therapy with experimental targeted treatments was guided by sequencing results from circulating tumor DNA and genomic DNA33. In the I-PREDICT study, drug
combinations were designed based on DNA sequencing34. Interestingly,
RNA-seq was coupled with DNA sequencing from tumor and adjacent tissues to select targeted therapies in combination with immunotherapies in the WINTHER trial35.
4.1.3 Functional precision medicine
Precision medicine field has been considered synonymous to genomics medicine. Most cancer patients lack benefits from genomic data-driven precision treatment strategies in terms of long-lasting remission or lengthened survival. Hence, it is essential to broaden the scope of precision medicine by exploring functional characteristics besides genomics and transcriptomics32. Investigating functional features could help to identify
additional targetable vulnerabilities and effective therapies matched to patient-specific phenotypes. A recent study demonstrated a workflow of a drug testing assay for clinical referral in solid tumors and hematological malignancies36. The development of protocols to grow primary tumor cells
for drug testing was optimized towards precision medicine implications to identify patient-specific effective drugs in lung cancer patients37. In a
clinical trial with 769 patients, drug testing identified effective drug treatments and combinations for metastatic and primary tumors38. To
accelerate precision medicine efforts for solid tumor patients, similar methods have been developed for culturing primary solid tumor cells by academic research groups39,40 and pharma industry41.
Snijder et al. utilized ex vivo imaging of drug responses to recommend drugs for clinical treatment in patients with hematological malignancies42.
Survival benefit with selected therapeutics was reported using drug testing on primary cells over standard regimen for AML patients where non-targeted chemo drugs were used for clinical translation43. The analyses of
large-scale data leading to a systematic exploration of targeted drug vulnerabilities associated with molecular subsets of AML patients can help
13 establish precision medicine practice44. Also, there are emerging public
datasets that can facilitate precision medicine efforts. Iorio et al. provided genomic and functional data from 1,001 molecularly annotated human cancer cell lines from 29 tissues. The study generated a large dataset including somatic mutations, copy number alterations, DNA methylation, gene expression and correlated with sensitivity to 265 drugs45. Genetic
perturbation screens (CRIPSR/siRNA) have been used to identify novel cancer therapeutic targets as well as biomarkers using data integration efforts in pan-cancer cell lines46,47. Recently, the Beat AML program
provided ex vivo drug responses data (122 inhibitors) from 562 AML patients with paired whole exome-seq and RNA-seq data on bulk cells 48.
Thus, functional precision medicine approaches may lead to better treatment outcomes but can be further improved by integrating molecular profiling with functional assays for clinical response prediction.
4.2 Tools for precision oncology
The increasing sequencing speed, analysis, accuracy, and affordability of NGS has helped spur the advent of precision oncology49,50. Tools
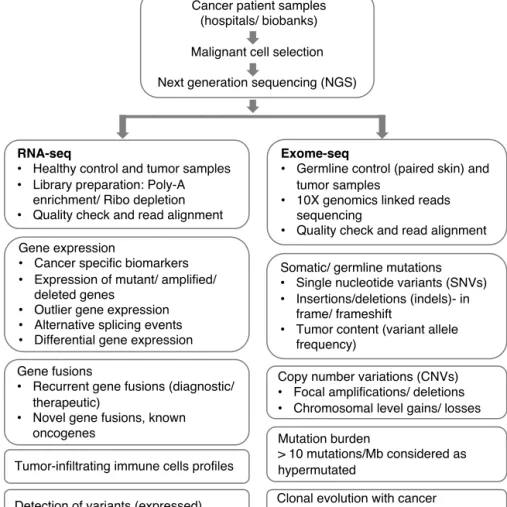
facilitating precision medicine include transcriptomics, genomics and functional assays. The implications of genomic and transcriptomic sequencing of tumor specimens have been applied to improve the diagnosis and treatment of cancer patients, as shown in Figure 2. Advancements in high-throughput drug testing technology made functional profiling, as one of the emerging tools of precision medicine. The integrative analysis includes multi-dimensional data layers and application of machine learning algorithms, which has the potential to improve the clinical management of cancer patients.
4.2.1 RNA-sequencing
RNA sequencing (RNA-seq) detects expression changes by capturing quantitative gene expression patterns and describes the underlying phenotypes in great detail. Compared with microarray-based transcriptome profiling, RNA-seq covers a wider dynamic range and avoids certain technical limitations, for example, varying probe performance and cross-hybridization51. The primary outcomes of cancer transcriptomics can be
14 broadly classified as genetic and functional readouts. The functional phenotypes that can be interrogated through transcriptome profiling are very broad and include quantitative estimates of expression levels and the detection of transcript isoforms, chimeric RNAs and RNA-editing sites. Similarly, the genotypes that can be interrogated by RNA sequencing include structural variants (e.g., gene fusions), copy number variants (CNVs) (e.g., amplifications) and somatic mutations (e.g., single nucleotide variants (SNVs)).
Figure 2. Bioinformatic workflow. Integrative clinical next-generation sequencing and its applications for precision oncology.
Cancer patient samples (hospitals/ biobanks) Malignant cell selection Next generation sequencing (NGS)
Gene expression
Cancer specific biomarkers
Expression of mutant/ amplified/
deleted genes
Outlier gene expression
Alternative splicing events
Differential gene expression
Copy number variations (CNVs)
Focal amplifications/ deletions
Chromosomal level gains/ losses
RNA-seq
Healthy control and tumor samples
Library preparation: Poly-A
enrichment/ Ribo depletion
Quality check and read alignment
Tumor-infiltrating immune cells profiles Gene fusions
Recurrent gene fusions (diagnostic/
therapeutic)
Novel gene fusions, known
oncogenes
Somatic/ germline mutations
Single nucleotide variants (SNVs)
Insertions/deletions (indels)- in
frame/ frameshift
Tumor content (variant allele
frequency)
Mutation burden
> 10 mutations/Mb considered as hypermutated
Clonal evolution with cancer progression/ treatment Detection of variants (expressed)
Exome-seq
Germline control (paired skin) and
tumor samples
10X genomics linked reads
sequencing
15 Advances in experimental and computational tools have dynamically revolutionized transcriptome profiling over the past four decades52,53.
Using RNA-seq, it has now become possible to sequence and quantifies the gene expression patterns at a single cell level48,54. These transcriptomes
provide an opportunity to dissect the complexity and heterogeneity of tumors and to discover new biomarkers or therapeutic approaches for translational and precision medicine strategies55,56. For example, the
RNA-seq technique has been particularly insightful in understanding the drug sensitivity and resistance patterns of malignant cells in AML and classifying the disease48,57. It has enabled identification of a wide variety
of clinically relevant predictive expression biomarkers58-60, fusion-genes
including structural variants and amplifications61-64, as well as alternative
splicing events65,66 in different cancer types. The high coverage of
RNA-seq allows detecting SNPs and somatic mutation in the genes with average to high expression levels67,68. However, the highest sensitivity and
specificity to detect genomic alterations can be achieved by combining both genomic and transcriptomic sequencing69.
RNA-seq includes a sequence of related methodologies70. Typical
RNA-seq experiment involves sample processing, library preparation, sequencing and downstream computational data analysis71. The first step is
the disruption of cells and isolation of RNA molecules. The protocols have been adapted for a wide range of materials, including body fluids (e.g., blood, bone marrow biopsies), solid tissues and cell cultures. The second step is library preparation (mRNA selection). The third step is RNA fragmentation, cDNA synthesis and addition of sequencing adaptors and the final step is sequencing itself. The sequencing of the RNA-seq libraries are commonly performed using Illumina sequencers that utilize sequencing by synthesis chemistry72.
Although ribosomal RNA (rRNA) is the most abundant (>80% of total RNA) RNA molecules in a cell73, it has limited potential for clinical
applications. Hence, depleting rRNA is an essential step to save sequencing bandwidth70,71. A number of rRNA removal (depletion) methods exist
based on i) hybridization74-76 followed by depleting the bound targets using
immobilized streptavidin; ii) duplex digestion77 involving heat-denaturing
followed by re-annealing and removal of rRNA using duplex-specific nucleases; iii) pseudo-random or not-so-random priming78, relying on a
16 collection of short, computationally selected oligonucleotides, called 'not-so-random' primers.
Standard approaches for RNA-seq library preparation include either enrichment of polyadenylated (PA) RNA transcripts using oligo (dT) primers or rRNA depletion through hybridization followed by magnetic bead separation. However, the PA enrichment and RD method each have unique advantages and limitations, respectively. The PA enrichment method is currently the most popular protocol in cancer transcriptomics79.
However, this approach requires intact RNA to avoid technical biases and artifacts. Protocols that utilize ribodepletion80 or hybridization are therefore
more suitable for clinical use, where RNA material is limited or obtained from frozen or variable quality tissue. Over the past decade, many comparative studies between PA and RD methods have been performed81-87 but mostly using non-clinical samples. This challenge
emphasizes the need for systematic comparison of library preparation protocols for cancer patient transcriptomic studies in a precision medicine setting. Our comparative analysis provides recommendations for the application of RNA-seq in clinical or pre-clinical settings with a limited number of samples.
4.2.2 Whole exome-sequencing
Whole exome sequencing (WES) also referred to as exome sequencing, analyzes the coding region of the genome and offers a comprehensive genomic profile of aberrations in protein-coding genes. The Encyclopedia of DNA Elements (ENCODE) project in 2012 reported that human exons of protein-coding genes cover 2.94% of the genome88. The latest version of
the human reference genome “GRCh38” has a complete set of protein-coding regions and constitutes 3.09% (over 90 million nucleotides)89. On
a larger scale, whole-genome sequencing (WGS) provides the most comprehensive view of the entire human genome90 that is 3 billion bases
for a single human sample sequenced. WGS also provides a better resolution of structural variations and CNVs compared to WES.
The overall goal of WES is to measure inter-personal variability in genomic DNA by comparing an individual’s DNA sequence to the reference human
17 genome. The approach is useful for both clinical as well as research applications since it covers actionable areas of the genome. It determines the variations in the exonic regions to help identify various cancer-associated mutations91. With the improvement in sequencing technologies
and standardization of data analysis pipelines, the WES has been employed for real-time clinical applications92,93.
4.2.3 Functional assays
In addition to sequencing technologies, functional assays hold promise to advance current precision medicine approaches. One approach gaining popularity is high-throughput drug testing, which accesses the impact of drugs on cell viability, cell differentiation, or other cellular phenotypes. High-throughput drug testing allows testing of thousands of drugs at multiple doses and has been broadly implemented to identify cancer effective drugs based on response to the tested drugs94. Early systematic
high-throughput drug testing has used established human cancer cells lines to identify potential targeted drugs for further clinical development. A National Cancer Institute (NCI) study, screened FDA approved drugs with 60 human cancer cell lines (NCI60) generated a widely used dataset resource95. Later in 2012, Barretina et al. at the Broad Institute96 and Garnet
et al. at the Sanger institute97 published studies on high-throughput drug
testing of 1000 human cell lines covering major cancer types. The ex vivo
drug testing approach was extended to primary patient material, including relapsed and refractory AML patients to facilitate therapy selection for individual patient cases48,98. A similar approach was adapted for chronic
lymphocytic leukemia (CLL) patients to identify potential targeted drugs and associated patterns of molecular features by Dietrich et al.99. Tzelepis
et al. applied a genome-wide CRISPR screening platform and reported that
inhibition of KAT2A gene leads to differentiation and apoptosis of human AML cells100. Also, drug testing analysis using flow cytometry to
distinguish the drug response based on different cell populations has been demostrated101. A novel BH3 mimetic assay was reported to predict
chemotherapy resistance in leukemia patients and was promoted to advance current functional precision medicine efforts102.
18
4.3 Bioinformatic approaches for precision medicine
In recent years, high-throughput technologies have been used to generate a vast amount of multi-omics and functional data. Previously, the main focus was on the analysis of a single layer of data type including gene expression, somatic mutations, CNVs and DNA methylation, independently. Since the molecular complexity and heterogeneity of cancer exists at all levels, integrative bioinformatic analyses of multiple layers of data simultaneously offer an effective and robust strategy to achieve a better understanding of pathogenic mechanisms. The data-driven analyses of multi-omics data in addition to data from functional assays can result in more profound insights into cellular functionality.
4.3.1 Transcriptomics data analysis
The primary and fundamental goal of transcriptomics data analysis is to identify genes with significantly altered expression level changes between given conditions. For example, frequent comparisons include drug-sensitive versus drug-resistant or mutation-negative (wild type) versus mutation-positive. More complicated experimental designs include extra experimental factors to account for covariates (such as experimental batch, age, gender, library preparation methods, disease etc). The standard RNA-seq work-flow includes i) experimental design based on the biological question and determination of the appropriate sample size for sequencing; ii) obtaining the sequence data, which include sample collection and processing, RNA-extraction, library preparation and sequencing; iii) preprocessing the data, which includes performing quality control, adapter trimming, and alignment; iv) analyzing data, which involves normalizing the read counts, identifying differentially expressed genes, identifying fusion genes, visualizing the results, correlate with phenotype if data available, and validate outcomes. The commonly used tools used for pre-processing the RNA-seq data are explained in Table 1.
19
Tools Descriptions Ref
Quality control
FastQC Rapid assessment of sequence data Andrews
RNA-SeQC Read mapping summary statistic, coverage DeLuca (2012)103 RSeQC Read distribution over genome, read depth Wang (2012)104 PRINSEQ Summary statistics, trim adaptor sequences
Trimmomatic Performs trimming for Illumina platforms Bolger (2014)105
Cutadapt Removes adapter sequences Martin (2011)106
Alignment
TopHat v2 Candidate exon pairing, implanted bowtie Kim (2013)107
Subread Seed-and-vot Lioa (2013)108
STAR Maximal mappable prefix Dobline (2013)109
HISAT2 Spliced alignment program Kim (2015)110
Read counting
featureCounts Gene-level quantification Lioa (2014)111
htseq-count Gene-level quantification Anders (2015)112
Rcount Reads aligning with multiple locations Schmid (2015)113
Differential gene expression
edgeR Negative binomial distribution Robinson
(2010)114
DEseq2 Negative binomial distribution Love (2014)115
Fusion genes detection
EricScript Recalibrates junction reference Benelli (2012)116
SOAPfuse Can detect low fusion over coverage Jia (2013)117
FusionCatcher Detects both known and novel fusions Nicorici (2014)118
Table 1: Tools for RNA-seq data analysis.
4.3.2 Machine learning approaches for data integration
Application of machine learning tools in genomics has massively increased in recent years and proved to be very valuable in providing novel insights119,120. For example, machine learning can be used to identify the
location of transcription start sites, promoters, splice sites, or enhancer sites in the genome119. In the past, single-layer analysis has been extensively
conducted at different levels, including mRNA, microRNA, CNV, DNA methylation and somatic mutations were analyzed independently121,122. As
20 the molecular complexity of disease etiology exists many different levels, integrative analysis approaches offer an efficient way to join forces across multi-level omics data. Since the diverse layers of patient-derived “big data” are being generated, new bioinformatic approaches need to be developed to integrate multi-dimensional data123. High-throughput ex vivo
drug sensitivity testing read-outs have the potential to become one of the significant components of precision oncology. The machine learning approaches have been proven to be enormously useful in predicting drug responses by integrating multi-omics data124. The resultant molecular
denominator for ex vivo drug responses could assist clinicians to make decisions on patient treatment, including the selection of the most effective therapies. Machine learning is a data-driven field that involves applying algorithms and building models with the ability to ‘learn’ to make accurate predictions with experience. Machine learning methods can primarily be categorized into supervised learning or unsupervised learning. Supervised learning requires known examples or established patterns to train the models, which is then used to predict the respective labels. In contrast, unsupervised learning is concerned with finding patterns or clusters without any prior knowledge125,126.
Several drug sensitivity prediction algorithms have been proposed to characterize the relationship between gene expression profiles and drug responses96,127-132. Liu et al. applied linear regression models to identify
gene expressions, co-expressions, and co-expression modules associated with drug sensitivity in CCLE (Cancer Cell Line Encyclopedia) data by considering relevant confounding factors such as age, sex, batch, cancer and tissue types133. Masica et al. developed a novel approach named
multivariate organization of combinatorial alterations (MOCA), combining many genomic alterations into biomarkers of drug response. Outcomes of the MOCA approach suggested that multi-gene features correlation with drug response substantially better compared to individual genes134.
Over the last decade, many machine learning models have been used for the big data integration and drug response prediction, including linear regression, elastic net regression, support vector machines, neural networks and random forest as reviewed by Azuaje135. Emad et al. proposed a gene
prioritization method called Prioritization of Genes Enhanced with Network Information (ProGENI) to rank genes that are closely related to a
21 phenotype136. With the ranked genes, the authors employed a kernel
support vector machine (SVM) for drug sensitivity prediction and reported that ProGENI–identified genes can better predict drug response compared to genes identified by other widely used prioritization methods such as Pearson correlation and elastic net regression136. A collaborative effort
between the NCI and the Dialogue on Reverse Engineering Assessment and Methods (DREAM) project, performed a comparison of 44 different drug response prediction methods and found that Bayesian multitask multiple kernel learning exhibited the best predictive performance59. Also,
gene expression was found to have more predictive power in drug response prediction compared to other features such as mutations or CNVs59,136.
Lee et al. developed the MERGE (mutation, expression hubs, known
regulators, genomic CNV, and methylation)137 algorithm, which integrates
multi-omic data to identify statistically correlated gene markers of drug sensitivity in AML. MERGE learns the weight of each unique driver features to successfully predict known drug sensitivity using a wide variety of input data including mutations, CNVs, and DNA methylation, gene expression and regulatory annotations. The MERGE model was able to identify an association between high FLT3 expression and sensitivity to FLT3 inhibitors midostaurin, ponatinib, sunitinib, and tandutinib137. Aben
et al. implemented elastic net regression models and developed TANDEM
method. The method is a two-stage approach where the first stage explains drug response using upstream features (mutations, CNVs, methylation and cancer type) and the second stage explains the remainder using downstream features (gene expression, pathways). Jang et al. applied elastic net regression and found it to be one of the best-performing modeling strategies for drug response prediction in the CCLE and GDSC (Genomics of Drug Sensitivity in Cancer) cancer cell line datasets138. Likewise, Ding et al.
applied elastic net regression combining genomic data for drug sensitivity prediction through deep learning in the CCLE and GDSC datasets139. The
broad applications of machine learning have tremendously advanced the goals of precision cancer medicine. Importantly, standardization of the methods and uniform data analysis strategies across various biological modalities can yield more advantages in the future. Moreover, the increasing scale of data obtained from cancer patients will sharpen machine learning tools in terms of improved efficiency and robust outcomes.
22
4.4 BCL-2 inhibition in AML
4.4.1 Acute myeloid leukemia
Acute myeloid leukemia (AML) is a heterogeneous malignancy of the hematopoietic system, characterized by massive proliferation and accumulation of undifferentiated leukemic blasts140,141. Even though the
occurrence of AML is relatively rare (1.2% of all cancers) compared to other systemic cancer types, the five-year survival rate of AML patients is poor as recorded in cancer registry data from the Surveillance, Epidemiology and End Results Program (SEER) database. According to the SEER database, AML occurrence and mortality rates are higher in elderly patients compared to children as the median age at diagnosis is 67 years. Although almost 70% of adults with AML achieve a complete remission with conventional chemotherapy, the long-term survival rate has remained only 30%142. Another challenge for successful AML treatment is
the complexity and molecular heterogeneity of the disease143 (Figure 3).
Extensive efforts to characterize AML genome has deconvoluted the recurrence and interaction patterns of mutations144,145. Investigating
epigenetic events has provided insights in DNA methylation patterns in AML146 . Sequencing of 200 de novo adult AML patients revealed major
genomic and epigenomic drivers of the disease147. The aberrantly regulated
gene expression signatures have been reported in molecular subtypes of AML. For example, unique gene expression signatures and regulatory networks were identified in mutation subtypes of AML148,149.
Papaemmanuil et al. demonstrated the utility of combining cytogenetics and molecular taxonomy as prognosis schema in AML patient cases121.
Furthermore, the cytogenetics and mutation information was used to design the European Leukemia Net (ELN) 2017 classification system by a panel of international experts150. Additionally, clonal heterogeneity studies have
revealed the complexity of the disease progression and emphasize the need for strategies to target this progressive disease efficiently 151-153.
Furthermore, potential targeted drugs were identified for specific molecular features from genomics, transcriptomics154,155, and methylation profiling99
23 Conventional treatment options for AML patients include chemotherapy and subsequent allogeneic hematopoietic stem cell transplantation (allo-HSCT). The primary goal of chemotherapy is to eradicate the leukemic blasts cells or to induce differentiation of immature leukocytes in some instances. The widely used induction (first line of therapy) treatment regimen, which massively kills the majority of leukemic blasts, consists of cytarabine (nucleoside analog) in combination with daunorubicin, idarubicin or mitoxantrone (anthracyclines, also known as topoisomerase inhibitors). The induction regimen is followed by a consolidation regimen to eradicate the remaining leukemic blasts, where the selection of drugs may vary from patient to patient. Allo-HSCT is performed to replenish healthy hematopoietic progenitors in patients achieving complete remission. In the case of acute promyelocytic leukemia (APL) patients, carrying PML-RARA gene fusion, tretinoin treatment is cornerstone therapy. The tretinoin treatment leads to differentiation of leukemic blasts into mature and functional leukocyte cells.
Figure 3. Mutation and cytogenetic landscape of acute myeloid leukemia. Adapted from Chen and Chen et al., Nature Genetics, 2013143.
The conventional chemotherapy regimens are not suitable for unfit elderly AML patients. Therefore, the treatment options were confined to hypomethylating agents decitabine and azacytidine for the patients until recently. FDA approval of the combination of the BCL-2 inhibitor
24 venetoclax and a hypomethylating agent or low dose cytarabine has revolutionized treatment for the elderly AML patients. The treatment has improved median overall survival from 11.3 to 17.5 months in AML patients with a median age of 75 years of age and older, was reported in a clinical trial156. Similarly, recent FDA approvals of other targeted agents
have made new treatment options available for patients with specific molecular lesions. Approval of FLT3 inhibitors midostaurin and gilteritinib for AML patients with activating FLT3 mutations including internal tandem duplication (FLT3-ITD) or point mutation of the tyrosine kinase domain (FLT3-TKD) at diagnosis bring new treatment options for 30% of the AML population. Two IDH inhibitors, ivosidenib and enasidenib, were approved for AML patients carrying IDH1 and IDH2 mutations, respectively for relapsed/refractory AML patients. Smoothened inhibitor glasdegib targeting the hedgehog pathway was also approved for the treatment of AML patients. Furthermore, the CD33 antibody gestuzumab ozogamicin was approved for CD33 expressing AML patients. Approval of targeted drugs has dramatically changed the treatment paradigm for the mutation-specific subgroup of AML patients. However, limited response rates with targeted drugs in mutation stratified patient populations demands the development of advanced strategies and robust biomarkers to identify patients most likely to respond.
4.4.2 Apoptosis
Apoptosis blockade is one of the hallmarks of the cancer157. Apoptosis is
known as programmed cell death, was reported for the first time in mammalian tissue by Kerr et al. in 1970s158. In this cellular process, the
cell receives death signal results in cell disintegration into small apoptotic bodies that are eventually phagocytosed by white blood cells159. Apoptosis
pathway is characterized by two distinct mechanisms (intrinsic and extrinsic) depending on the source of death signals. In the case of the extrinsic pathway, the death signal bind to cell surface receptors, including Fas cell surface death receptor (FAS), Tumor necrosis factor receptor (TNFR), and TNF Receptor Superfamily Member 25 (WSL) and activate downstream caspase cascade. The activated caspase 8 cleaves and activates BH3 protein BID to induce intrinsic pathway160. On the contrary, the
25 activated through B-cell lymphoma 2 (BCL-2) family proteins. The proteins regulate outer membrane permeabilization (MOMP) of cytochrome c and SMAC proteins to the cytosol, thereby activating downstream caspases and leading to apoptosis161.
After unrevealing the crucial role of BCL-2 family members in regulating apoptosis, many studies have unfolded important roles of distinct pro-and anti-apoptotic BCL-2 family proteins 162-165. The anti-apoptotic BCl-2
family proteins include BCL-2, BCL-XL, BCL-W, MCL-1 and BFL-1 and
carry four BH-domains. The pro-apoptotic proteins were divided into two categories based on protein structure BH domains carrying proteins and BH3 only proteins. BAK, BAX and BOK proteins contain three to four BH domains whereas BAD, BIK, BIM, PUMA, NOXA, HRK and BMF proteins contain BH3 domain166-173. The interaction between anti-apoptotic
and pro-apoptotic proteins occurs through binding of the BH3 domain of pro-apoptotic proteins to BH1, BH2 and BH3 domains of anti-apoptotic proteins. Upon activation, BAK and BAX oligomerize on the mitochondrial outer membrane to form pores and cause MOMP and cytochrome c release in the cytosol for progression of apoptosis166,167,174.
Therefore, BCL-2 family members and especially BH3 related proteins have become an exciting target for therapy development.
4.4.3 Venetoclax as effective BCL-2 inhibitor
Several drugs have been developed to target BCL-2 and induce apoptosis in leukemic blast cells that dependent on BCL-2 for survival175. BCL-2
inhibitors are BCL-2 homology domain 3 (BH3) like small molecules, also known as BH3 mimetics. These drugs bind to anti-apoptotic molecules, including BCL-2, BCL-XL and BCL-W and BCL2-A1. BH3 mimetic drug
navitoclax (ABT-263) binds with a strong affinity to BCL-2 and BCL-XL
and with weaker affinity to MCL-1 and BCL2-A1176. The target binding
affinity of navitoclax with BCL-2 and BCL-XL is <1nM. Despite the
promising pharmacokinetic properties, the navitoclax treatment produced severe thrombocytopenia due to survival dependence of thrombocytes on BCL-XL177. The next BH3 mimetic in the drug development pipeline was
venetoclax (ABT-199)178. Venetoclax was approved for CLL patients in
26 response in elderly AML patients in combination with hypomethylating agents156. The venetoclax in combination with azacitidine or decitabine or
low-dose cytarabine received FDA approval for elderly patients diagnosed with AML in November 2018. Venetoclax has a strong and selective binding affinity for BCL-2 (Figure 4) and had no impact on platelet survival178. However, it has been challenging to select AML patients for
venetoclax treatment and monitor treatment response in the clinic.
Figure 4. Venetoclax mode of action. a) the balance between anti-apoptotic and pro-apoptotic proteins in healthy cells. b) BCL-2 inhibitor prohibits binding of pro-apoptotic proteins BAK and BAX to anti-apoptotic BCL2 on BH3 domain to promote apoptosis. c) Activated pro-apoptotic proteins trigger permeabilization of mitochondrial membrane to releases cytochrome c to execute the final step of
apoptosis.179 Abbreviation: MOMP: mitochondrial outer membrane
permeabilization. Adopted from Konopleva et al. Cancer Discovery, 2016180 with permission from AACR.
4.4.4 Biomarkers for venetoclax response
Genetic biomarkers for venetoclax sensitivity and resistance have been reported in solid tumors and hematological malignancies. As an apparent biological correlate, BCL-2 gene overexpression was reported to be associated with venetoclax sensitivity in small cell lung cancer181. Chyla et
al. reported that IDH1, IDH2 and SRSF2 mutations correlate with clinical response to venetoclax in AML patients182.
27 Due to the lack of stability of the genetic and gene expression biomarkers for venetoclax responses, Konopleva M. and Letai A. have developed a functional assay known as BH3 mimetic assay. The assay measures the apoptotic potential of the cells to determine the corresponding response to BH3 mimetic venetoclax. The assay was reported as a robust biomarker which can be implemented in the clinic to predict venetoclax sensitivity by
Pan et al. 102. Later, Konopleva et al. reported phase II clinical trial results
of venetoclax monotherapy in 32 AML patients. The BH3 profiling assay results were consistent with clinical response in the patients. The 800 mg clinical dosage of venetoclax was well tolerated in AML patients without causing any severe side effects180. The functional BH3 mimetic assay can
be a promising biomarker for venetoclax response. However, current molecular profiling dependent clinical practices need robust genomic and transcriptomic biomarkers for predicting sensitivity and resistance to venetoclax.
28
5 AIMS OF THE STUDY
This thesis addresses the challenge of utilizing transcriptomics information from leukemia patients to aid precision medicine strategies. The specific aims of this study were:
• To evaluate the advantages and limitations of two mainstream RNA-seq library preparation methods for optimal selection (Study I) • To identify gene expression biomarkers for BCL2 inhibitor venetoclax
sensitivity in AML patients (Study II)
• To identify biomarkers and therapeutic strategies to counteract BCL-2 inhibitor venetoclax resistance in AML patients (Study III)
29
6 MATERIALS AND METHODS
6.1 Patient material
Bone marrow (BM) aspirates or peripheral blood samples were collected from AML patients. Skin biopsies were also collected (non-malignant cells for germline genomic information) from AML patients. All samples were collected with the approval of Helsinki University Hospital Ethics Committee (permit numbers 239/13/03/00/2010, 303/13/03/01/2011, Helsinki University Hospital Ethics Committee) and after signed informed consent in accordance with the Declaration of Helsinki. All of the AML patients included in studies I-III were venetoclax treatment naïve. Mononuclear cells (MNCs) were isolated by Ficoll-Paque PREMIUM density gradient separation (GE Healthcare). MNCs were further used for drug sensitivity and resistance testing (DSRT) and extraction of nucleic acids (DNA and RNA).
6.2 RNA-sequencing
Total RNA (2.5-5 µg) was extracted from BM MNCs using the miRNeasy kit (Qiagen). The Qubit fluorometer (Thermo Fisher) was used for RNA quantification and RNA quality was measured using Bioanalyzer with RNA nanochips (Agilent). Next, RNA-seq libraries were prepared using Dynabeads® mRNA Purification Kit (Thermo Fisher) and using the Ribo-ZeroTM rRNA Removal Kit (Epicentre) as per the manufacturer’s
instructions. The RNA was further reverse transcribed to double-stranded
cDNA (SuperScript™ Double-Stranded cDNA Synthesis Kit, Thermo Fisher). RNA sequencing libraries were prepared with Illumina compatible Epicentre Nextera™ Technology and ScriptSeq v2™ Complete kit (Illumina). RNA sequencing libraries were purified with SPRI beads (Agencourt AMPure XP) and library QC was evaluated on high sensitivity chips using the Agilent Bioanalyzer (Agilent Technologies). Paired-end sequencing with 100 bp read length was performed using HiSeq 2000 (Illumina).
30
6.3 Exome-sequencing
Genomic DNA was isolated from both BM MNCs and skin biopsies from AML patients using the DNeasy Blood & Tissue Kit (Qiagen). 3 µg of DNA was used for the sequencing. Exome capture was performed with the Nimblegen SeqCap EZ v2 capture Kit (Roche NimbleGen, Madison, WI, USA) and sequencing was done on HiSeq1500, 2000 or 2500 instruments98. Data preprocessing (QC, alignment) and somatic mutation
calling were done as described previously183.
6.4 Ex vivo drug sensitivity and resistance testing (DSRT)
The drug sensitivity and resistance testing (DSRT) was performed in a high-throughput setting with five-point doses of each drug as described previously98. The drugs were dispensed in nanoliter volumes to 384 well
plates using Echo 500 and Echo 550 acoustic liquid dispensing system (Labcyte). The freshly isolated MNCs from healthy donors and AML patients were resuspended in mononuclear cell medium. The cells suspension was dispensed in pre-drugged plates using Multidrop (Thermo Scientific) and incubated for 72 hours at 37° C. The cell viability was measured as a surrogate of ATP production by live cells in terms of luminescence using Cell Titre Glow® reagent (Promega). Benzonthenium chloride as positive and dimethyl sulphoxide as negative control were added to multiple wells in every plate. To read the plates PHERAstar FS plate reader (BMG LABTECH) was used. The controls were used to calculate percent inhibition for each of five doses of a given drug. These values were used to fit four-parameter non-linear regression curves and to calculate half inhibitory concentration (IC50). The curve fitting criteria and IC50 values were used to calculate drug sensitivity scores (DSS), which is a modified area under the curve. The cancer-specific drug responses as selective DSS were calculated by subtracting responses from healthy controls as described previously184.
6.5 RNA-sequencing data analysis
RNA sequencing data were pre-preprocessed as described previously185.
31 adapters, and short read-length. Filtered paired-end reads were aligned to the human genome (GRCh38) using STAR aligner109 with the guidance of
EnsEMBL v82 gene models using 2-pass per-sample parameters were used with the overhang on each side of the splice junctions set to 99. The alignments were sorted and PCR duplicates were marked using Picard, feature counts were computed using SubRead108 and converted to
expression estimates using Trimmed Mean of M-values (TMM) normalization186. Fusioncatcher118 tool was used to call fusion genes using
RNA-seq fastq files. In study II, to find out the differentially expressed genes between venetoclax sensitive and resistant groups, DESeq2115
package was used. In study III, we applied a linear regression model187,
assuming that gene expression is affected by confounding factors including age, gender, sequencing batch, RNA extraction method and RNA-sequencing library preparation protocols. To find the relationship between gene expression change and drug sensitivity, we corrected the confounding factors in the linear regression model. Genes at false discovery rate (FDR) < 0.05 were considered significant.
6.6 Pathway and network analysis
Pathway analysis was performed using QIAGEN’s Ingenuity® Pathway Analysis (www.qiagen.com/ingenuity). The method was applied to genes with ≥ 2-fold change in expression. Z-scores > abs (2) was considered as significant. In addition to IPA, the Gorilla188 web-server was used to
identify enriched terms across all three-gene ontologies. In study III, network analysis was performed for negatively associated genes (n=349) with venetoclax response using the Enrichr189,190 tool. Outputs from KEGG
2016 and Reactome 2016 cell signaling pathway databases were considered for further analysis. GeneMANIA191 was used for visualizing a sub-cluster
of 29 genes associated with venetoclax resistance.
6.7 Quantitative reverse transcription-PCR (RT-qPCR)
For the RT-qPCR validation experiments, RNA was isolated either from AML patients and from cells lines. The Qubit fluorometer was used for the RNA quantification. The SuperScript III Reverse Transcriptase (Thermo Fisher) was used for the cDNA synthesis. The reaction was run on the
32
CFX96 Real-Time System instrument (Bio-rad) using 10ng cDNA from each sample, including the iQ SYBR Green SuperMix (Bio-Rad, Hercules,
CA, USA). Data were analyzed by applying ΔΔCt method using reference
genes.
6.8 Statistical analyses
R version 3.3.3 was used for all the statistical analyses and for generating plots. Pearson’s correlation coefficient assessed statistical dependence between two variables. The Mann Whitney U test was used for analyzing differences between drug responses. Two-sided P-values below 0.05 and false discovery rate (FDR) below 0.05 were considered statistically significant. The Wilcoxon signed-rank test was applied to find significant differences in drug response between wild type and mutated AML patient samples for a given mutation.
33
7 RESULTS
Detailed results from published articles are presented in their original communications and briefly summarized here.
7.1 Impact of RNA-seq protocols (Publication I)
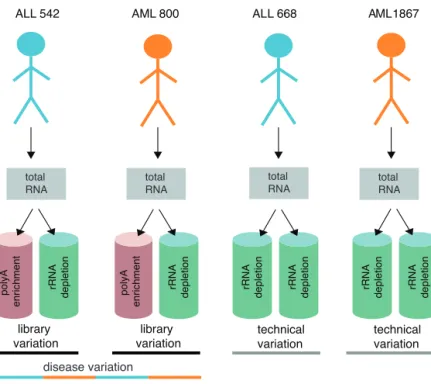
We compared two major library preparation protocols, poly-A enrichment (PA) and ribo-depletion (RD) used for clinically relevant molecular features. The protocols applied to the total RNA isolated from mononuclear cells from the bone marrow of leukemia patients. Eight libraries were generated from two AML and two acute lymphoblastic leukemia (ALL) patient samples, including experimental replicates and technical replicate from the same total RNA sample (Figure 5).
Figure 5. A systematic overview of the experimental design. Total RNA was isolated from mononuclear cells and used for RNA-seq library preparation.
rRNA depletion polyA enrichment
ALL 542 AML 800 ALL 668 AML 1867
library variation technical variation library variation technical variation rRNA depletion rRNA depletion rRNA depletion rRNA depletion rRNA depletion polyA enrichment patient variation total RNA total RNA total RNA total RNA disease variation
34 We evaluated the utility of two mainstream protocols to detect clinically relevant molecular characteristics and assessed their effects on based on different analyses including;
i. Read mapping; the PA protocol provided a higher number of exon mapping reads (75.2-76.9%) than the RD libraries (52.0-72.6%). Reads mapping to intronic regions were higher in RD (33.8%) than in PA (21%) (Figure 6a).
ii. Expression of protein-coding and non-coding RNAs; the RD protocol detected 20.8 to 26.3% more features altogether compared to PA libraries. The list of genes includes both protein-coding and non-coding (processed pseudogene, lincRNA, snRNA, antisense and miRNA) RNAs. In the case of protein-coding genes, 1380 of them were, discordantly called between the matched PA and RD libraries. The PA protocol overlooked 55 histone genes and on the contrary, many cancer-related genes e.g., TGF-β1, BCL3, BRD4 were overlooked by RD protocol.
iii. rRNA removal efficiency; the PA libraries had higher rRNA mapping read rates than RD libraries (1.8% vs. 0.6%) (Figure 6b).
iv. The hierarchical clustering of highly variable genes depicted the groups driven by disease biology instead of protocols/technical variation (Figure 6c).
v. Differential gene expression; to find out the impact of library preparation protocol on differential gene expression, an independent RT-qPCR experiment was performed. The expression analysis of randomly selected five oncogenes (POLR1B, TUBB, SRM, TGFB1,
NABP1) revealed that the PA protocol captured target mRNAs more
efficiently than the RD protocol. The PA protocol captures target mRNA to a greater extent compared to RD protocol. STAT3, NABP1
and TET2 were depleted significantly in the PA enriched library and
NRAS, STAT3, TET2, EMD, SRM, TGFB1, ZFP36L2 showed a
significant difference between the RD library and total RNA.
vi. Fusion gene detection; FusionCatcher118 tool was applied to the
evaluation of the efficiency of PA and RD protocols in detecting fusion genes. The clinically relevant fusions with well-known roles in leukemia diagnosis and prognosis. For example, BCR-ABL1 in-frame fusion gene that was supported by 184 and 188 spanning pair-end reads in PA and RD.
35 Figure 6. a) The percentage of reads mapped to intragenic, intronic and exonic regions, read mapping rates are on Y-axis. b) Y-axis on the left represents number of rRNA reads and Y-axis on the right represents rRNA mapping rates. c) The first heatmap represent the disease and library specific variations, the second heatmap represents the technical variation. For the hierarchical clustering genes (log2 RPKM >2 and CV >20) were selected using Euclidean distance and complete linkage.
Overall, both protocols produced similar results with consistent outcomes. We found that RD protocols capture whole transcriptome information,
b)
ALL_542_polyAALL_542_riboDAML_800_polyAAML_800_riboD ALL_668_R1_riboDALL_668_R2_riboD AML_1867_R1_riboDAML_1867_R2_riboD 0.0 0.2 0.4 0.6 0.8 1.0 m apping r at es AML_800_polyA AML_800_ riboD ALL_542_polyA ALL_542_ ri b o D max RPKM > 2 & CV > 20 (n= 4697 ) ï 0 2 Value AML_668_RP1_r iboD AML_668_RP2_r iboD AML_1867_RP1_r iboD AML_1867_RP2_r iboD max RPKM > 2 & CV > 20 (n= 3254 ) Exonic Rate Intronic Rate Intergenic Rate ALL_542_poly A
ALL_542_riboDAML_800_polyAAML_800_riboD
ALL_668_R1_riboDALL_668_R2_riboDAML_1867_R1_ribo D AML_1867_R2_riboD 0 1 106 2 106 3 106 0.00 0.01 0.02 0.03 0.04 0.05 rR N A re a d s rRNA rate rRNA rR N A ra te a) c)
36 detects a higher number of ncRNA features (snRNA, processed pseudogene, lincRNA, miRNA). Also, it had higher alignment and gene coverage efficiency, depleted some protein-coding mRNA and MT genes and removed rRNA effectively. On the other hand, PA protocol captured more protein-coding regions, closely represented gene expression values with total RNA, depleted histone mRNA and lost targeted RNAs of interest if lack poly-A tails, efficient in differential gene expression analysis.
7.2 Biomarkers for venetoclax response (Publication II and III)
To identify genomic and transcriptomic biomarkers associated with venetoclax sensitivity and resistance, DSRT was performed with mononuclear cells isolated from the bone marrow of AML patients. Also, WES (n=42) and RNA-seq (n=35) was performed with same MNCs.
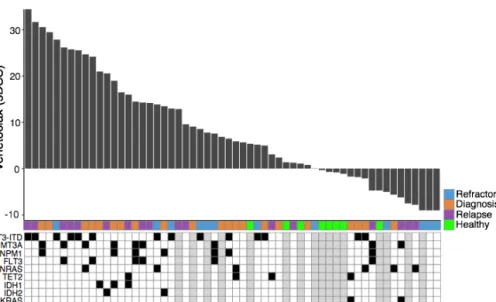
Figure 7. Waterfall plot illustrates the selective venetoclax response profile in 50 samples from AML patients and eight healthy controls (green). The sDSS represents leukemia-selective responses compared to healthy controls, where high sDSS represents strong sensitivity. Each sample is annotated for the disease type and presence of key AML somatic mutations.
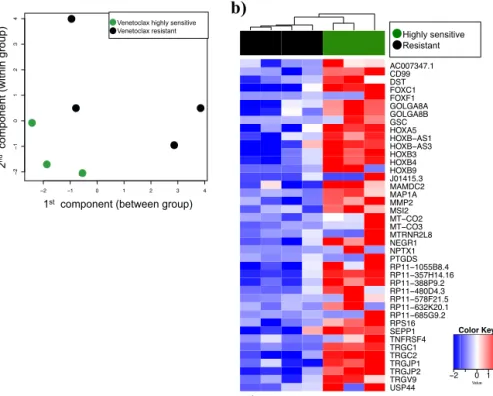
37 In study II, Venetoclax produced heterogeneous response across AML patient samples (Figure 7). The differential gene expression analysis was performed using RNA-seq read counts data. The analysis was applied between samples that were highly resistant (n=4) and highly sensitive (n=3) to venetoclax response (Figure 8a). The analysis resulted in 322 significant differentially expressed genes (FDR <0.05). Out of 322 genes, 41 of them were overexpressed in the sensitive group (Figure 8b) and 281 genes were overexpressed in the resistant group. The genes were further analyzed for their biological function and class. The analysis revealed several HOX
family genes with significantly higher expression in venetoclax-sensitive compared to resistant samples. Furthermore, we also confirmed the overexpression of the HOX family genes using RT-qPCR in AML patient samples. Moreover, IDH1/2 and WT1 mutations were found to be enriched in venetoclax sensitive patient samples compared to resistant samples.
Figure 8. a) Multi-dimensional scaling plot exhibits differences between the expression profiles of three venetoclax sensitive and four venetoclax resistant samples in two dimensions. b) 41 significantly with false discovery rate (FDR <
2 1 0 1 2 3 4 2 10 1 2 3 4 Venetoclax resistant Venetoclax sensitive ' (&)(' ',/$,#$'"*(-) +,(&)(' ', ,/ '"*(-) ' ,(%0#$"#%1+ '+$,$. ' ,(%0* +$+,', 4172 3853 1713 3443 1886 4325 1145 RESISTANT AC007347.1 CD99 DST FOXC1 FOXF1 GOLGA8A GOLGA8B GSC HOXA5 HO;%ï$6 HO;%ï$6 HOXB3 HOXB4 HOXB9 J01415.3 MAMDC2 MAP1A MMP2 MSI2 07ï&2 07ï&2 MTRNR2L8 NEGR1 NPTX1 PTGDS 53ï% 53ï+ 53ï3 53ï' 53ï) 53ï. 53ï* 536 SEPP1 TNFRSF4 TRGC1 TRGC2 TRGJP1 TRGJP2 TRGV9 USP44 Highly sensitive Resistant 2 0 1 2 Value Color Key a) b)
38
0.05) overexpressed (>log 2-fold) genes in the sensitive group as compared to the resistant group.
In study III, we aimed to identify gene expression biomarkers for venetoclax resistance. Availabilityof a larger sample set, especially gene expression data, allowed to apply machine learning analysis. The analysis was performed between gene expression and venetoclax responses.
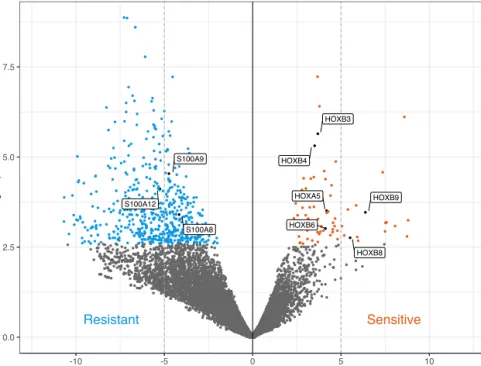
Figure 9. Volcano plot highlighting differentially expressed genes in venetoclax sensitive and resistance samples, respectively. The linear regression analysis was performed between venetoclax response (sDSS) and protein-coding genes (n=19,220) by correcting for the possible technical covariates (e.g., gender, RNA-seq library preparation method, RNA extraction kits). The S100 genes were further validated at expression (RT-qPCR) and protein (Western blot) level in venetoclax resistant AML patient samples.
The analysis resulted in 601 significantly associated genes (FDR < 0.05). Of these genes, 252 were positively and 349 negatively associated with venetoclax response. The positively associated genes included five HOX
family genes, namely HOXB5, HOXB6, HOXB7, HOXB8 and HOXB9,
!" # $
39 confirming findings from study II58. In contrast, amongst the most
significantly associated genes were three S100 family genes, namely
S100A6, S100A8, and S100A9 (FDR < 0.05). Taken together, HOX and
S100 family genes were overexpressed in venetoclax sensitive and resistance AML samples, respectively (Figure 9).
Furthermore, we aimed to identify possible drugs that effectively target venetoclax resistant patient samples. The expression of S100A8 and
S100A9 genes was correlated with response to 349 approved drugs and
emerging investigational chemical compounds. The analysis resulted in a positive correlation between S100A9 gene and BET inhibitor birabresib. Considering that birabresib re-sensitizes AML cell to venetoclax, the combination of birabresib and venetoclax was tested. Intriguingly, we found strong synergy between birabresib and venetoclax in S100A8/A9