Impact Evaluation of a Conditional
Cash Transfer Program
The Nicaraguan
Red de Protección Social
John A. Maluccio
Rafael Flores
RESEARCH
REPORT
141
INTERNATIONAL FOOD POLICY RESEARCH INSTITUTE WASHINGTON, DC
written permission. To obtain permission, contact the Communications Division <[email protected]>.
International Food Policy Research Institute 2033 K Street, NW
Washington, DC 20006-1002 USA Telephone +1-202-862-5600 www.ifpri.org
Library of Congress Cataloging-in-Publication Data Maluccio, John, 1964–
Impact evaluation of a conditional cash transfer program : the Nicaraguan Red de Protección Social / John A. Maluccio and Rafael Flores.
p. ; cm. — (Research report ; 141) Includes bibliographical references. ISBN 0-89629-146-4 (alk. paper)
1. Red de Protección Social (Nicaragua)—Evaluation. 2. Economic assistance, Domestic—Nicaragua—Evaluation. 3. Public welfare—Nicaragua. 4. Child wel-fare—Nicaragua. 5. Poverty—Nicaragua. I. Flores, Rafael. II. International Food Policy Research Institute. III. Title. IV. Research report (International Food Policy Research Institute) ; 141.
[DNLM: 1. Red de Protección Social (Nicaragua) 2. Nutrition Policy— economics—Nicaragua. 3. Food Services—economics—Nicaragua. 4. Child Welfare—economics—Nicaragua. 5. Health Status—Nicaragua. 6. Poverty— Nicaragua. 7. Financial Support—Nicaragua. WA 695 M261i 2005]
HC146.Z9P639 2005 362.5'82'097285—dc22
Contents
List of Tables iv List of Figures vi Foreword vii Acknowledgments viii Summary ix 1. Introduction 12. Design and Implementation of the Red de Protección Social 4 3. Design of the Evaluation, Methodology, and Validity 11 4. The Effects of Conditional Cash Transfers: The Red de Protección Social 26
5. Conclusions 56
Appendix A—Descriptive Chronology of RPS Program Activities in Phase I 59 Appendix B—Household Targeting in Geographically Targeted Areas 61 Appendix C—Contractual Indicators for One-Year RPS Evaluation in
IADB Loan Contract 62
References 63
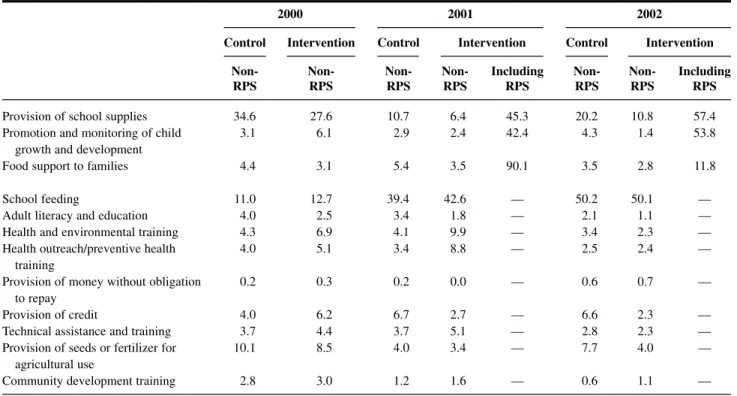
2.1 Nicaraguan RPS eligibility and benefits in Phase I 7 2.2 Nicaraguan RPS beneficiary co-responsibilities monitored in Phase I 9 3.1 Calculation of the double-difference estimate of average program effect 12 3.2 Survey non-response and subsequent attrition 20 3.3 Comparison of intervention and control comarcas at baseline 2000 22 3.4 Percentage of households benefiting from development programs
and services 25
4.1 RPS average effect on annual total household expenditures 27 4.2 RPS average effect on per capita annual total household expenditures 29 4.3 RPS average effect on per capita annual food expenditures 30 4.4 RPS average effect on food shares (percentage) 31 4.5 RPS average effect on the composition of food expenditures 32 4.6 RPS average effect on hours worked last week: Women 34 4.7 RPS average effect on hours worked last week: Men 35 4.8 RPS average effect on enrollment, children age 7–13 in first to fourth grades 38 4.9 RPS average effect (2000–02) on school advancement, children age 7–13 in
first to fourth grades, by starting grade in 2000 42 4.10 RPS average effect on school advancement, children age 7–13 in first to
fourth grades (2000–02), by poverty group 43 4.11 RPS average effect on working, children age 7–13 in first to fourth grades 44 4.12 RPS average effect on percentage of children age newborn to 3 years taken
to health control in past 6 months 45 4.13 RPS average effect on percentage of children age newborn to 3 years taken
to health control and weighed in past 6 months 45 4.14 RPS average effect on percentage of children age newborn to 3 years taken
to health control and weighed in past 6 months, by poverty group 46 4.15 RPS average effect on percentage of children age 12–23 months with
updated vaccination 47
4.16 Malnutrition in Central American countries 50
4.17 RPS effect on percentage of children under age 5 who are stunted
(HAZ <–2.00) 51
4.18 RPS effect on percentage of children under age 5 who are wasted
(WHZ <–2.00) 52
4.19 RPS effect on percentage of children under age 5 who are underweight
(WAZ <–2.00) 53
4.20 RPS effect on HAZ for children younger than age 5 53 4.21 RPS average effect on percentage of children age 6–59 months given iron
supplement (ferrous sulfate) in past 4 months 54 4.22 RPS effect on percentage of children age 6–59 months with anemia 54 4.23 RPS effect on average hemoglobin for children age 6–59 months 54
3.1 Illustration of the double-difference estimate of average program effect 13 4.1 Density function of per capita annual total expenditures in 2002:
Control versus intervention 30 4.2a Enrollment in 2000 for 7- to 13-year-olds who had not completed fourth grade,
by age 36
4.2b Enrollment in 2000 for 7- to 13-year-olds who had not completed fourth grade, by poverty group and by sex 36 4.3a Current attendance in 2000 for 7- to 13-year-olds who had not completed
fourth grade, by age 37
4.3b Current attendance in 2000 for 7- to 13-year-olds who had not completed
fourth grade, by poverty group and by sex 37 4.4a RPS average effect (2000–02) on enrollment for 7- to 13-year-olds who had
not completed fourth grade, by age 39 4.4b RPS average effect (2000–02) on enrollment for 7- to 13-year-olds who had
not completed fourth grade, by poverty group and by sex 39 4.5a RPS average effect (2000–02) on current attendance for 7- to 13-year-olds who
had not completed fourth grade, by age 41 4.5b RPS average effect (2000–02) on current attendance for 7- to 13-year-olds who
had not completed fourth grade, by poverty group and by sex 41
Foreword
I
n the 1990s Mexico launched a new social program—PROGRESA (now known as Opor-tunidades). As a conditional cash transfer program, PROGRESA integrated investment in human capital with access to a social safety net. From 1998 to 2000, the International Food Policy Research Institute (IFPRI) assisted in evaluating the program. Much of the ensuing research is summarized in IFPRI Research Report 139 by Emmanuel Skoufias.Since the inception of PROGRESA, several countries, particularly in Latin America, have implemented similar programs. One reason for the growing popularity of these programs is that, by encompassing various dimensions of human capital, including nutritional status, health, and education, they are able to influence many of the key indicators highlighted in national poverty reduction strategies. One of these pilot programs, the Red de Protección Social(RPS), modeled after PROGRESA, was begun in Nicaragua in 2000.
IFPRI conducted a quantitative impact evaluation of this program. Findings show that the program was effective in several domains, largely erasing differences in health-care and schooling outcomes across expenditure groups. Moreover, the program overcame obstacles found in the lower-income settings of Nicaragua, compared to Mexico, Colombia, or Brazil. One unique aspect of RPS was its approach to health-care supply. Government-contracted pri-vate providers supplied the services rather than the Ministry of Health. The results show that such an approach can be an effective delivery mechanism in areas where government provision might prove difficult.
In late 2002, based in part on the positive findings of the various evaluations, the govern-ment of Nicaragua and the Inter-American Developgovern-ment Bank agreed to a continuation and expansion of a modified program for three more years. IFPRI remained involved in the eval-uation of that second phase, including a qualitative evaleval-uation, and the results continued to show that the program was effective in a number of important areas. Nevertheless, at this writ-ing the future of the program is uncertain. Rigorous evaluations are important components of the policymaking process, but they are not the only ones.
Joachim von Braun Director General, IFPRI
Acknowledgments
T
his research was carried out under the evaluation of the Nicaraguan Red de Protección Social by the International Food Policy Research Institute for the Nicaraguan Govern-ment and in part draws from reports prepared under that project. We thank the Red de Protección Social team, particularly Leslie Castro, Tránsito Gómez, Carold Herrera, Carlos Lacayo, and Mireille Vijil, for continued support during the evaluation. We also thank Natàlia Caldés, Oscar Neidecker-Gonzalez, Alexis Murphy, and Jane Rhode for research assistance and Michelle Adato, David Coady, Peter Orazem, Ferdinando Regalía, Marie Ruel, Lisa Smith, Máximo Torero, and two anonymous referees for many helpful comments.Summary
I
n recent years, investing in the human capital of the poor has been seen as crucial to alle-viating long-term poverty. Concomitantly there is growing recognition of the need for so-cial safety nets to protect poorer households from poverty and its consequences during the push for economic growth. Not only are the stimulation of economic growth and investment in social safety nets both important strategies for economic development, they are also poten-tially complementary, because effective social safety nets may contribute directly to economic growth via improved human capital.Consistent with this view, several Latin American countries have introduced conditional cash transfer programs that integrate investment in human capital with access to a social safety net. The primary objective of these programs is to generate a sustained decrease in poverty in some of the most disadvantaged areas. And their basic premise is that a major cause of the intergenerational transmission of poverty is the inability of poor households to invest in the human capital of their children.
These programs target the poorest communities and households and condition the cash transfers on attendance at school and health clinics. This effectively transforms cash transfers into human capital subsidies for poor households. By encompassing various dimensions of human capital, including nutritional status, health, and education, these programs have been able to influence many of the key indicators highlighted in national poverty reduction strate-gies. One early such program was PROGRESA in Mexico, begun in 1997.
Nicaragua’s RPS
Modeled after PROGRESA, the Nicaraguan Red de Protección Social(RPS) or “Social Safety Net” is designed to address both current and future poverty via cash transfers targeted to households living in poverty in rural Nicaragua. By targeting the transfers to poor households, the program alleviates short-term poverty. By linking the transfers to investments in human capital, the program addresses long-term poverty. The transfers are conditional, and house-holds are monitored to ensure that they undertake prescribed actions intended to improve their children’s human capital. RPS’s specific objectives include supplementing household income for up to three years to increase expenditures on food, reducing school dropout rates during the first four years of primary school, and increasing the health care and nutritional status of children under five years of age.
Piloted in 2000, RPS had a budget of $11 million, representing approximately 0.2 percent of Nicaragua’s gross domestic product or 2 percent of annual recurring government spending on health and education. Based in part on a quantitative impact evaluation conducted by the International Food Policy Research Institute, the Inter-American Development Bank and the government of Nicaragua expanded the program in 2002 with a $22 million budget intended to continue the program for an additional three years.
Findings of the Impact Evaluation
This research report presents the main findings of a quantitative impact evaluation of RPS against its primary objectives. To the authors’ knowledge, this RPS study is the first rigorous, experimental evaluation of a government program in Nicaragua, and as such the main contributions of the research are empirical. The evaluation design is based on a randomized, community-based intervention with measurements before and after the intervention in both treatment and control communities.
In its pilot phase, RPS had positive and significant effects on a broad range of indicators and outcomes. Where it did not, the lack of such effects was often due to improvements in the control group. Nearly all estimated effects were larger for the extremely poor, often reflecting their lower starting points. As a result, the program reduced the inequality of most outcomes across expenditure classes.
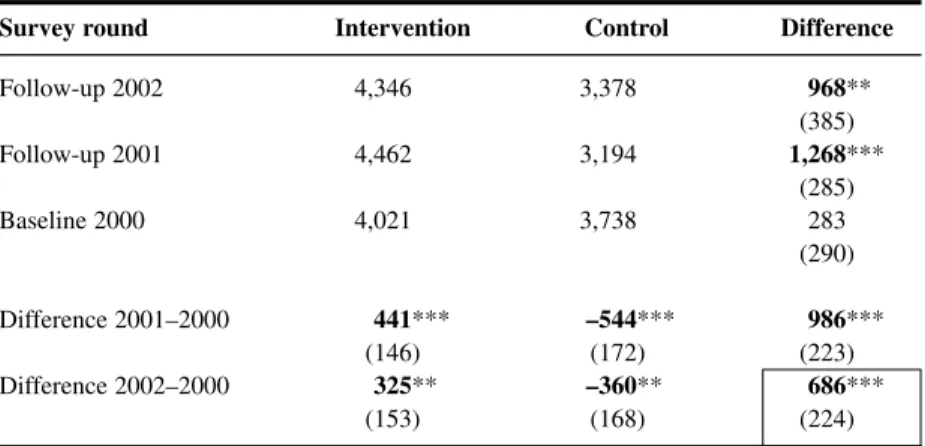
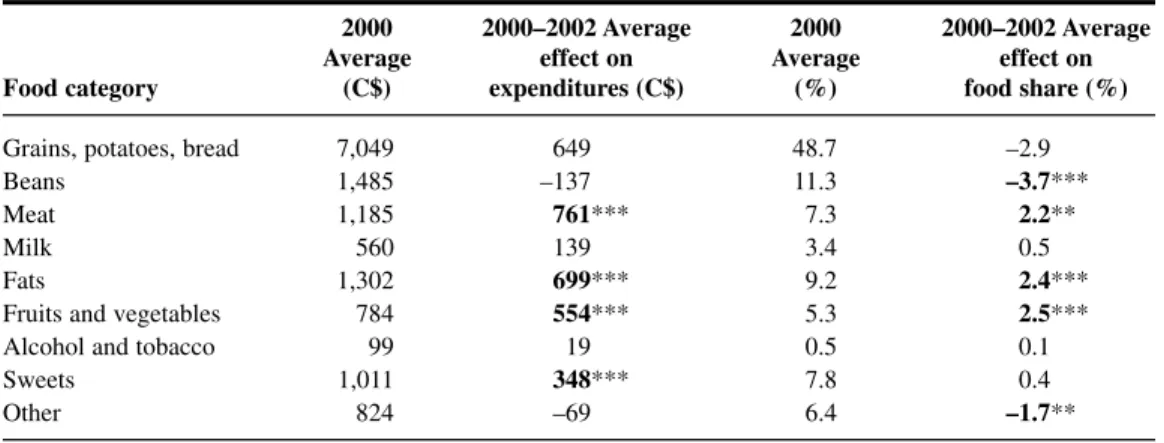
On average, RPS supplemented total annual per capita household expenditures by 18 per-cent, and most of this increase was spent on food. The program resulted in an average increase of 640 Nicaraguan córdobas in annual per capita food expenditures and an improvement in the diet of beneficiary households. Expenditures on education also increased significantly, though there was no discernible effect on other types of investment expenditures. The economic cri-sis experienced by these communities during the period studied enabled RPS to operate some-what like a traditional social safety net, aiding households during a downturn.
RPS produced a massive average net increase in school enrollment of 13 percentage points and an even larger effect of 20 percentage points on current attendance for the target popula-tion. The number of children in grades 1–4 who advanced two grades between 2000 and 2002 increased by 7.3 percentage points, despite the fact that advancement past the fourth grade was not a formal requirement of the program. In tandem with the increased schooling, the percent-age of working children percent-aged 7–13 declined by 5.6 percentpercent-age points.
Furthermore, the impact evaluation revealed an average net increase of 16 percentage points in the participation of children under age 3 in VPCD, the health-care program. At the same time, the services provided by the program, as measured by process indicators (including whether the child was weighed and whether the child’s health card was updated), improved even more. Participation by children ages 3–5 also increased substantially. As with the effects for expenditures and schooling, average program effects for VPCD measures are larger among poorer households.
While it was not possible to demonstrate statistically that RPS increased vaccination cov-erage for children ages 12–23 months in the intervention group, vaccination rates did climb 30 percentage points in the intervention and control areas at a time when they were, on average, decreasing in rural areas nationally.
Finally, the more varied household diet and increased use of preventive health-care services for children were accompanied by an improvement in the nutritional status of beneficiary chil-dren under age 5. The net effect was a decline of 5.5 percentage points in the number of stunted children. This decline was more than 1.7 times faster than the rate of annual improvement seen at the national level between 1998 and 2001. Despite improvements in the distribution of iron supplements to these same children, however, RPS was unable to improve hemoglobin levels or lower rates of anemia.
Conclusion
RPS has improved a number of the indicators included in the Nicaraguan national poverty re-duction strategy, at a time when many of them were not on track to achieve the goals set out
in that plan. The evidence from the evaluation strongly suggests that, if the program were to be expanded elsewhere in the poor rural areas of Nicaragua (as it was in 2003), it would be effective. As such, RPS could prove to be an important component of Nicaragua’s overall poverty reduction policy.
C H A P T E R 1
Introduction
I
n recent years, increasing emphasis has been placed on the importance of human capital in stimulating economic growth and social development. Consequently, investing in the human capital of the poor is widely seen as crucial to alleviating poverty, particularly in the long term. There is also growing recognition of the need for social safety nets to protect households from poverty and its consequences during the push for economic growth (World Bank 1997). Although at first glance stimulating economic growth and investing in social safety nets ap-pear to be different strategies for economic development, both are important. They are also potentially complementary, as effective social safety nets may directly contribute to economic growth via improved human capital, particularly in the long term (Morley and Coady 2003).Consistent with this view, several Latin American countries have introduced conditional cash transfer programs that integrate investing in human capital with access to a social safety net. One reason for the growing popularity of these programs is that by encompassing various dimensions of human capital, including nutritional status, health, and education, they are able to influence many of the key indicators highlighted in national poverty reduction strategies. One of the first, and largest, programs was the Programa Nacional de Educación, Salud y Alimentación(PROGRESA) in Mexico, begun in 1997. Another large program is Bolsa Ali-mentação,a nutrition-oriented cash transfer program in Brazil. A third large program is the
Programa de Asignación Familiar(PRAF) in Honduras. In this report, we examine a fourth such program, the Nicaraguan Red de Protección Social(RPS) or “Social Safety Net.”
In 2003, the Inter-American Development Bank (IADB), a key actor in promoting and fi-nancing this type of program, indicated that “conditional cash transfer programs (CCTs) have replaced unrestricted cash payments and price subsidies in several Latin American countries” (IDEA 2003, p. 1). Nancy Birdsall, president of the Center for Global Development, states: “I think these programs are as close as you can come to a magic bullet in development. . . . They’re creating an incentive for families to invest in their own children’s futures. Every decade or so, we see something that can really make a difference, and this is one of those things.”1
The primary objective of these programs is to generate a sustained decrease in poverty in some of the most disadvantaged regions in their respective countries. Their basic premise is that a major cause of the intergenerational transmission of poverty is the inability of poor households to invest in the human capital of their children. Supply-side interventions, which increase the availability and quality of education and health-care services, are often ineffec-tive in resolving this problem, since the resource constraints facing poor households preclude them from incurring the private costs associated with utilizing these services (e.g., travel costs
1“To help poor be pupils, not wage earners, Brazil pays parents,” New York Times,January 3, 2004.
and the opportunity cost of women’s and children’s time). These programs attack this problem by targeting transfers to the poor-est communities and households and condi-tioning the transfers on actions intended to improve children’s human capital develop-ment. This effectively transforms cash trans-fers into human capital subsidies for poor households.
Modeled after PROGRESA, RPS is designed to address both current and future poverty via cash transfers targeted to poor households in rural Nicaragua. The transfers are conditional, and households are moni-tored to ensure that, among other stipula-tions, their children are attending school and making visits to preventive health-care providers. When households fail to fulfill those obligations, they lose their eligibility. By targeting the transfers to poor house-holds, the program alleviates short-term poverty. By linking the transfers to invest-ments in human capital, the program ad-dresses long-term poverty. RPS’s specific objectives include:
● Supplementing household income for up to 3 years to increase expenditures on food
● Reducing dropout rates during the first 4 years of primary school
● Increasing the health-care and nutri-tional status of children under age 5 RPS comprised two phases over 5 years, starting in 2000. The pilot phase (or Phase I) lasted 3 years and had a budget of US$11 million, representing approximately 0.2 percent of gross domestic product (GDP) or 2 percent of annual recurring government
spending on health and education (World Bank 2001, annex 21). As a condition of the IADB loan financing the program, and to assess whether the program merited expan-sion in the same or in an altered form, the Government of Nicaragua solicited various external evaluations of Phase I. The Interna-tional Food Policy Research Institute (IFPRI) conducted the quantitative impact evalua-tion, using a randomized community-based design. In late 2002, based in part on the pos-itive findings of the various evaluations,2
the Government of Nicaragua and IADB agreed to a continuation and expansion of the program, known as Phase II, for three more years with a budget of US$22 million. This report presents the principal find-ings from the quantitative impact evaluation of Phase I of RPS for a wide range of out-comes related to the program’s objectives, including (1) household (food) expenditures, (2) child schooling and child labor, (3) pre-ventive health care of children under age 5, and (4) nutritional status of children younger than 5 years of age.3Although they have a
long history and are widely used in devel-oped countries, rigorous, large-scale, ran-domized evaluations of social programs such as the one reported on have been rare in developing countries (Newman, Rawlings, and Gertler 1994; National Research Coun-cil 2001). Such studies have been increasing in popularity recently, however, after the widely cited case of PROGRESA (Raw-lings and Rubio 2005; Skoufias 2005).
Although not new, the methodology em-ployed in this report is generally considered “best practice” for evaluations. Moreover, to our knowledge, this research is the first
2The findings are summarized in a policy brief available in English and Spanish (Maluccio et al. 2005). Results
reported there differ slightly from those presented in this report because of minor differences in the sample ana-lyzed and in the methodology employed.
3In 2003, IFPRI was commissioned to carry out a qualitative evaluation. Adato and Roopnaraine (2004) present
that evaluation which includes results on many (social) dimensions of the program not contemplated here, in-cluding program communication, empowerment, social effects of targeting, and relationships within households and communities. The focus in the present research report is on the earlier quantitative evaluation, although we draw on the qualitative work in some instances where the two overlap.
rigorous, experimental evaluation of a gov-ernment program in Nicaragua. The main contributions of the research, then, are em-pirical. The results demonstrate that the program was effective in several domains. Indeed, it largely erased differences in health-care and schooling outcomes across expenditure groups. Nicaragua is a lower-income country when compared to Mexico, Columbia, or Brazil, where much of the research on conditional cash transfer pro-grams has been done. As a result, there was skepticism about capacity to implement the program. Moreover, certain design features needed to be modified for the Nicaraguan
setting. For example, because schooling outcomes are lower, the targeted population for school transfers was different from that used in PROGRESA. The results show that a conditional cash transfer program can be effective in a low-income setting. One unique aspect of RPS relative to most other programs of this type was its approach to health-care supply, in which services were provided by government-contracted non-governmental organizations (NGOs) rather than directly by the Ministry of Health. The results show that such an approach can be an effective delivery mechanism.
Design and Implementation of the
Red de Protección Social
T
o permit an assessment of how RPS altered behavior, it is first necessary to describe how the program operates and how it has evolved.4Program Targeting
In the design phase of RPS, rural areas in all 17 departments of Nicaragua were eligible for the program. The focus on rural areas reflects the distribution of poverty in Nicaragua—of the 48 percent of Nicaraguans designated as poor in 1998, 75 percent resided in rural areas (World Bank 2001). For Phase I of RPS, the Government of Nicaragua selected the departments of Madriz and Matagalpa from the northern part of the Central Region, on the basis of poverty level as well as on their capacity to implement the program. This region was the only one that showed worsening poverty between 1998 and 2001, a period during which both urban and rural poverty rates were declining nationally (World Bank 2003). In 1998, approximately 80 percent of the rural population of Madriz and Matagalpa was poor, and half of these people were extremely poor (IFPRI 2002). In addition, these departments had easy physical access and communication (including being less than a one-day drive from the capital, Managua, where RPS is headquartered), relatively strong institutional capacity and local coordination, and reasonably good coverage of health posts and schools (Arcia 1999). By targeting purpo-sively, RPS avoided devoting a disproportionate share of its resources in Phase I to increasing the supply of educational and health-care services.
In the next stage of geographic targeting, all six (out of 20) municipalities that had the small-scale participatory development program Microplanificación Participativa (Participa-tory Micro-planning [MP]) run by the national Emergency Social Investment Fund (FISE) were chosen.5The goal of that program was to develop the capacity of municipal governments
to select, implement, and monitor social infrastructure projects such as school and health-post construction, with an emphasis on local participation. It is possible, then, that the selected municipalities had atypical capacity to carry out RPS, although this may not have been wide-spread, as MP did not completely cover the participant municipalities and it is unclear how
4Appendix A provides a descriptive chronology of activities undertaken during Phase I.
5The six were Totogalpa and Yalagüina municipalities in the department of Madriz, and Ciudad Darío, El
Tuma-La Dalia, Esquipulas, and Terrabona municipalities in the department of Matagalpa.
successful it was. Regardless of whether there was significant preexisting capacity, the six municipalities were well targeted in terms of poverty. Between 36 and 61 per-cent of the rural population in each of the chosen municipalities was extremely poor and 78–90 percent was extremely poor or poor (IFPRI 2002), compared with 21 and 45 percent, respectively, for Nicaragua as a whole (World Bank 2003). Although not the poorest municipalities in the country, or in the chosen departments for that matter, the proportion of impoverished people living in these areas was still well above the national average.
In the last stage of geographic targeting, a marginality index was constructed, based on information from the 1995 National Pop-ulation and Housing Census, and an index score was calculated for all 59 rural census
comarcas6 in the selected municipalities.
The index was the weighted average of a set of comarca-level indicators (with re-spective weights in parentheses) known to be highly associated with poverty (Arcia 1999; Maluccio 2005):
1. Average family size (0.1)
2. Percentage without piped water in the home or yard (0.5)
3. Percentage without a latrine (0.1) 4. Percentage of persons over age 5 who
are illiterate (0.3)
Higher index scores were associated with more impoverished areas. Since the index does not reliably distinguish between co-marcas with similar scores, the 59 rural
comarcas were grouped into four priority
levels after the highest index score was re-normalized to 100: a score of above 85 was given highest priority (priority 1); 70–85, priority 2; 60–70, priority 3; and below 60, lowest priority, 4. The 42 comarcas with priority scores 1 and 2 were eligible for the first stage of Phase I.7
Although the initial program design called only for geographic targeting (with
allresident households eligible) in these 42
comarcas, about 6 percent of households deemed to have substantial resources by RPS were excluded ex ante from the program.8
At the outset, then, just under 90 percent of households in intervention comarcas were beneficiaries. Consequently, the percentage of poor excluded from the program, or undercoverage, was less than 5 percent in these geographically targeted comarcas.
Moreover, because the targeted areas were very poor, the percentage of beneficiaries who were non-poor (i.e., leakage) was also minimal, approximately 15 percent (IFPRI 2002). Despite these (quantitative) findings that the program was well targeted, there was substantial confusion at the local level about the beneficiary selection process (Adato and Roopnaraine 2004), raising the possibility of community tension as the re-sult of excluding some families.
Program Design
RPS has two core components: (1) food security, health, and nutrition and (2) ed-ucation.
Each eligible household9received a cash
transfer known as the bono alimentario or
DESIGN AND IMPLEMENTATION OF THE RED DE PROTECCIÓN SOCIAL 5
6Census comarcasare administrative areas within municipalities that typically include between one and five
small communities averaging 100 households each. They are comprised of census segments and determined by the National Institute of Statistics and Censuses and in some cases do not coincide with locally defined areas also referred to as comarcas.
7IFPRI (2002) and Maluccio (2005) provide further details on the RPS targeting methodology. 8Appendix B describes how households were determined ineligible.
9RPS defined a household as a group of persons habitually living, eating, and cooking together. The same
“food security transfer”10every other month,
contingent on attendance at educational workshops held every other month and on bringing their children under age 5 for scheduled preventive (or well child) health-care appointments with specially contracted providers. The workshops were held within the communities and typically included about 20 participants. They covered house-hold sanitation and hygiene, nutrition, re-productive health, breastfeeding, and related topics. To ensure adequate supply in these poor, rural communities, RPS trained and paid private providers to deliver the specific health-care services required by the pro-gram. RPS adapted the individual counsel-ing material from the Integrated Attention to the Child (AIN) program in Honduras (Van Roekel et al. 2000). These services, provided free of charge to beneficiary households, in-cluded growth and development monitoring, vaccination, and provision of antiparasite medicine, vitamins, and iron supplements. Children younger than age 2 were seen monthly and those ages 2–5, every other month. In practice, mothers brought their children to the local service location (typi-cally a community center or house of one of the beneficiaries) to be seen by the health-care team working for the private provider. The prescribed procedure was the follow-ing. First, the professional nurse measured the child, inquired about the child’s health and the caretaker’s caring and feeding prac-tices, and checked the vitamin A supplemen-tation record. Then the doctor examined the child, prescribing appropriate antiparasite medicine or iron supplements according to the Ministry of Health protocol for making these prescriptions. If the child was growing well, the doctor congratulated the caretaker.
Then the caretaker returned to the nurse to receive individual counseling on how to maintain or improve growth, with key mes-sages on breastfeeding, child feeding, illness care, and hygiene, taking into account sev-eral factors, such as the age of the child, whether the child had gained weight ade-quately the previous month, and whether the child had been ill.
Each eligible household also received a cash transfer known as the bono escolar
or “school attendance transfer” every other month, contingent on enrollment and regu-lar school attendance of children ages 7–13 who had not completed fourth grade of pri-mary school. In addition, for each eligible child, the household received an annual cash transfer intended for school supplies (in-cluding uniforms and shoes) known as the
mochila escolar or “school supplies trans-fer,” which was contingent on enrollment. Unlike the school attendance transfer, which was a fixed amount per household regard-less of the number of children in school, the school supplies transfer was for each child.
To provide incentives to the teachers, who had some additional reporting duties and were likely to have larger classes after the introduction of RPS, and to increase resources available to the schools, there was also a small cash transfer, known as the
bono a la ofertaor “teacher transfer.”11This
was given to each beneficiary child, who in turn delivered it to the teacher. The teacher kept one half, while the other half was ear-marked for the school. The delivery of the funds to the teacher was monitored, but not their ultimate use.
Table 2.1 summarizes the eligibility re-quirements and demand and supply-side ben-efits of RPS. At the outset, nearly all
house-10One common definition for food security is “when all people at all times have both the physical and economic
access sufficient to meet their dietary needs to lead a healthy and productive life” (USAID 1992). In this report, we do not formally assess food security, however, but focus on indicators of food expenditures that are associated with food security.
11In rural Nicaragua, school’s parents’ associations often request small monthly contributions from parents to
holds were eligible for the food security transfer, which was a fixed amount per household, regardless of household size. Households with children ages 7–13 who had not yet completed the fourth grade of primary school were also eligible for the education component of the program.
The amounts for each transfer were ini-tially determined in U.S. dollars and then converted into Nicaraguan córdobas (C$) in September 2000, just before RPS began
dis-tributing transfers. Table 2.1 shows the orig-inal U.S. dollar annual amounts and their Nicaraguan córdoba equivalents (using the September 2000 average exchange rate of C$12.85 to US$1). The food security trans-fer was US$224 a year and the school at-tendance transfer US$112.12On its own,
the food security transfer represented about 13 percent of total annual household ex-penditures in beneficiary households before the program. A household with one child
DESIGN AND IMPLEMENTATION OF THE RED DE PROTECCIÓN SOCIAL 7
12IADB calculated the transfer amounts taking into account the extreme poverty gap, that is, the difference
be-tween the extreme poverty line and the average level of expenditures of the extremely poor reported in the 1998 LSMS (World Bank 2001). The 1998 daily per capita extreme poverty line (calculated to enable the purchase of a minimum requirement food basket) is US$0.58 and the extreme poverty gap, US$0.18. For comparison, the 1998 daily per capita poverty line is US$1.12. The amount for the school attendance transfer was calculated using an approximation of the opportunity cost of children multiplied by the average number of children ages 7–13 in households in extreme poverty. The sum of the food and school attendance transfers was an estimated average daily transfer of US$0.12, an amount designed to fill two-thirds of the average extreme poverty gap for extremely poor households.
Table 2.1 Nicaraguan RPS eligibility and benefits in Phase I
Program components
Food security, health, and nutrition Education
Eligibility
Geographic All householdsa All householdsawith children ages 7–13 who
targeting have not yet completed fourth grade of
primary school Demand-side benefits
Monetary Bono alimentario Bono escolar
transfers (food security transfer) (school attendance transfer)
C$2,880 per household per year C$1,440 per household per year
(US$224) (US$112)
Mochila escolar
(school supplies transfer)
C$275 per child beginning of school year (US$21)
Supply-side benefits
Services Health education workshops Bono a la oferta
provided every 2 months (teacher transfer)
and Child growth and monitoring C$80 per child per year given
monetary Monthly: Newborn to 2-year-olds to teacher/school (US$6)
transfers Every 2 months: 2- to 5-year-olds
Provision of antiparasite medicine, vitamins, and iron supplements Vaccinations (newborn to 5-year-olds)
benefiting from the education component would have received additional transfers of about 8 percent, yielding an average total potential transfer of 21 percent of total an-nual household expenditures. Over the 2 years, the actual average monetary transfer (excluding the teacher transfer) was approx-imately C$3,500 (US$272 or 17 percent of total annual household expenditures). This is approximately the same percentage of total annual household expenditures as the average transfer in PROGRESA, but more than five times as large as the transfers given in PRAF (Caldés, Coady, and Maluccio 2004). In contrast to PROGRESA, which indexes transfers to inflation, the nominal value of the transfers remained constant for RPS, with the consequence that the real value of the transfers declined by about 8 percent as a result of inflation over 2 years in Phase I. It is possible that any differences in the effectiveness of RPS over time re-sulted, in part, from a decline in the real value of the transfers, although such effects are likely to be small.
The value of the supply-side services, as measured by how much RPS paid to the providers, was also substantial. On an an-nual basis, the education workshops cost approximately US$50 per beneficiary and the health-care services for children under age 5, approximately US$110, including the value of the vaccines, antiparasite medicine, vitamins, and iron supplements, all of which were provided by the Ministry of Health.
To enforce compliance with program re-quirements, beneficiaries did not receive the food or education component(s) of the trans-fer if they failed to carry out any of the con-ditions listed in Table 2.2. The monitoring was done using the management informa-tion system (MIS) designed specifically for and by RPS. It comprised a continuously up-dated, relational database of beneficiaries, health-care providers, and schools. The MIS was also used to (1) select beneficiaries and prepare invitations to program incorporation assemblies, (2) calculate transfer amounts, (3) compile requests to the Ministry of
Health for vaccines and other materials, and (4) monitor whether health-care service providers were meeting their responsibili-ties. Decision rules capturing the require-ments in Table 2.2 were programmed di-rectly into the MIS. Data forms for the various program participants were designed to feed into this system (including the house-hold registry or census forms, school forms, and health-care provider forms that were all sent to the main office where they were en-tered into the computer).
Table 2.2 shows the four different “types” of beneficiary households in the program, who received different transfers and had to fulfill different requirements. Households with no children in the targeted age ranges were eligible only for the food security transfer but, at the same time, needed only to attend the health education workshops to qualify for continued receipt of the transfers. Households with children under age 5 (but without children ages 7–13 who had not completed the fourth grade) were also eligible for the food security transfer only, but had more requirements to fulfill, related to their young children. Households with children ages 7–13 who had not completed the fourth grade were eligible for both the food security and educa-tion transfers and were required to comply with the education-related conditions. To receive the education transfers, all target chil-dren had to comply; if one complied but an-other did not, the household did not receive the transfer. If, in addition, the household included children younger than age 5, the household was eligible for the same trans-fers but had more requirements to fulfill, in particular, those related to the health con-trols for young children. About 20 percent of the households had no targeted children, 25 percent only children under age 5, 20 per-cent only children ages 7–13, and the re-maining 35 percent both children younger than 5 years and 7- to 13-year-olds.
RPS allowed this latter type of house-hold to receive a partial transfer if it com-plied with the health-care requirements and
not the education requirements or vice versa. During the first 2 years of transfers, approximately 10 percent of beneficiaries were penalized at least once and therefore did not receive, or received only one com-ponent of, their transfer. It was also possible for households to be expelled from the program. Reasons for expulsion included (1) repeated failure to comply with pro-gram requirements, (2) failure to collect the transfer in two consecutive periods, (3) more than 27 unexcused school absences during
the school year per beneficiary child, (4) failure of a beneficiary child to be promoted to the next grade, and (5) discovery of false reporting of information during any part of data collection, including information about fulfillment of program responsibilities.13
Fewer than 1 percent of households were expelled during the first 2 years of transfers, although approximately 5 percent left the program voluntarily, for example, by drop-ping out or migrating out of the program area.
DESIGN AND IMPLEMENTATION OF THE RED DE PROTECCIÓN SOCIAL 9
13When it was learned that some, but not all, schools practiced automatic promotion, enforcement of the grade
promotion condition was deemed unfair and therefore was never enforced. Similarly, when there were some de-lays in the delivery of vaccines, the up-to-date vaccination condition was also never enforced. A third condition, punishment of children who did not have adequate weight gain, was dropped at the end of the Phase I because of a concern about the role of measurement error and the finding that the poorest households were more likely to be punished. These changes highlight the importance of careful consideration of the required responsibilities and how they are to be monitored during the design of a conditional cash transfer program. They also show the im-portance of flexibility during program implementation.
Table 2.2 Nicaraguan RPS beneficiary co-responsibilities monitored in Phase I
Household type Households Households with children
with no Households ages 7–13 who have targeted with children not completed children ages 0–5 fourth grade
Program requirement (A) (B) (C) (B) + (C)
Attend health education workshops every ✓ ✓ ✓ ✓
2 months
Bring children to prescheduled health- ✓ ✓
care appointments Monthly (0–2 years) Every 2 months (2–5 years)
Adequate weight gain for children ✓ ✓
younger than 5 yearsa
Enrollment in grades 1–4 of all targeted ✓ ✓
children in the household
Regular attendance (85 percent, i.e., no ✓ ✓
more than 5 absences every 2 months without valid excuse) of all targeted children in the household
Promotion at end of school yearb ✓ ✓
Deliver teacher transfer to teacher ✓ ✓
Up-to-date vaccination for all children ✓ ✓
under 5 yearsb
aThe adequate weight gain requirement was discontinued in Phase II starting in 2003. bCondition was not enforced.
Only the designated household repre-sentative could collect the cash transfers and, where possible, RPS designated the mother as that representative. The dominant reason for not selecting a woman was that either she was not living in the household or was not alive. This strategy mimics the de-sign of PROGRESA and PRAF and is based on evidence that resources in the hands of women often lead to better outcomes for child well-being and household food secu-rity (Strauss and Thomas 1995). As a result, more than 95 percent of the household representatives selected were women. These representatives attended the health educa-tion workshops and they were responsible for ensuring that the requirements for their households were fulfilled.
Although centrally administered, with its multisectoral approach across education, health, and nutrition, RPS required bureau-cratic cooperation at the national, municipal, and community levels. Given funding and administrative oversight from FISE during
Phase I, municipal planning and coordination was conducted by committees composed of delegates from the health and education ministries, representatives from civil soci-ety, and RPS personnel. This coordination proved important in directing supply-side responses to increased household demand for health and schooling services. At the
comarcalevel, RPS representatives worked with local volunteer representatives known as promotoras(beneficiary women chosen by the community), and local schools and health-care service providers, to implement the program. The promotoraswere charged with keeping beneficiary household rep-resentatives informed about upcoming health-care appointments for their children, upcoming transfers, and any failures in ful-filling the conditions. Each promotora
had, on average, 17 (SD 6) beneficiaries in her charge, although this average masked substantial variation ranging from 5 to 30 beneficiaries.
C H A P T E R 3
Design of the Evaluation,
Methodology, and Validity
T
o measure program effects, it is necessary to know what would have happened had the program not been implemented. The fundamental problem, of course, is that an individual, household, or geographic area cannot simultaneously undergo and not un-dergo an intervention. Therefore, it is necessary to construct a counterfactual measure of what would have happened if the program had not been available. The most powerful way to con-struct a valid counterfactual is to randomly select beneficiaries from a pool of equally eligible candidates.Evaluation Design and Double-Difference Methodology
The evaluation for RPS was based on a randomized, community-based intervention with measurements before and after the intervention in both treatment and control communities. One half of the 42 comarcas(targeted in the first stage of Phase I as described in the first sec-tion of Chapter 2) were randomly selected into the program. Thus, there are 21 comarcasin the intervention group and 21 distinct comarcasin the control group (IFPRI 2001a). Given the geography of the program area, however, control and intervention comarcasare in some cases adjacent to one another. Including a control from whom treatment was withheld was ethical because the effectiveness of the intervention was unknown and it was uncertain there was suf-ficient capacity to implement the intervention in all areas at once. In this case, random selec-tion would seem to be about as fair as any other arbitrary decision rule for selecting the first set of beneficiaries.
The selection was done at a public event in which representatives from the comarcas,the Government of Nicaragua, IADB, IFPRI, and the media were present. The 42 comarcaswere ordered by their marginality index scores and stratified into seven groups of six comarcas
each. Within each stratum, randomization was achieved by blindly drawing one of six colored balls without replacement (starting with three blue for intervention and three white for con-trol) from a box after the name of each comarca was called out. Thus, three comarcasfrom each group were randomly selected for inclusion in the program, while the other three were selected as controls. The evaluation was designed to last for 1 year—that is, the control group was meant to be a control for only 1 year, after which it was expected there would be capacity to implement the intervention everywhere.14Because of delays in funding for RPS as a result
of a governmental audit unrelated to the program, incorporation of households in the control
14As a result, another way to describe the experiment is that the program was randomly phased in.
comarcasinto the program was postponed until 2003, extending the possible length of the treatment–control evaluation by more than a year. In the end, control comarcas
waited a little over 2 years before being fully incorporated into the program during its second phase. Even with this extension, how-ever, the evaluation remains an evaluation of the short-term effects of the program (Thomas et al. 2003), although in some cases the effects on long-term indicators, such as child anthropometrics, are measured.
During the public selection, local leaders and government officials were informed generally about the program. This included that they were told that control comarcas
would enter the program after 1 year (al-though as just described, 1 year turned into 2). This was done to ensure participation in the evaluation. While RPS did not publicize this plan to households in control comarcas,
it would be naive to assume that households in control areas were entirely unaware of it. Over time they certainly would have learned about such a large program in neighboring villages and may even have been informed by local actors about their eventual possible participation. Some implications of this form of contamination for the experiment and in-terpretation of results are discussed later in this chapter.
Household and individual level data were collected in both the intervention and con-trol comarcas before and after RPS was implemented. This enables the use of the
double-difference method to calculate “av-erage program impact.”15 The resulting
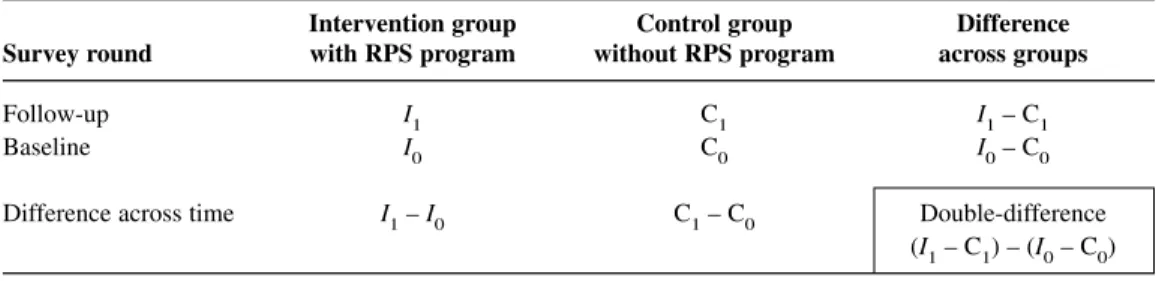
measures can be interpreted as the expected effect of implementing the program in a similar population elsewhere, subject to a number of caveats described below. The method is shown in Table 3.1 (which pre-sents the basic format for all the results presented in this report). The columns distin-guish between groups with and without the program (denoted by Ifor intervention and
Cfor control), and the rows distinguish be-tween before and after the program (denoted by subscripts 0 and 1). Anticipating one of the analyses presented below, consider the measurement of school enrollment rates for children. Before the program, one would expect the average percentage enrolled to be similar for the two groups, so that the quan-tity (I0 – C0) would be close to zero. Once the program has been implemented, how-ever, one would expect differences between the groups as a result of the program. Fur-thermore, because of the random assign-ment, one would expect the difference (I1–
C1) to measure the effect directly attributa-ble to the program. Indeed, (I1 – C1) is a valid measure of the average program effect under this design. A more robust measure of the effect, however, would account for any preexisting observable or unobservable dif-ferences between the two randomly assigned groups: this is the double-difference esti-mate obtained by subtracting the preexisting differences between the groups, (I0– C0),
15Ravallion (2001) provides a useful discussion on this and related evaluation tools. See also Baker (2000).
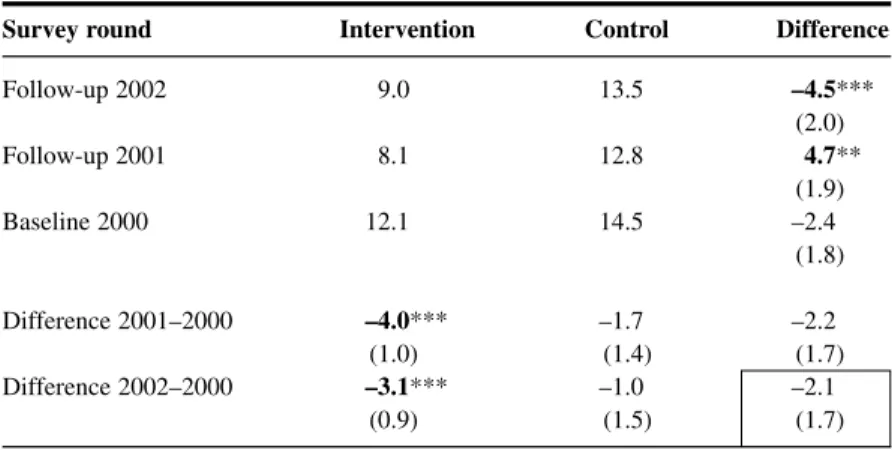
Table 3.1 Calculation of the double-difference estimate of average program effect
Intervention group Control group Difference Survey round with RPS program without RPS program across groups
Follow-up I1 C1 I1– C1
Baseline I0 C0 I0– C0
Difference across time I1– I0 C1– C0 Double-difference
from the difference after the program has been implemented, (I1– C1).
An alternative interpretation of the double-difference estimator emerges if one first considers the differences within the (in-tervention or control) groups. This approach begins with a reflexive estimator of the pro-gram effect, the difference over time for the intervention group, (I1 – I0). It is a poten-tially biased estimator because it includes all changes over time in enrollment rates in the intervention group, regardless of what causes them. For example, if increases in public investment nationally were improv-ing school access and leadimprov-ing to changes in enrollment, these effects would show up in the difference over time in the intervention group, in addition to the effects attributable to the program. The obvious measure for the non-program-related change over time in the intervention group is the change over time in the control group, (C1– C0). Thus the average program effect is estimated by first considering the total change over time in the intervention group, and then subtract-ing from this the change over time in the
control group. As above, this yields the double-difference estimator.
The alternative interpretation is probably best illustrated graphically, as in Figure 3.1. For an arbitrary indicator measured over time, it is assumed (for the graph) that as a result of the randomization, both the intervention and control groups start at the same level (on the vertical axis). No change in the indi-cator over time would lead to the outcome depicted by point I0= C0in 2002; if only the intervention group were being followed, one would then naively calculate the effect of the program as I1– I0. However, as the control group makes clear, there was a trend over time that led to an improvement (in this example) of C1 – C0. Estimates ignoring this would overstate the effect of the pro-gram. Instead, the correct estimate of the program effect is I1– C1; this is the double-difference estimate since I0= C0. In the case where the trend line for the control group was declining, ignoring that effect would tend to understate the program effect.16
For this work, the double-difference technique is extended to account for three
DESIGN OF THE EVALUATION, METHODOLOGY, AND VALIDITY 13
16Relaxing the (unnecessary) assumption that the two groups start at identical points slightly complicates the
graphical exposition, but the logic remains the same.
Figure 3.1 Illustration of the double-difference estimate of average program effect
C1 I1 I =0 C0 Intervention Control Baseline Follow-up
measurements taken in 2000, 2001, and 2002. The basic estimating equation is shown in equation (1).
Eict= α0+ α1Y1+ α2Y2+ α3Pc+
δ1Y1Pc+ δ2Y2Pc+ µic+ νict (1)
where
Eict= outcome variable of interest for individual (or household) iin co-marca cat time t
Y1= (1) if year 2001
Y2= (1) if year 2002
Pc= (1) if program intervention in
comarca c
µic= all (observed and unobserved) individual-, household-, or comarca -level time-invariant factors
νict= unobserved idiosyncratic
individual-, household-, or comarca -level and time-varying error
All the αand δare unknown parameters. The key parameters of interest are δ1 and δ2; δ1is the double-difference estimator of the average program effect for 2001 (rel-ative to 2000) and δ2for 2002 (relative to 2000). The program effects are identified by the randomized design. Given the random-ization of Pc, it (and any interactions in-volving it) is uncorrelated with all observed or unobserved individual-, household-, or
comarca-level variables so that the δs can be consistently estimated. It is not necessary to include other variables in this regression for the consistency of the estimator for δ1 and δ2, although doing so increases the pre-cision of the estimates.
Since we do not condition on the house-hold-level decision to participate in RPS but instead only on whether the program was available in the household’s comarca, this framework yields what is commonly referred to as an estimate of the intent-to-treat effect. The estimator is not subject to selection biases associated with the decision to par-ticipate in the program since it relies only on the randomized design. About 10 percent of
the households in the intervention areas were either excluded by RPS or chose not to participate in the program. Survey sam-ple households in this subgroup are not pro-gram beneficiaries so that basing estimates on the sample that includes them “dilutes” the estimated effects of the program. The intent-to-treat methodology we use is con-servative, then, relative to measuring the effect of the treatment on the treated. To es-timate the effect of the treatment on the treated, rather than estimating the double-difference, one would instead have to en-dogenize the participation decision, most likely using the random program placement as an instrumental variable. This approach amounts to rescaling the intent-to-treat esti-mates by the fraction of program partici-pants. Since the participation rates are rela-tively high, it does not yield very different estimates, so we do not present them.
To assess differences in effects for the poor and non-poor for the analyses consid-ered below, we also classify households into three household expenditure (or poverty) groups—extremely poor, poor (but not ex-tremely poor), and non-poor—based on their preprogram per capita annual total household expenditures (including own-production) measured in 2000 and using 2001 national poverty lines developed by the World Bank (World Bank 2003). Double-difference esti-mates were calculated within each poverty group and when they differ across the groups are discussed in the text and presented in some of the tables.
In the double-difference analyses that fol-low, only households interviewed in all three survey rounds, that is, the balanced panel sample, are included. Standard errors are calculated allowing for heteroskedasticity and for clustering at the comarca level (StataCorp 2001). For simplicity, we do not control, for example, for the fact that the randomization was at the comarca level— so-called “community effects.” When we do control for community effects or when we do not control for heteroskedasticity and
nearly all the estimates increases, leading to stronger statistical significance. The estima-tions that follow also ignore the stratified sample design which can be corrected for statistically by using comarca-level sample weights; correcting for this aspect of the design makes no substantive changes to the estimated effects.
Issues and Concerns
Related to the
Experimental Design
The value of randomized evaluations is widely recognized. When done well, recipi-ents and nonrecipirecipi-ents will have, on aver-age, the same observed and, more important (since they are more difficult to control for), unobserved, characteristics. As a result, they establish a credible basis for comparison, freed from selectivity concerns, and the di-rection of causality is certain. Nonrandom-ized approaches, on the other hand, typically rely on assumptions that are often hard to believe and almost always hard to verify (Burtless 1995).17A further advantage to a
randomized design is that program impact is easy to calculate and, as a consequence, easier to understand and explain.
Of course, randomized evaluations are not a panacea. For example, they can be costly (both financially and politically) and often one must wait years for results, making them less useful for pressing policy deci-sions. Moreover, randomized design evalu-ations can provide only partial answers to some important questions. This is often re-ferred to as their “black box” nature. The evaluation only allows us to assess most rigorously the effect of the program (or pro-gram components) that it was explicitly
de-signed to assess.18 Without further
model-ing and assumptions (not already explicit to the evaluation design), we are in the dark if we want to consider how even slightly changing the program alters the effect on the outcomes under consideration. For ex-ample, RPS provided a package of services in which all households were eligible for the food security transfer, regardless of whether they also received the educational transfers. Using only the randomized design on its own, it is difficult to tease apart the effects of the education component of the program from the nutrition component—all the ob-served effects, even those that pertain specif-ically to educational outcomes, are the re-sult of the program as a whole. Similarly, it is difficult to assess the relative importance of the demand-side stimulus versus the supply-side interventions for the observed improvements in health care—all the ob-served effects reflect the combination of supply- and demand-side influences. Nor can we easily and reliably assess what the effect of the program would be if the size of any one of the transfers were to change, as they did when RPS was expanded in 2003.
While in this report we focus primarily on findings that derive directly from the ex-perimental design, extensions to the analy-sis that begin to address the issues raised above or others are possible areas for future research. For example, the design feature that RPS, in contrast to most other programs of this type, offers household-level educa-tion transfers as opposed to child-level trans-fers, provides the opportunity to explore the effect of varying the transfer per benefici-aryby comparing households with different numbers of school children. Indirectly, this would be an assessment of the effect of
DESIGN OF THE EVALUATION, METHODOLOGY, AND VALIDITY 15
17There is a recent increase in non-experimental approaches to evaluation, in particular using propensity score
matching. The evidence is mixed, however, as to whether or not these provide a convincing alternative to exper-imental approaches (Heckman, Lalonde, and Smith 1999; Michalopolous, Bloom, and Hill 2004).
18Furthermore, because by design some members of society remain without the intervention, such evaluations can
only measure partial equilibrium effects of the program, which may be different from the general equilibrium ef-fects, for example, if the program were national (Heckman, Lochner, and Taber 1998).
varying the transfer size. Similarly, the dif-ferent starting dates for the education and health components of the program (described below) could be exploited to investigate the relative importance of each of them.19
Finally, using variation in availability or quality of schooling could provide an op-portunity to separate demand- and supply-side effects on improvements in schooling (Coady and Parker 2004).
Even a well-implemented randomized design, however, is not without potential weaknesses. Heckman and Smith (1995) highlight that the apparent simplicity can be deceiving, particularly in poorly designed evaluations where contamination occurs as a result of (1) randomization bias, where the process of randomization itself leads to a different beneficiary pool than would other-wise have been treated; (2) anticipation ef-fects, where control group behavior changes as the result of changes in expectations; or (3) substitution bias, where nonbeneficiaries obtain similar treatments from different sources. There is little reason to believe that the first consideration (randomization bias) is a concern in the RPS evaluation; for ex-ample, there was no evidence that house-holds moved in part or in whole to obtain the program (Adato and Roopnaraine 2004). The fourth section of this chapter addresses the possibility of contamination of the control group suggested by the other two concerns.
Another limitation with randomized eval-uations, or nearly any other evaluation for that matter, is that the results pertain specif-ically to the study population—extrapolating them to other populations requires addi-tional assumptions that may not be easy to verify (Burtless 1995). This is typically re-ferred to as the external validity problem. In the case of RPS, the purposive selection of program areas may have affected program performance; the generalizability of the re-sults is therefore less certain. As described
earlier, the selection of municipalities was conditioned on the likelihood of success, so that the observed outcomes might exagger-ate the likely outcomes from program ex-pansion to other areas with, for example, weaker institutional capacity to implement the program. On the other hand, the ob-served outcomes may understate the likely outcomes if there was less need for RPS in these areas becauseof greater institutional capacity.
While it is not possible to claim that the 42 selected comarcasare representative of rural Nicaragua, there is evidence that they are similar in many key respects to a large number of other rural communities in the Central Region and in the country more broadly. First, using the marginality index scores based on the 1975 census (Arcia 1999), we estimate that three quarters of the approximately 150 rural comarcasin the departments of Madriz and Matagalpa have priority 1 or 2, as do three quarters of the approximately 1,000 rural comarcasin the country as a whole. If instead we consider levels of extreme poverty, there are more than 350 comarcasin the country with ex-treme poverty at or above 42 percent, the average level in the pilot areas. On these broad indicators used for geographical tar-geting, then, there are a large number of similar comarcas, indicating those chosen for the pilot were not atypical.
A final problem to bear in mind when interpreting the results in this analysis is that the program was in its pilot phase, and out-comes (and therefore estimated effects) for the pilot may differ from outcomes for an expanded or longer-running program. Like most pilots, RPS underwent an initial learn-ing period (with attendant setbacks) and undertook a variety of activities that might not need repeating in an expansion (e.g., designing the MIS and preparing training materials for beneficiaries, promotoras,and health-care providers). Some of these
ities could have reduced the program’s effectiveness during the pilot (Caldés and Maluccio 2005). Moreover, as with any new program, there was the potential for ob-served behavioral changes to result, in part, from the novelty of the program or the evaluation—the Hawthorne effect (Krueger 1999). There are some patterns consistent with this phenomenon when we compare the effects after 1 year (2000–01) with those after 2 years (2000–02). Estimated effects on several outcome indicators were slightly lower in 2002 than in 2001, and not always entirely attributable to improvements in the control group. Unfortunately, we cannot directly test how much of this might be due to a Hawthorne effect, changes in the effec-tiveness of program implementation, or the slight decline in the real value of transfers. Finally, expansion of the program could in-troduce new advantages and disadvantages associated with scaling up and economies of scale. All these factors call for a degree of caution in forecasting what would happen were the program to be extended to other municipalities in Nicaragua.
Data Collection
The data collected for the evaluation were an annual household panel data survey im-plemented in both intervention and control areas of RPS before the start of the program, in 2000, and after the program began opera-tions, in 2001 and 2002.20A comprehensive
household questionnaire based on the 1998 Nicaraguan Living Standards Measurement Survey (LSMS) was used (World Bank 2001). The LSMS questionnaire was ex-panded in some areas (e.g., child health and education) to ensure that all the program indicators were captured, but cut in other
areas (e.g., income from labor and other sources) to minimize respondent burden and ensure collection of high-quality data in a single interview.21An anthropometric
mod-ule for children younger than age 5 was im-plemented in 200022and 2002, although not
in 2001. In this module, height (or length), weight, and hemoglobin (using portable Hemocue machines) were measured, follow-ing standard international procedures.
The household survey sample is a strat-ified (at the comarcalevel) random sample of all 42 comarcas described above and using the RPS population census collected in May 2000 as the sample frame. The areas represented comprise a relatively poor part of the rural Central Region in Nicaragua, but the sample is not statistically representa-tive of the six municipalities or other areas of Nicaragua, for that matter. Forty-two households were randomly selected in each of the 42 comarcas,yielding an initial target sample of 1,764 households. The sample size calculation was based on assessing the nec-essary sample sizes for the indicators listed in Appendix C. Assuming a random sample, a significance level of 5 percent, and a power of 80 percent, the indicator that re-quired the largest sample size was enroll-ment for grades 1–4. To detect a minimum, statistically significant difference of 8 per-centage points between intervention and con-trol groups, a sample size of 549 students for each group was required. Of course, not all households had children in this age range. According to the 2000 RPS popula-tion census, 63 percent of households had at least one child between 6 and 12 years of age. Therefore, to obtain a sample of 549 children (in different households) it was nec-essary to interview 871 households in each group (549/0.63), or 1,742 in total. Thus,
DESIGN OF THE EVALUATION, METHODOLOGY, AND VALIDITY 17
20Results reported on here are based on the April 2005 release of the Nicaraguan RPS evaluation data, available
from IFPRI.
21LSMS surveys are typically implemented in two visits to the household (Grosh and Glewwe 2000).
22About one-half of the 2000 anthropometry survey had to be completed in early October, one month after the