Development of Multirate Filter - based
Region Features for Iris Identification
Soubhagya Sankar Barpanda
Department of Computer Science and Engineering
National Institute of Technology Rourkela
Development of Multirate Filter - based
Region Features for Iris Identification
Thesis submitted in partial fulfillment of the requirements for the degree of
Doctor of Philosophy
in
Computer Science and Engineering
by
Soubhagya Sankar Barpanda
(Roll: 512CS605)under the guidance of
Dr. Banshidhar Majhi
&
Dr. Pankaj Kumar Sa
Department of Computer Science and Engineering
National Institute of Technology Rourkela
Rourkela-769 008, Odisha, India
January 2016Department of Computer Science and Engineering
National Institute of Technology Rourkela
Rourkela-769 008, Odisha, India.
January 25, 2016
Certificate
This is to certify that the work in the thesis entitled Development of Multirate Filter - based Region Features for Iris Identificationsubmitted bySoubhagya Sankar Barpanda, bearing roll number 512CS605, is a record of an original research work carried out by him under our supervision and guidance in partial fulfillment of the requirements for the award of the degree ofDoctor of PhilosophyinComputer Science and Engineering. Neither this thesis nor any part of it has been submitted for any degree or academic award elsewhere.
Pankaj Kumar Sa Banshidhar Majhi
Acknowledgment
If God brings you to it, he will bring you through it. . .
Thank you God for showing me the path.
I take this opportunity to thank all those who have contributed in this journey. Foremost, I would like to express sincere gratitude to my advisor, Prof. Banshidhar Majhi for providing motivation, enthusiasm, and critical atmosphere at the workplace. His profound insights and attention to details have been true inspirations to my research. Prof. Majhi has taught me to handle difficult situations with confidence and courage.
I would like to thank Prof. Pankaj Kumar Sa for his constructive criticism during the entire span of research. His insightful discussions have helped me a lot in improving this work.
My sincere thanks to Prof. S.K. Jena, Prof. S.K. Rath, Prof. B.K. Patra, Prof. A.K. Turuk, Prof. G.K. Panda, Prof. S. Meher, and Prof. K.B. Mohanty for their continuous encouragement and valuable advice.
I would like to thank my friends and colleagues at NIT Rourkela for the help they have offered during the entire period of my stay.
Abstract
The emergence of biometric system is seen as the next-generation technological solution in strengthening the social and national security. The evolution of biometrics has shifted the paradigm of authentication from classical token and knowledge-based systems to physiological and behavioral trait based systems. R & D on iris biometrics, in last one decade, has established it as one of the most promising traits. Even though, iris biometric takes high resolution near-infrared (NIR) images as input, its authentication accuracy is very commendable. Its performance is often influenced by the presence of noise, database size, and feature representation. This thesis focuses on the use of multi resolution analysis (MRA) in developing suitable features for non-ideal iris images.
Our investigation starts with the iris feature extraction technique using Cohen −
Daubechies−Feauveau 9/7 (CDF 9/7) filter bank. In this work, a technique has been proposed to deal with issues like segmentation failure and occlusion. The experimental studies deal with the superiority of CDF 9/7 filter bank over the frequency based techniques. Since there is scope for improving the frequency selectivity of CDF 9/7 filter bank, a tunable filter bank is proposed to extract region based features from non-cooperative iris images. The proposed method is based on half band polynomial of 14th order. Since, regularity and frequency selectivity are in inverse relationship with
each other, filter coefficients are derived by not imposing maximum number of zeros. Also, the half band polynomial is presented in x-domain, so as to apply semidefinite programming, which results in optimization of coefficients of analysis/synthesis filter. The next contribution in this thesis deals with the development of another powerful MRA known as triplet half band filter bank (THFB). The advantage of THFB is the flexibility in choosing the frequency response that allows one to overcome the magnitude constraints. The proposed filter bank has improved frequency selectivity along with other desired properties, which is then used for iris feature extraction. The last contribution of the thesis describes a wavelet cepstral feature derived from CDF 9/7 filter bank to characterize iris texture. Wavelet cepstrum feature helps in reducing
the dimensionality of the detail coefficients; hence, a compact feature presentation is possible with improved accuracy against CDF 9/7.
The efficacy of the features suggested are validated for iris recognition on three publicly available databases namely, CASIAv3, UBIRISv1, and IITD. The features are compared with other transform domain features like FFT, Gabor filter and a comprehensive evaluation is done for all suggested features as well. It has been observed that the suggested features show superior performance with respect to accuracy. Among all suggested features, THFB has shown best performance.
Contents
Certificate iii
Acknowledgement v
Abstract vi
List of Figures xi
List of Tables xiii
List of Acronyms xiv
1 Introduction 1
1.1 Anatomy of Iris Image . . . 5
1.2 Automated Iris Biometric System . . . 9
1.3 Fusion in Biometrics . . . 11
1.4 Iris Biometric Databases . . . 13
1.5 Performance Measures . . . 17
1.5.1 Recognition Performance . . . 17
1.5.2 Identification Performance . . . 18
1.6 Wavelet: A Suitable Candidate for Texture Analysis . . . 19
1.7 Research Challenges . . . 22
1.8 Research Objectives . . . 22
1.9 Thesis Organization . . . 23
2 Literature Review 25 2.1 Global Features . . . 26
2.3 Local Features . . . 31
2.4 Observations . . . 37
3 CDF 9/7 for Iris Feature Extraction 39 3.1 Related Work On Biorthogonal Filter Bank . . . 40
3.2 Iris Texture Analysis with CDF 9/7 FB . . . 42
3.2.1 Advantage of CDF 9/7 Filter Bank over FFT . . . 44
3.2.2 Feature Extraction using CDF 9/7 . . . 45
3.3 Results and Discussion . . . 48
3.3.1 Analysis of Results . . . 53
3.4 Summary . . . 53
4 Tunable Filter Bank for Iris Feature Extraction 54 4.1 Design Issues in Multirate Filters . . . 55
4.2 Proposed Tunable Filter Bank . . . 56
4.2.1 Iris Feature Extraction using Tunable Filter Bank . . . 62
4.3 Results and Discussion . . . 65
4.4 Summary . . . 69
5 Iris Feature Extraction Using THFB 70 5.1 Related Work on THFB . . . 71
5.2 Proposed Filter Bank . . . 72
5.2.1 Iris Feature Extraction using THFB . . . 75
5.3 Results and Discussion . . . 78
5.3.1 Advantage of the Proposed Approach . . . 83
5.4 Summary . . . 84
6 WCF for Iris Recognition 85 6.1 Proposed WCF for Iris Recognition . . . 87
6.2 Results and Discussion . . . 89
6.2.1 Advantage of Wavelet Cepstrum Feature . . . 93
7 Conclusions 94
Bibliography 97
Dissemination 112
List of Figures
1.1 Illustration of the front pigmented fibrovascular tissue from eye images. 5
1.2 Different modes of operation of a generic biometric system. . . 7
1.3 Different modules of an automated iris recognition system. . . 10
1.4 Different modes of operation of a generic biometric system. . . 11
1.5 Categorisation of fusion approaches depending upon the nature of evidence. . . 13
1.6 Various levels of fusion in multimodal biometric. . . 14
1.7 A hypothetical curve demonstrating the performance measures. . . . 18
1.8 Two level decomposition using DWT (a) original image (b) First level decomposition (c) Second level decomposition . . . 21
2.1 Categorization of literature explored in iris biometrics into three domains. 26 2.2 Contributions of this thesis. . . 37
3.1 Generalized block diagram of iris-recognition system . . . 40
3.2 Block diagram of two band filter bank . . . 43
3.3 Normalized iris image divided into six equal regions . . . 46
3.4 Iris localization with IDO . . . 46
3.5 Iris localization failure with IDO . . . 47
3.6 Two level decomposition using wavelet . . . 48
3.7 Block diagram showing proposed approach for iris recognition system 49 3.8 Performance of CDF 9/7 filter bank technique on CASIAv3, UBIRISv1, and IITD databases . . . 51
3.9 CMC curves on CDF 9/7 filter bank feature on CASIAv3, IITD, and
UBIRISv1 databases . . . 52
4.1 Performance of tunable filter bank technique on CASIAv3, UBIRISv1, and IITD databases . . . 67
4.2 CMC curves on tunable filter bank feature for IITD, UBIRISv1, and CASIAv3 databases . . . 68
5.1 Analysis filters of THFB . . . 72
5.2 Proposed approach . . . 76
5.3 Iris segmentation failure with IDO . . . 77
5.4 Performance of THFB on CASIAv3, UBIRISv1, and IITD databases 81 5.5 CMC curves on THFB based features for CASIAv3, UBIRISv1, and IITD databases . . . 82
6.1 Performance of wavelet cepstrum on CASIAv3, UBIRISv1, and IITD databases . . . 91
6.2 CMC curve on wavelet cepstrum for CASIAv3, UBIRISv1, and IITD databases . . . 92
List of Tables
1.1 Comparison of different biometric modalities based on their characteristics. . . 6 1.2 Detail of some existing iris databases . . . 16 2.1 Recognition through iris biometric . . . 34 3.1 Comparative analysis of proposed feature on different databases . . . 50 4.1 Co-efficient vectora of z-domain . . . 62 4.2 Co-efficient vectorb of x-domain . . . 62 4.3 Comparative analysis of proposed feature on different databases . . . 66 5.1 Comparative analysis of proposed feature on different databases . . . 80 6.1 Computational cost of different iris recognition algorithms (with
respect to time) . . . 89 6.2 Comparative analysis of proposed feature on different databases . . . 90
List of Acronyms
CDF 9/7 Cohen-Daubechies-Feauveau 9/7, page 22 CMC Cumulative Match Characteristic, page 18 DCT Discrete Cosine Transform, page 39 DFT Discrete Fourier Transform, page 85 DWF discrete wavelet frame, page 32 DWT Discrete Wavelet Transform, page 20 FAR False Acceptance Rate, page 17
FIR Finite-duration Impulse Response, page 70 FMR False Match Rate, page 17
FNMR False Non Match Rate, page 17 FRR False Rejection Rate, page 17 GAR Genuine Acceptance Rate, page 17
MFCC Mel-Frequency Cepstrum Coefficients, page 87 MLDF Multilobe Differential Filters, page 28
POC Phase-Only Correlation, page 32
ROC Receiver Operating Characteristic, page 17 SDP Semidefinite Programming, page 56
SIFT Scale Invariant Feature Transform, page 31 SURF Speeded Up Robust Features, page 32 THFB Triplet Half Band Filter Bank, page 70 UAE United Arab Emirates, page 4
Chapter 1
Introduction
Person identification has become an integral part of our everyday acivities. Considering the incessant threats, automation of person identification is unequivocally indispensable [1]. Mechanism liketoken based system (e.g. passport, smart card) and
knowledge based system (e.g. secret code, password) are existing for quite long time. These systems have the disadvantage of physical possession of the token or piece of information like password that is used to prove the authentication of an individual. Furthermore, these mechanisms are very prone to spoofing. On the contrary, biometric traits have the unique advantage of being held physically by the user, making it near impossible to spoof [2].
Biometrics is an automated method of authenticating an individual based on physiological and behavioral characteristics. The characteristics are distinct and can distinguish between a genuine person and an imposter. The physical presence of the subject makes it very difficult to spoof the biometric system. The authentication is performed using various biometric traits like face, fingerprint, iris, ear, etc. The choice of a biological measurement to qualify as a biometric trait is based on the following properties:
• Distinctiveness or uniqueness: A biometric modality must have features that allow high levels of discrimination in selecting any particular individual while rejecting everyone else. The larger the number of people to be distinguished, the more important this factor becomes.
Introduction
• Stability: There is a likelihood of changes in a biometric modality over a period of time due to age, accident, or disease. However, a biometric should preserve enough features so that these changes will have a minimal effect on the system’s ability to discriminate. Stability may be of less significance where re-enrolment can be simply or easily achieved, or where re-issue over shorter duration is legally required.
• Scalability: A biometric should be capable of being processed efficiently, both at acquisition time and when it is searched in a database for identification-based access. Scalability issues may be less of a concern for verification-based access control systems than for large identification systems.
• Usability: A major selling feature in the adoption of biometrics is its convenience. If a biometric is difficult or slow to use, it probably won’t be adopted. There is also a question of acceptance of the trait by some social/religious sect.
• Inclusiveness: An extremely high proportion of the population should be measurable, particularly for large-scale identity systems. A biometric which excludes some users causes additional complexities in managing security. A secondary authentication system is needed if a fraction of the population does not bear the biometric trait.
• Insensitivity: Changes in the external environment e.g., lighting, temperature etc. within reasonable boundaries should not cause system failures due to malfunction of the trait.
• Vulnerability: It should be difficult to create a fake prosthetic biometric (known as spoofing), or to steal and use a detached one.
• Privacy: Ideally the permission of the owner of a biometric should need to be sought before acquisition of the trait. A trait should not be easily captured without a person’s notice/permission.
Introduction
Biometrics is evolving constantly, which has engendered a workable industry holding great promise for the future. This curiosity has attracted many organizations to explore the implementation of complete biometric systems. Different biometric traits have been studied by the scientific community for real time deployment of the technology. The most successfully used automated biometric identifiers include fingerprint, face, palmprint, iris, and signature. Fingerprint identification is one of the most well-established and publicized biometrics. Because of their uniqueness fingerprints have been used for identification for over a century, more recently becoming automated due to advancements in computing capabilities. Fingerprint identification is popular because of the inherent ease in acquisition, the numerous sources (ten fingers) available for collection, and their established use and collections by law enforcement and immigration. There was immense interest from the Federal Bureau of Investigation (FBI) to develop a system to automate its fingerprint identification process, which had quickly become overwhelming and required many man-hours for the manual process. The con of fingerprint biometric is that it is exposed to outside environment; hence susceptible to change in its pattern. Moreover, for children the pattern as well as the size of fingerprint changes very quickly.
Face is another popular biometric modality, which has found usage in current devices like smartphone, tablet, or personal computer to replace password. Human being use the face information as a primary means to recognize humans. Because of its natural appearance, face biometrics is acceptable in ideal situations. The conventional optical imaging devices are used to capture the face; hence data acquisition is economical. Despite of being a very strong biometric trait, the current technologies are not able to handle certain problems till now. There has been little progress in making face recognition invariant with respect to aging effect. Also image acquisition in different illuminations affect badly the accuracy of the recognition system.
Palmprint recognition inherently implements many of the same matching characteristics that have been adopted for fingerprint recognition. Hence it is known to be one of the most well-known and best publicized biometrics. Both palm and
Introduction
finger biometrics are represented by the information presented in a friction ridge impression. This information combines ridge flow, ridge characteristics, and ridge structure of the raised portion of the epidermis. The data represented by these friction ridge impressions allows a decision that corresponding areas of friction ridge impressions either originated from the same source or not. Because fingerprints and palms have both uniqueness, they have been used for over a century as a trusted form of identification. However, palm recognition has been slower in becoming automated due to some restraints in computing capabilities and live-scan technologies. Also it shares the same cons of fingerprint trait.
The comparison of various biometric traits based on different characteristics is shown in Table 1.1. In contrast to other biometric traits, iris is an established biometric modality [3] due to its high universality, uniqueness, stability over time, performance, and ability to counteract spoof attacks (refer Table 1.1). An iris recognition system operates by mathematical analysis of texture patterns that are imaged at certain distance from the eye [4]. Recently, iris biometric has evolved as a mainstream field of biometric applications adverting to its performance. Such systems are deployed at United Arab Emirates (UAE) linking 27 air, land, and sea-ports of entry [1]. In India, a large-scale project Aadhaar [5] is undertaken to issue unique identification number to everyone across the country using fingerprint, face, and iris. Though in sufficiently matured stage, iris still needs considerable attention by the researchers. The transition of iris from laboratory technology to real time deployment has highlighted some interesting research challenges. For instance, exhaustively searching country-sized iris database, recognition under scenarios when iris data is either noisy or unavailable, and effect of aging on iris [6]. In this thesis, an effort has been made to re-investigate the performance of iris biometric under the aforesaid real-time challenges and identify the measures to mitigate the shortcomings, if any.
Before exploring research issues in iris, it is recommended to consider its anatomical structure in detail. Iris is a thin circular disk in the eye with dark circular
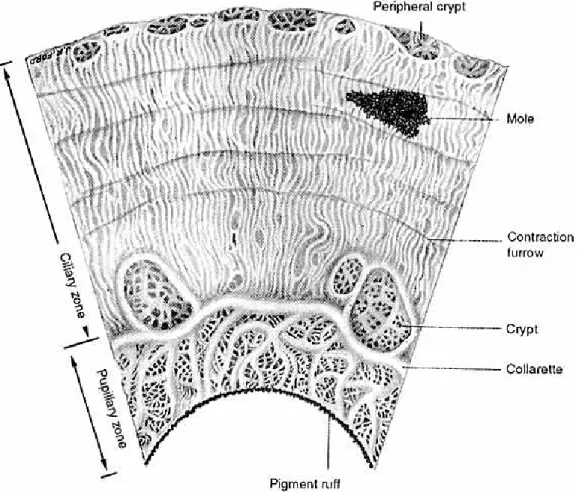
1.1 Anatomy of Iris Image Introduction
opening in the center known as the pupil as shown in Figure 1.1. The texture pattern in iris comprises two tissues: the front pigmented fibrovascular tissue is known as a stroma and, beneath the stroma, pigmented epithelial cells. The stroma is connected to a sphincter muscle, which constricts the pupil in a circular motion, and a set of dilator muscles, which pulls the iris radially to enlarge the pupil [7]. The constriction and dilation of pupil control the amount of light entering the eye. The flowery pattern surrounding the pupil, commonly referred as iris, is unique and used for personnel identification.
Figure 1.1: Illustration of the front pigmented fibrovascular tissue known as a stroma from high quality eye images [8].
1.1
Anatomy of Iris Image
A detail study is required to understand the texture rich pattern of the iris for recognition. The iris is composed of several layers. Heavily pigmented epithelial cells constitute the posterior surface [9]. These cells make it impenetrable by light. There are two cooperative muscles for controlling the pupil, that constitute the anterior surface. Next is the stromal layer, which consists of collagenous connective tissue in arch-like style. There are radially arranged corkscrew like blood vessels coursing through this layer. The most anterior layer is more densely packed, especially with individual pigment cells (called chromataphores). The visual appearance of the iris is due to its multilayered structure. The anterior surface of the iris is found to be divided
1.1 Anatomy of Iris Image Introduction
Table 1.1: Comparison of different biometric modalities based on their characteristics (H: High, M: Medium, and L: Low) [1].
M o d al it y U n iv er sa li ty U n iq u en es s P er m an en ce C ol le ct ab il it y P er fo rm an ce A cc ep ta b il it y C ir cu m ve n ti on Face H L M H L H L Fingerprint M H H M H M H Hand Geometry M M M H M M M Keystrokes - - L M L M M Hand Vein M M M M M M H Iris H H H M H L H Retinal Scan H H M L H L H Signature L L L H L H L Voice Print M L L M L H L F. Thermogram H H L H M H H Odor H H H L L M L DNA H H H L H L L Gait M L L H L H M Ear M M H M M H H
into two parts: a central pupillary zone and a surrounding cilliary zone. The border of these two areas is termed the collarette. It has a zigzag circumferential ridge like structure resulting as the anterior border layer, which ends near the pupil. The cilliary zone contains many interlacing ridges resulting from stromal support. Contractile lines here can vary with the state of the pupil. Additional meridional striations result from the radiating vasculature. Other assorted variations in appearance owe to crypts (irregular atrophy of the border layer), nevi (small elevations of the border layer), and freckles (local collections of chromataphores). In contrast, the pupillary zone can be relatively flat; it often shows radiating spoke-like processes and a pigment frill where the posterior layers heavily pigmented tissue shows at the pupil boundary. The iris color results from the differential absorption of light impinging on the pigmented cells in the anterior border layer.
1.1 Anatomy of Iris Image Introduction
1.1 Anatomy of Iris Image Introduction
from the posterior epithelium and is scattered as it passes through the stroma to yield a blue appearance. Progressive levels of anterior pigmentation lead to darker colored iris. Claims that the structure of the iris is unique to an individual and is stable with age come from two main sources. The first source of evidence is clinical observations. During the course of examining large numbers of eyes, ophthalmologists and anatomists have noted that the detailed pattern of an iris, even the left and right iris of a single person, seems to be highly distinctive. Further, in cases with repeated observations, the patterns seem to vary little, at least past childhood. The second source of evidence is developmental biology. There, one finds that while the general structure of the iris is genetically determined, the particulars of its minutiae are critically dependent on circumstances (e.g., the initial conditions in the embryonic precursor to the iris). Therefore, they are highly unlikely to be replicated via the natural course of events. Rarely, the developmental process goes awry, yielding only a rudimentary iris (aniridia) or a marked displacement (corectopia) or shape distortion (colobloma) of the pupil.
Developmental evidence also bears on issues of stability with age. Certain parts of the iris (e.g., the vasculature) are largely in place at birth, whereas others (e.g., the musculature) mature around two years of age. Of particular significance for the purposes of recognition is the fact that pigmentation patterning continues until adolescence. Also, the average pupil size (for an individual) increases slightly until adolescence [1]. Following adolescence, the healthy iris varies little for the rest of a persons life, although slight depigmentation and shrinking of the average pupillary opening are standard with advanced age. Various diseases of the eye can drastically alter the appearance of the iris. It also appears that intensive exposure to certain environmental contaminants (e.g., metals) can alter iris pigmentation. However, these conditions are rare. Claims that the iris changes with more general states of health (iridology) have been discredited. On the whole, these lines of evidence suggest that the iris is highly distinctive and, following childhood, typically stable. Nevertheless, it is important to note that large-scale studies that specifically address
1.2 Automated Iris Biometric System Introduction
the distinctiveness and stability of the iris, especially as a biometric, have yet to be performed.
1.2
Automated Iris Biometric System
An iris biometric system is typically a pattern recognition system that acquires the iris image of an individual, extracts features (represented in the form of a template), and compares this feature set against the feature set(s) stored in the database. The input biometric template (commonly referred to as gallery template) is stored in the database during enrollment. The template which is presented to the biometric system for claiming the identity is known as probe. A generic iris biometric system has four major modules:
a. Image acquisition modulerequires an iris biometric scanner to acquire images. The acquisition setup plays a crucial role on the performance of any biometric system. For instance, iris images acquired loosely (without any restriction on the user) may pose serious challenges.
b. Preprocessing moduleextracts the region of interest from the input iris image. Preprocessing is performed to localize the inner pupil and outer iris boundary. The annular ring between pupil and iris boundary are transformed from Cartesian space to polar space using homogeneous rubber sheet model [4]. This transformation generates the normalized iris image which facilitates the feature extraction process. c. Feature module extracts significant details from the normalized iris image using mathematical models. The extracted features should be unique and must achieve invariance to transformations between the gallery and probe iris images.
d. Matching module finds the correspondences between the two feature sets using an appropriate matcher. The matcher either validates the identity of an individual by performing one to one comparison or to generate a ranked list of identities
1.2 Automated Iris Biometric System Introduction
for one to many comparisons [1]. Figure 1.3 illustrates different modules of an automated iris biometric system.
Y Sensor and Preprocessing Module Feature Extraction Module
Database Module Matching Module score > threshold ? Score Generation Genuine Imposter Localization Enrolment Verification N 010001110101010111010 1010101111110101000010 1010000100000000101010
Figure 1.3: Different modules of an automated iris recognition system [10].
Depending upon the application context, a biometric system operates in verification (also known as recognition) or identification modes as shown in Figure 1.4. In verification mode, the system authenticates the identity claimed by an individual by comparing his template with an already stored template in the database. Identification mode, in contrast, finds the identity of the probe template by searching all gallery templates present in the database.
1.3 Fusion in Biometrics Introduction
Figure 1.4: Different modes of operation of a generic biometric system.
1.3
Fusion in Biometrics
Biometric system that requires single source of evidence to perform authentication is known as unimodal systems. However, a single biometric trait is not expected to meet all the requirements such as accuracy, cost, availability, etc. There are some challenges which in general, affects the performance of any biometric system:
• The acquired biometric image may change over time or may be affected by noise. For instance, facial features are subject to age over a period of time. Similarly, fingerprint effected by scar or voice effected by cold may pose vulnerabilities to a biometric system.
• The biometric data may be unavailable for a subset of population. The presence of cuts and bruises on the fingerprint brings down the system performance. Similarly, it is difficult to acquire iris images with some pathological problem in the eye.
1.3 Fusion in Biometrics Introduction
• Circumvention is easy with a single biometric trait. Some traits such as fingerprint can be spoofed by showing a fake fingerprint structure on a synthetic material.
Multimodal biometric fusion utilises more than one source of evidence for authentication. Fusion is very useful to overcome the limitations inherent to unimodal approaches. Depending upon the nature of evidence available, the fusion algorithm can be multi-sensor, multi-algorithm, multi-instance, multi-unit, and multi-modal as shown in Figure 1.5. The multi-sensor system utilises more than one sensor to capture single biometric trait of an individual. In multi-algorithm system, for a single biometric trait, multiple feature extraction algorithms or multiple matchers are combined. The multiple images of the same biometric trait are acquired from a single biometric sensor in multi-instance systems. In multi-unit system, multiple units of the same modality are used to perform authentication. For instance, information from left and right iris or fingerprint images can be combined to improve the performance. The multi-unit fusion approaches improve the recognition accuracy without incurring any additional hardware cost. The combination of more than one biometric trait generates a multi-modal system. For example, combining iris with the face improves the performance of “on the move” type of recognition systems.
Based on the level of fusion, the approaches can be further categorised into sensor level, feature level, match score level, and decision level as shown in Figure 1.6. In
sensor level fusion, the raw biometric data from multiple sensors (multi-sensor) or multiple instances of a biometric from the same sensor (multi-instance) are fused.
Feature level fusion involves integrating more than one feature set from different biometric algorithms (multi-algorithm) into a single feature set. Inmatch score level fusion, the match scores generated from multiple biometric matchers are combined to generate a consolidated score value. In decision level fusion, the final recognition decisions are combined to develop a multimodal biometric system.
1.4 Iris Biometric Databases Introduction Sensor 1 Sensor 2 Iris 2 FU Multi-sensor Multi-algorithm Iris 1 Multi-instance Instance 2 Instance 1 FU Algorithm 1 Algorithm 2 FU Iris Left Iris Right Iris FU Multi-unit Multi-modal Face Iris FU
Fusion
FU Fusion UnitFigure 1.5: Categorisation of fusion approaches depending upon the nature of evidence.
1.4
Iris Biometric Databases
Use of common databases give proper platform to compare two or more methods devised by separate research groups. This section presents the iris biometric databases that are existing and widely used by researchers to validate their respective approaches. Performance of iris recognition systems in unconstrained environments is still a challenging task, which require special attention. Extraction of iris region, occlusion segmentation, large scale detection, and many other issues need further investigation. All these above said issues can be addressed if investigated on carefully designed databases.
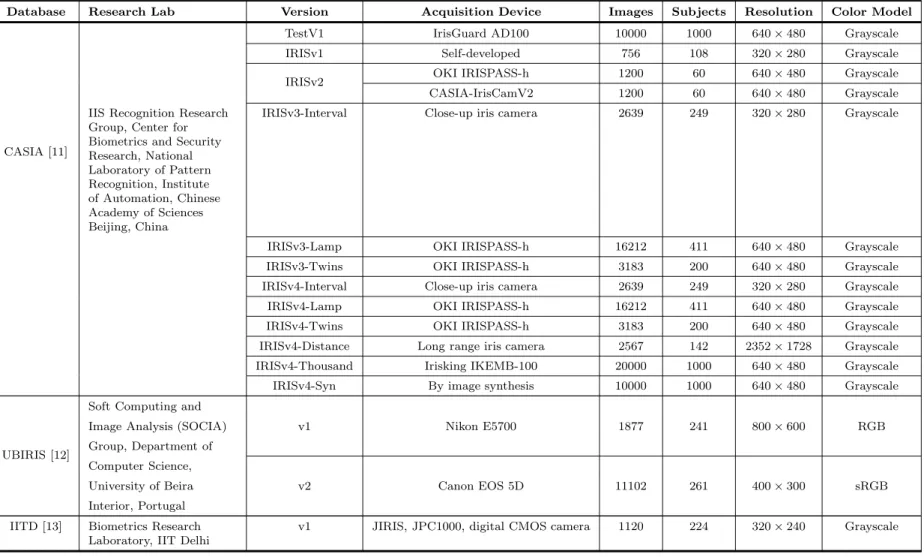
Table 1.2 presents the most widely used iris databases that are released for iris research. CASIA, UBIRIS, and IITD are such databases. CASIA IRISv3-Interval (hereafter called CASIAv3 throughout the thesis) database, formed and released by
1.4 Iris Biometric Databases Introduction Sensor 1 Sensor 2 Input Image 1 Input Image 2 FM FM MM MM DM DM FU Fusion Unit
FM Feature Extraction Module MM Matching Module
DM Decision Module FU MM DM FM Sensor Level A/R FU MM DM Feature Level A/R FU DM Score Level A/R FU Decision Level A/R
A/R Decision: Accept/Reject
Figure 1.6: Various levels of fusion in multimodal biometric.
Chinese Academy of Sciences, China. It contains images from 249 subjects and each image is having resolution 320×280. A self-developed close-up iris camera is used to capture the iris images. CASIAv3 dataset contains illumination variance and noises due to specular highlights. The designed camera has circular NIR LED array with suitable luminous flux for iris imaging. Due the designed camera, very clear images are captured and well-suited to study the detailed texture features of iris images.
UBIRISv1 database is consists of 1877 images collected from 241 subjects in two distinct sessions. The main characteristic of this database is to incorporate images with several noise factors, simulating less constrained image acquisition environments. This enables the evaluation of the robustness of iris recognition methods. For the first image capture session, noise factors are minimized, specially those relative to reflections, luminosity and contrast, having installed image capture framework inside a dark room. In the second session, the image acquisition place is changed in order to introduce natural luminosity factor. This includes the appearance of heterogeneous images with respect to reflections, contrast, luminosity and focus problems. Images
1.4 Iris Biometric Databases Introduction
collected at this stage simulate the ones captured by a vision system without or with minimal active participation from the subjects, adding several noise problems. These images will be on the recognition stage compared to the ones collected during first session.
The IIT Delhi Iris Database mainly consists of the iris images collected from the students and staff at IIT Delhi, New Delhi, India. This database has been acquired in Biometrics Research Laboratory during Jan - July 2007 using JIRIS, JPC1000, digital CMOS camera. The image acquisition program was written to acquire and save these images in bitmap format and is also freely available on request. The currently available database is from 224 users, all the images are in bitmap format. All the subjects in the database are in the age group 14 - 55 years comprising of 176 males and 48 females. The database of 1120 images is organized into 224 different folders each associated with the integer identification/number. The resolution of these images is 320×240 pixels and all these images were acquired in the indoor environment.
1 .4 Ir is B io m et ri c D a ta ba se s In tr o d u ct io n
Table 1.2: Detail of some existing iris databases
Database Research Lab Version Acquisition Device Images Subjects Resolution Color Model
CASIA [11]
TestV1 IrisGuard AD100 10000 1000 640×480 Grayscale
IRISv1 Self-developed 756 108 320×280 Grayscale
IRISv2 OKI IRISPASS-h 1200 60 640×480 Grayscale
CASIA-IrisCamV2 1200 60 640×480 Grayscale
IIS Recognition Research Group, Center for Biometrics and Security Research, National Laboratory of Pattern Recognition, Institute of Automation, Chinese Academy of Sciences Beijing, China
IRISv3-Interval Close-up iris camera 2639 249 320×280 Grayscale
IRISv3-Lamp OKI IRISPASS-h 16212 411 640×480 Grayscale
IRISv3-Twins OKI IRISPASS-h 3183 200 640×480 Grayscale
IRISv4-Interval Close-up iris camera 2639 249 320×280 Grayscale
IRISv4-Lamp OKI IRISPASS-h 16212 411 640×480 Grayscale
IRISv4-Twins OKI IRISPASS-h 3183 200 640×480 Grayscale
IRISv4-Distance Long range iris camera 2567 142 2352×1728 Grayscale
IRISv4-Thousand Irisking IKEMB-100 20000 1000 640×480 Grayscale
IRISv4-Syn By image synthesis 10000 1000 640×480 Grayscale
UBIRIS [12]
Soft Computing and
Image Analysis (SOCIA) v1 Nikon E5700 1877 241 800×600 RGB
Group, Department of Computer Science,
University of Beira v2 Canon EOS 5D 11102 261 400×300 sRGB
Interior, Portugal
IITD [13] Biometrics Research
Laboratory, IIT Delhi
v1 JIRIS, JPC1000, digital CMOS camera 1120 224 320×240 Grayscale
1.5 Performance Measures Introduction
1.5
Performance Measures
Biometrics seldom compare two templates from the user who are exactly the same. There is the difference between two templates due to scanning conditions, change in characteristics with respect to aging, change in acquisition scenarios, etc. Therefore, feature sets originating from the same individual need not always be the same. When two different biometric templates originating from the same individual are different then it is known as intra-class variations. However, variations that occur between templates originating from two different individuals are known asinter-class variations [14]. Two biometric templates, when compared to find the intra-class variation, generates thegenuine scores. The two biometric templates when compared to find inter-class similarity generates imposter scores.
1.5.1
Recognition Performance
The error rate equations for system operating in recognition mode are discussed as follows:
• False Acceptance Rate (F AR) or False Match Rate (F MR) is defined as percentage of imposters incorrectly matched to the non-matching template.
• False Rejection Rate (F RR) or False Non Match Rate (F NMR) is the percentage of genuine people incorrectly rejected by the system.
• Equal Error Rate (EER) is the point where F AR equals F RR. In general, lower the equal error rate value, higher the accuracy of the biometric system.
• Genuine Acceptance Rate (GAR)is the percentage of genuine scores being correctly accepted and is defined as GAR = 1−F RR. A hypothetical score distribution curve is shown in Figure 1.7. This curve graphically demonstrates the performance measures used in recognition mode.
• Receiver Operating Characteristic(ROC) curve is a comprehensive way to analyze the performance of a biometric system. It depicts the dependence of
1.5 Performance Measures Introduction
F AR withGAR for change in the value of threshold. The curve can be plotted using linear, logarithmic or semi-logarithmic scale.
Figure 1.7: A hypothetical curve demonstrating the performance measures used during recognition.
1.5.2
Identification Performance
During identification, the gallery space is partitioned into bins for search time reduction. The error rate equations of systems operating in identification mode [14] can be defined using Cumulative Match Characteristic (CMC) Curve, which is defined below:
Cumulative Match Characteristic (CMC) Curve The rank-k identification indicates the number of correct identities that occur in top kmatches. Let Rk denote the number of elements of probe set in top k and N be the total number of images enrolled in the database, then the probability of identification is given by pi = Rk
N .
Cumulative Match Characteristic curve represents the probability of identification pi
1.6 Wavelet: A Suitable Candidate for Texture Analysis Introduction
1.6
Wavelet: A Suitable Candidate for Texture
Analysis
A close inspection of an iris image reveals its richness in texture. The texture information is higher at the collarette. Apart from that, it consists of random characteristics like radial furrows, concentric furrows, pigment dots, crypts etc. These attributes have different frequencies, which can be best described by a multiresolution analysis (MRA) technique. The discrete wavelet transform is an MRA technique, which can represent the iris image in different orientation and scaling.
Wavelet transform is a multiresolution technique, which has found successful applications in digital image processing. It is found to offer some advantages over classical block transform techniques such as the discrete cosine transform (DCT). It carries high importance with the problem of designing suitable multiresolution transforms that are adapted to the given image signal, in the sense that they maximize the coding gain at each resolution level. A simple alternating optimization algorithm is derived for solving this problem in the framework of the lattice realization of para-unitary quadrature mirror filters (QMF). The wavelet transform has the following advantages over its counter parts:
• The wavelet transform is a multiresolution description of an image: the decoding can be processed sequentially from a very low resolution, corresponding to a very compact code, to the highest resolution. Schemes based on the Laplacian pyramid also offer this advantage, but the wavelet transform allows furthermore perfect reconstruction.
• The wavelet transform is closer to the human visual system than the DCT transform. Hence, the artifacts introduced by wavelet transform coding with a high compression ratio and adequate perceptual quantization are less annoying than those introduced at the same bit rate by the DCT.
1.6 Wavelet: A Suitable Candidate for Texture Analysis Introduction
scale-space representation. In this representation, the high (spatial) frequency signals are precisely located in the pixel domain, while the low-frequency signals are precisely located in the frequency domain. Whereas the DCT has a spatial resolution that is independent of frequency, the spatial resolution of the wavelet transformation increases linearly with frequency. Therefore, sharp edges, which are well localized spatially and have a significant high-frequency content, can be represented more compactly with the wavelet transformation than with the DCT. On the other hand, the overall spectrum of most images is very much of a low-pass type. Now, while the frequency resolution is independent of frequency for the DCT, it is inversely proportional to frequency in the wavelet transformation. This allows the wavelet transformation to separate the dominating low frequency end of the spectrum into increasingly finer subbands. For strongly low-pass signals, the spectra of the subband signals provided by the wavelet transformation will be whiter in the subbands that contribute significantly to the signal power.
The key point of texture analysis is that extracted texture features must represent at the same time some local and some global characteristics of texture [15–17]. Psychovisual studies indicate that human visual system processes visual information in a multiscale way. It has been found that the responses of cells in visual cortex in the brain are similar to the Gabor functions. That is why Gabor filters have been so intensively studied in the context of texture analysis [18]. They offer multiscale and multiorientation processing of textural information. Wavelet filter bank is another multiscale approach to carry out the texture analysis [19, 20]. However, Gabor filters have disadvantages over wavelet filter bank:
• Gabor functions do not form an orthogonal basis set, which results in non-compact representation of feature; hence requires more memory during computation.
1.6 Wavelet: A Suitable Candidate for Texture Analysis Introduction
transformations.
• The time required for extracting feature is computationally quite high, which limits the retrieval speed.
Original image LL LH HH HL LL2 LH2 HL2 HH2 HH1 LH1 HL1 (a) (b) (c)
Figure 1.8: Two level decomposition using DWT (a) original image (b) First level decomposition (c) Second level decomposition
In linear phase discrete wavelet transform [21–28] (DWT) , the image is actually decomposed i.e., divided into four sub-bands and critically sub-sampled by applying DWT as shown in Fig. 1.8. These subbands labeled LH1, HL1 and HH1 represent the finest scale wavelet coefficients i.e., detail images while the sub-band LL1 corresponds to coarse level coefficients i.e., approximation image. To obtain the next coarse level of wavelet coefficients, the sub-band LL1 alone is further decomposed and critically sampled. This results in a two-level wavelet decomposition as shown in Fig. 1.8(b). Similarly, to obtain further decomposition, LL2 will be used. This process continues until some final scale is reached. The values or transformed coefficients in approximation and detail images (subband images) are the essential features, which are shown here as useful for texture analysis and discrimination. As micro-textures or macro-textures have non-uniform gray level variations, they are statistically characterized by the features in approximation and detail images. In other words, the values in the subband images or their combinations or the derived features from these bands uniquely characterize a texture. The features obtained from these wavelet transformed images are shown to be used for texture classification.
1.7 Research Challenges Introduction
1.7
Research Challenges
Despite of being an established biometric modality, there are open issues associated with iris recognition systems. These issues need to be addressed for making it user friendly and successful in real time implementation. Iris image acquisition is a cumbersome task, which must be done with utmost care. Otherwise, the extraction of region of interest is not done properly. Segmentation failure will lead to reduced accuracy. Feature extraction from such images lay big challenge, that must be done carefully. Wavelet filter banks and Gabor filters have been extensively used extracting features from iris images. Also wavelet filter bank is found to yield superior results than its counterparts. Hence, it is required to study the performance of various wavelet filter bank extensively in non-ideal situations.
1.8
Research Objectives
The aforementioned research challenges are addressed to improve the performance of the iris biometric system in practical scenarios. The research objectives are to:
1. Study the performance of a proven biorthogonal wavelet filter bank named CDF 9/7 [29] for feature extraction. Biorthogonal wavelet filter bank have been extensively used for texture analysis. Hence, a CDF 9/7 is chosen to extract energy feature from non-ideal iris images. The reason behind CDF 9/7 wavelet filter bank is its symmetric and energy preservation property. This is why it has been used in JPEG 2000 [30] standard compression scheme.
2. Improve the frequency selectivity of 9/7 biorthogonal filter bank. Frequency selectivity plays a vital role in feature extraction. It is known that B-Spline family wavelet filter bank can be presented by a half-band polynomial. Hence semidefinite programming technique can be used to optimize the wavelet parameters to increase performance of the recognition system.
1.9 Thesis Organization Introduction
filter bank. Since structured design helps in achieving good frequency response, it can help characterize iris texture properly.
4. Develop compact feature representation for iris recognition. It is highly desirable to store compact features in the gallery. It is known that cepstrum [31] components of an image give more weight to the high frequency block and helps in developing a robust feature. In order to achieve the goal, wavelet cepstrum based feature is studied.
1.9
Thesis Organization
This thesis starts with an introduction to biometrics including the research challenges and objectives. It is organized into seven chapters where each chapter portrays the contributions specific to a domain. The layout of this thesis is given below.
Chapter 2: Literature review
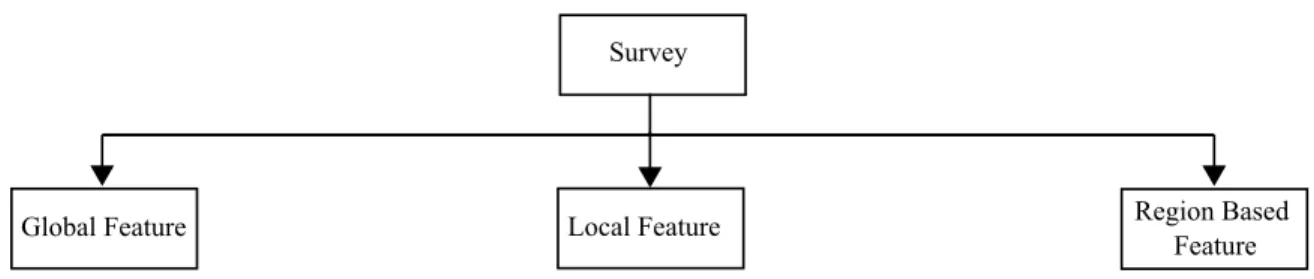
The existing literature is explored covering three major domains of iris feature extraction: (a) global feature, (b) local feature, and (c) region based feature representation. A tabular comparison of various approaches are presented along with the reported performance at the end.
Chapter 3: CDF 9/7 for iris feature extraction
This chapter deals with study of CDF 9/7 biorthogonal wavelet filter bank. The normalized images are preprocessed and then CDF 9/7 wavelet filter bank is applied to extract energy features. The performance of the same is then evaluated and compared with some of the contemporary methods.
Chapter 4: Tunable 9/7 filter bank for iris feature extraction
A tunable approach for developing 9/7 filter is studied. This method deals with representation of the half-band polynomial from z-domain to x-domain. The motivation behind this is to increase the frequency selectivity of the filter bank.
1.9 Thesis Organization Introduction
Then, semidefinite programming technique is used to optimize the low/high pass filter co-efficients. Then the energy feature is extracted from the normalized iris images.
Chapter 5: Iris feature extraction using THFB
In this chapter, triplet half-band filter bank is studied for energy feature extraction from normalized iris images. To characterize the iris texture, a 10th order half-band
polynomial is considered. This filter bank has superior frequency selectivity, time-frequency localization apart from other parameters.
Chapter 6: Wavelet cepstrum features for iris recognition
This chapter presents an experimental investigation of wavelet cepstrum based features. Cepstrum features are well investigated in speech recognition. With this motivation, wavelet cepstrum based method is used to extract energy feature from normalized iris images. The proposed technique is then compared with other techniques.
Chapter 7: Conclusions and future Work
This chapter presents the conclusions derived from the proposed methodologies with more emphasis on achievements and limitations. The scopes for future research are highlighted at the end.
Chapter 2
Literature Review
Iris is known to be one of the most popular biometric trait among all other modalities. Since the iris feature remains stable over a period of time, it is highly reliable. These properties have motivated many researchers to explore the feasibility of using iris as a standard biometric modality. Daugman has proposed the first operational iris recognition system in 1993 [4]. This landmark proposition has established iris as a potential biometric modality with many real-time applications [5]. However, it has many challenges to mitigate to be accepted in real-time applications. Since iris is rich in texture, it has to be characterized properly. It has many attributes, with varied frequency. Hence a multi-resolution analysis can help us achieve the goal. In this thesis, contributions are made to represent feature by studying the application of filter bank in iris biometrics. Basically, the iris features can be global, local, or region based. Since literature in each direction is independent of the other, the state-of-the-art approaches are explored for each category. The existing literature is described covering three major domains of feature extraction in iris biometrics as shown in Figure 2.1. In Section 2.1, global feature extraction for iris biometrics is given in brief. Different
region based feature extraction approaches are discussed in Section 2.2 followed by Section 2.3 that summarizes few well-known local feature extraction approaches for iris.
A careful study on automatic iris recognition reveals that numerous works have been reported since the early 2000. Basically, the features suggested so far are clarified
2.1 Global Features Literature Review
Global Feature Local Feature
Survey
Region Based Feature
Figure 2.1: Categorization of literature explored in iris biometrics into three domains.
into three different categories: global, local, and region based features. In this section, we have given the review of different features in sequel.
2.1
Global Features
In these schemes, the features are extracted without distinguishing an object from the background. This is particularly suitable under scenarios when the complete image describes the potential features that can be used for identification. Global features are widely considered for iris recognition.
Wildes [32] has developed a iris recognition system, which requires image acquisition in a very constraint environment. He has developed a technique to perform contour fitting in two steps.The first step deals with the conversion of image intensity information into binary edge-map. Second step employs a edge points voting scheme to instantiate particular contour parameter values. A gradient based edge detection is used to recover the edge-map that consists of thresholding the magnitude of the image intensity gradient i.e.
|5G(x, y)∗I(x, y)|, where 5 ≡(∂ ∂x, ∂ ∂y), whileG(x, y) = 2πσ12 e −(x−x0)2+(y−y0)2
2σ2 is a two-dimensional Gaussian with center (x0, y0)
and σ represents the standard deviation that smooths thespatial scale of edges under consideration. After extracting the annular region from the raw iris image, the texture is characterized with the pyramid of Laplacian constructed with four different resolution levels. Normalized correlation is then used for classification purpose.
2.1 Global Features Literature Review
the iris region. The same is implemented using wavelet decomposition and gradient method. Then, the popular rubber sheet method is used to normalize the segmented iris region. The iris texture is analyzed using first wavelet maxima components in horizontal and vertical directions using five scales to extract all dominant features. Then for each component special Gabor filter bank is applied with four scales and six orientations to obtain 240 filtered images. The feature vector is created in two different ways, i.e. statistical measure by considering mean and variance (480 feature elements) and moment invariant features (1680 feature elements).
Boles and Boashash [34] have proposed the application of 1-D wavelet transform to compute the zero-crossing representation at different resolution levels of a concentric circle on an iris image. To mitigate the effect of noise at finer levels few low-level resolutions are considered excluding the coarsest level. The disadvantage of this method is that, zero crossing is not a robust feature. It provides much less information along a virtual circle on the iris which affects the recognition accuracy. Lim et al. [35] have studied the application of Haar wavelet for feature extraction using normalized iris image. They have employed the bisection method to determine the center of pupilary boundary and then the radius increased gradually to segment the limbus boundary. Further the segmented iris region is converted from cartesian to polar form to obtain a 450×60 normalized image. They have decomposed the iris image by applying Haar wavelet up to four levels to get the 28×3 sub-images. Finally, feature vector is organized by combining 84 features in the HH sub-image of the high-pass filter of the fourth level decomposition and average value for the three remaining high-pass filter coefficients. The dimension of the resulting feature vector is 87. To reduce space and computational time for manipulating the feature vector, each real value is quantized into binary value by simply converting the positive value into 1 and the negative value into 0. They have experimented the performance of Haar wavelet and proved the superiority of Haar wavelet over Gabor transform. The limitation of this method is that, it looses middle frequency components of the iris, so may not perform well in noisy situations.
2.1 Global Features Literature Review
Ma et al. [36, 37] have developed a iris recognition system that consists of two phases. The first phase deals with assessment of quality of input image, and then selection of a clear iris image from such a sequence. The second phase deals with the application of spatial filters which can correctly characterize the iris texture to capture the local details of the iris so as to produce discriminating texture features. Then the classification is done by employing a nonparametric statistical approach to study the performance over a sizeable database. Costa and Gonzaga have extended the work of Ma et al. to selectively carry out the quality assessment from a sequence of video. Then from the acquired good quality frames, statistical features are extracted for recognition purpose. The recognition accuracy is very promising with average accuracy of 99.1%. Ma et al. [38] have proposed a three step method to preprocess raw iris image: (i)iris localization and removal of eyelid and eyelashes (ii) normalization of iris region (iii) contrast enhancement to mitigate the problem due to lighting condition. Then a set of 1-D intensity signals are constructed, which are capable of retaining the most sharp variations in the original iris image using wavelet transform. They have used a wavelet function, which is a quadratic spline of a finite support to extract features. Hamming distance is used for classification. The performance of their algorithm is near perfect on CASIA database.
Sun and Tan [39] have developed multilobe differential filters (MLDF) to compute ordinal measures. Ordinal measures help encode qualitative information of visual signal instead of quantitative values. An MLDF operator moves across the whole normalized iris image and each ordinal comparison is encoded as one bit (1 or 0 according to the sign of the filtering result). All of the binary iris codes constitute a composite feature of the input iris image, namely, ordinal code (OC). The dissimilarity between two iris images is determined by the Hamming distance of their features. In order to cope with the possible rotation difference between the two iris images, the input ordinal code is circularly rotated at different starting angles to match the template ordinal code. And the minimum Hamming distance of all matching results is the measure describing the dissimilarity between the two iris images. The
2.1 Global Features Literature Review
disadvantage of the proposed method is that ordinal measures computed from distant image regions lose the locality property and accuracy is affected by nonuniform illuminations.
Vatsa et al. [40] have proposed aSVM based approach to select locally enhanced regions from normalized iris images to extract global features using 1-D log polar Gabor transform, and local topological features using Euler numbers. These features are combined together to get good recognition accuracy. Dong et al. [41] have proposed a class-specific weight map based learning method to extract iris features. Velisavljevic [42] has proposed a method to extract iris features using the oriented separable wavelet transforms i.e. directionlets. The generated iris code is binary string having fixed length.
Sanchez-Avila and Sanchez-Reillo [43, 44] have discussed two approaches to iris biometric system. First one is based on Gabor filter and for classification Hamming distance is considered. Another approach deals with zero-crossing representation of two different iris representations. They have experimented with different classifiers like Euclidean distance and dZ. Another translation, scale, and rotation invariant approach is also proposed by the authors. The results obtained are very promising with classification accuracy up to 99.60% and equal error rate 0.12%. Chin et al. [45] have proposed S-Iris code for cancelable iris biometrics. They have used 1-D Log-Gabor filter to extract feature from normalized iris images. Then the feature vector is reduced to produce S-Iris code that provides higher accuracy and reduced complexity. Huang et al. [46] have proposed a rotation invariant iris feature extraction by applying non-separable wavelet and Gaussian Markov random fields (GMRF). The first phase consists of designing eight non-separable wavelet filters to provide information in eight different directions. To achieve rotation invariance to deal with head tilt and eye rotation, GMRF is used to characterize the filtered iris images. Hollingsworth et al. [47] have proposed to improve the overall accuracy of iris code by fusion of Hamming distance and fragile bit distance.
2.2 Region Based Features Literature Review
48–60].
2.2
Region Based Features
The most notable and commercially accepted work, is reported by Daugman [4], who has proposed 2-D Gabor filter to demodulate phase information of an iris image to create an iriscode for the authentication. The disadvantage of Daugman’s method is that, it is very time consuming. In another work, Ma et al. [37] have proposed a bank of spatial filters to extract iris features. They have considered two iris regions in the horizontal direction very close to the pupil from iris image after using quality descriptor for checking suitability for texture analysis. For extracting iris feature, they have proposed Gabor filter modulated with circularly symmetric sinusoidal function. Miyazawa et al. [61, 62] have incorporated a technique of “eyelid masking” to deal with irrelevant eyelid region, and considered only the lower half of the iris region to deal with occlusion. Then, 2-D Fourier Phase Code (FPC) is used for representing iris information. Matching is performed using phase only correlation. When two iris images are similar, their POC function gives a distinct sharp peak; otherwise the peak drops significantly. Monro and Rakshit [63, 64] have proposed patch based technique to extract FFT and DCT based features from normalized iris images. Their proposed algorithm is able to produce 100% correct accuracy rate in ideal condition.
Proenca and Alexandre [65] have proposed a method to deal with non-ideal iris feature extraction. The proposed technique deals with dividing the segmented and normalized iris image into six regions. Then 2-D Gabor filters are applied for independent feature extraction and comparison for each region. Rahulkar et al. [66–68] have proposed a region based technique for energy feature extraction using 2-D wavelet derived from a new class of biorthogonal wavelet filter bank.
2.3 Local Features Literature Review
2.3
Local Features
Local features are those patches of an image that differ from its neighborhood. They are extracted around special points or keypoints. The features extracted around each detected keypoint are stored as a descriptor. Keypoint descriptors are based on the appearance of an object at particular interest points and are invariant to image scale and rotation. They are also robust to changes in illumination, noise, and minor changes in viewpoint. Local features find correct correspondence between the gallery and probe images irrespective of large variations in transformation, occlusion, and illumination. These features have shown good performance for biometrics recognition. Below we discuss few notable works in local feature extraction from iris images:
Chenhong and Zhaoyang [69] have studied the application of automatic scale selection for local feature extraction from normalized iris images. Their proposed system first filters the given iris image by adopting a bank of Laplacian of Gaussian (LoG) filters with many different scales and computes the normalized response of every filter. The maxima of normalized response over scales for each point are selected together as the optimal filter outputs of the given iris image. The feature vector consists of location and scale information, which is then binary coded for iris feature representation.
SIFT (scale invariant feature transform) is a well known keypoint descriptor for object recognition [70]. SIFT is applied to regions of iris which does not require polar transformation. The idea is to develop a keypoint descriptor that is capable of performing well for iris textures. Mehrotra et al. [71, 72] proposed an iris recognition technique using interest point pairing. The feature set comprises spatial location of each corner point (detected using Harris) and entropy information of window around the corner. The corner points are paired using dual stage approach. At the first stage, the potential corners are obtained by finding Euclidean distance between spatial coordinates. These potential corners are used to find actual corners based on their affinity around a window, which is measured using Mutual Information (MI). The
2.3 Local Features Literature Review
authors in [73, 74] have developed an iris recognition system by applying Speeded Up Robust Features (SURF) directly on annular iris images. This system performs well for iris because of its capability to distinguish significant texture features from the background. Mehrotra et al. [75] have developed a technique to combine Fourier transform with SIFT. The Fourier based keypoint descriptors are paired using phase-only correlation (POC) . The combination of SIFT with Fourier for feature extraction and matching using phase-only correlation is found to perform better compared to SIFT. Noh [76] et al. have proposed a local feature based iris recognition using discrete wavelet frame (DWF) filter. For classification they have considered Hamming distance.
Du et al. [77] have proposed an iris recognition system by combining Gabor wavelet with SIFT to generate Gabor descriptor. Both phase and magnitude of Gabor wavelet values are used as features. The Gabor feature descriptor is invariant to scale, deformation, rotation, and contrast of two iris images. This approach performs well for frontal and off-angle iris images taken under non-cooperative scenarios. It is assumed that the rich texture pattern of iris undergoes non-linear deformation due to pupil contraction and dilation. Zhang et al. [78] proposed deformable DAISY matcher for robust iris feature matching. The dense DAISY descriptors are extracted from the normalised iris image for low computational cost. The set of keypoints are localised on the feature map to match using deformation tolerant matching strategy. Sun et al. [79] proposed a recognition system using bovine iris images captured from non-cooperative audiences. The pupil and iris circles are localised using active counters and features are extracted using SIFT. After removing keypoints from pupil region, the keypoint descriptor is generated using bag-of-features and then distance of histogram representations is adopted for matching. Local feature based approaches have shown to improve the iris recognition performance.
Yu et al. [80] have proposed a multi-channel Gabor filter based key point extraction technique and Euclidean distance as classifier for iris recognition. Bakshi et al. [10] have proposed a multi-scale local feature extraction technique for periocular
2.3 Local Features Literature Review
recognition. The proposed feature is capable of extracting high-dimensional subtle features existent in the iris region as well as low-dimensional gross features in the periphery skin region of the iris. The robustness of the developed feature is due to its ability to find coarse-to-fine features in multi-scale and different phases of the same.
2 .3 L oc a l F ea tu re s L it er at u re R ev ie w
Table 2.1: Recognition through iris biometric
Year Authors Feature extraction
algorithm
Feature matching
algorithm Testing database Performance results
1993
256 byte iris code comprising
most 592 images (480×640 8-bit) from
Daugman [4] significant bits from
multi-scale Hamming Distance 323 subjects captured in 3 years by EER : 1 in 131000
quadrature 2-D Gabor wavelet Opthalmology Associates of
Connecticut 1997
4 level multiscale 10 images for each of 60 iris
captured no false positive,
Wildes [32] Laplacian pyramid normalized correlation from 40 subjects [two sessions, and
inclusion of twin subjects] no false negative
1998
Boles and 1-D Zero Crossing 128×128 grayscale images captured
from
Accurate in case of noise free images,
Boashash Wavelet transform two dissimilarity functions single eye of each subject [different partially successful in classifying
[34] illumination and eye-to-camera
distance] noisy images
2001
87 bit feature vector 6000 iris images from 200
Lim et al. [35] using 2-D Haar Wavelet Learning Vector
Quantization subjects of same age group Accuracy 99.3%
captured in 3 months 2003
vector of length Fisher linear discriminant
+ Constructed CASIA
Ma et al. [37] 1,536 using Multichannel three distance measure + database for Accuracy 99.43%
spatial filters bootstrap learning method this experiment
2004 Daugman [3] 2048 bit phase vector Hamming Distance eye images from trials EER : 1 in 4 million
by 2-D Wavelet Demodulation in Britain, the USA, Japan, and
Korea 2004
1-D Key local variation Accuracy 100% with EER 0.07%
Ma et al. [38] using dyadic wavelet Hamming Distance CASIA [Feature extraction +
transform (quadratic-spline) Matching time 250.7ms]
2007
2,343 bit long product-of-sum 100% Correct Recognition Rate,
Monro et al. [64] iris feature code approach to CASIA, BATH worst case theoretical EER:
based on 1-D DCT Hamming Distance 2.59×10⁻⁴
Continued on next page . . .
2 .3 L oc a l F ea tu re s L it er at u re R ev ie w
Table 2.1: Continued from previous page . . .
Year Authors Feature extraction
algorithm
Feature matching
algorithm Testing database Performance results
2007
Proenca and Hamming Distance + a subset of 800 images from 80 EER for UBIRIS: 2.38%
Alexandre 2-D Gabor Filter classification scheme subjects chosen from each database
: EER for CASIA: 1.01%
[65] using multiple signatures UBIRIS, CASIA, ICE EER for ICE: 1.03%
2008
1-D Log polar Gabor
transform Hamming Distance + ICE: 0.74% FRR at 0.0001% FAR
Vatsa et al. [40] for global feature, and Euler 2vSVM based fusion ICE, CASIA, UBIRIS CASIA: 0.38% FRR at 0.0001%
FAR
number for local feature strategy UBIRIS: 7.35% FRR at 0.0001%
FAR 2008
Nabti and Wavelet maxima component + Correct Recognition Rate:
Bouridane Special Gabor filters
(Statistical Hamming Distance CASIA
Through statistical features:
99.52%
[33] Features) + Moment
Invariants
Through moment invariants:
99.60% 2009
Variable length (640 - 10240
bits) Maximum accuracy
Velisavljevic
[42] iris code by oriented separable Hamming Distance CASIA-IrisV3-Lamp obtained is 94.7%
wavelet transform
(directionlets) with EER 4.124%
2009
EER on BATH: 4.39×10⁻⁴
Ordinal Measures (OM) Hamming Distance + BATH, CASIAv1, EER on CASIA V1: 3.70×10⁻³
Sun and Tan
[39] using Gaussian Kernel Bootstrap learning scheme CASIA-IrisV3-Lamp, EER on CASIA V3: 3.48×10⁻³
and ICE2005 EER on ICE2005 Left eyes: 1.06×
10−2
EER on ICE2005 Right eyes: 5.72×
10−3
2010
Abhyankar and Rotation invariant
bi-orthogonal CASIA, BATH, EER 0% for 0°- 42°image
Schuckers wavelet neural network Hamming Distance Clarkson University Database,
MAE, rotation, accuracy falls below 40%
[81] using 5/3 filter West Virginia University Database for images with rotation upto 60°
2010
Derivative of Gaussian CASIA-v3-Interval EER:
Chou et al. [54] + Classifier ensembles and for CASIA-v3-Interval : 0.031%
Laplacian of Gaussian UBIRIS-v1 for UBIRIS-v1 : 0.258%
Continued on next page . . .
![Figure 1.1: Illustration of the front pigmented fibrovascular tissue known as a stroma from high quality eye images [8].](https://thumb-us.123doks.com/thumbv2/123dok_us/9727146.2854227/19.918.151.788.374.566/figure-illustration-pigmented-fibrovascular-tissue-stroma-quality-images.webp)
![Table 1.1: Comparison of different biometric modalities based on their characteristics (H: High, M: Medium, and L: Low) [1].](https://thumb-us.123doks.com/thumbv2/123dok_us/9727146.2854227/20.918.179.743.180.584/table-comparison-different-biometric-modalities-based-characteristics-medium.webp)
![Figure 1.3: Different modules of an automated iris recognition system [10].](https://thumb-us.123doks.com/thumbv2/123dok_us/9727146.2854227/24.918.166.775.184.680/figure-different-modules-automated-iris-recognition.webp)