A computational fluid dynamic analysis on the effect of
front row pin geometry on the aerothermodynamic
properties of a pin-vented brake disc
E Palmer, R Mishra*,andJ Fieldhouse
Department of Engineering and Technology, University of Huddersfield, Queensgate, Huddersfield, UK
The manuscript was received on 29 October 2007 and was accepted after revision for publication on 5 March 2008.
DOI: 10.1243/09544070JAUTO755
Abstract: Increasing demand from the consumer for higher levels of refinement from their passenger vehicles has put considerable pressure on the automotive industry to produce ever quieter cars. In order to prevent the occurrence of many forms of brake noise, especially judder and drone, excessive heating of the brake disc must be avoided, while minimizing temperature variations across the rotor. In order for this to be achieved the brake rotor must be designed such that it ensures sufficient uniform heat dissipation and thermal capacity. In high-demand braking applications, vented discs consisting of two rubbing surfaces separated by straight radial vanes are normally employed, as they utilize a greater surface area to dissipate heat. Within this paper the effects of changing the geometry of the first row of pins on aerothermo-dynamic properties of a pin-vented brake rotor are investigated using computational fluid dynamics (CFD). The validated CFD model shows that decreasing the thickness of the first row of pins by 10 per cent improves the mass flowrate through the rotor by 14 per cent and the heat transfer rate by 6 per cent. The results obtained can be used for the design of brake discs which are efficient with respect to heat dissipation.
Keywords: brake disc, heat transfer, CFD
1 INTRODUCTION
Owing to the increased refinement of passenger vehicles the expectations and demands of the con-sumer have risen. This has put greater demand on the automotive industry to produce ever quieter cars, which requires considerable effort in the area of brake refinement. Among the different types of brake noise, judder is now regarded as the most significant of all brake problems, accounting for 75 per cent of brake refinement issues [1]. This translates to a cost to the industry of $100 million (USD) per year in warranty claims alone, so the magnitude of this problem is evident [2].
The mechanism of judder is a forced vibration with a frequency directly related to the wheel speed. The vibration emanates from a variation in brake
pressure caused by circumferential disc thickness variations, resulting in high-amplitude vibrations of the wheel hub and suspension system. This vibration translates to the driver and occupants as a strong pulsation of the brake pedal, which can be accom-panied by vibration of the steering wheel and floor pan of the vehicle leading to a ‘drumming’ or ‘droning’ sound within the cabin. Judder may be categorized as cold or hot judder, but by far the most complex is hot judder. The circumferential disc thickness variation which results in the hot judder is caused by the thermal deformation of the rotor or an effect known as ‘hot spotting’ [3]. It is evident that, to prevent the occurrence of hot judder, excessive heating of the brake disc must be avoided while minimizing temperature variations across the rotor. In order for this to be achieved the brake rotor must be designed to ensure sufficient uniform heat dissipation and thermal capacity [4].
It has been shown that in a braking event the rotor may absorb approximately 90 per cent of the energy
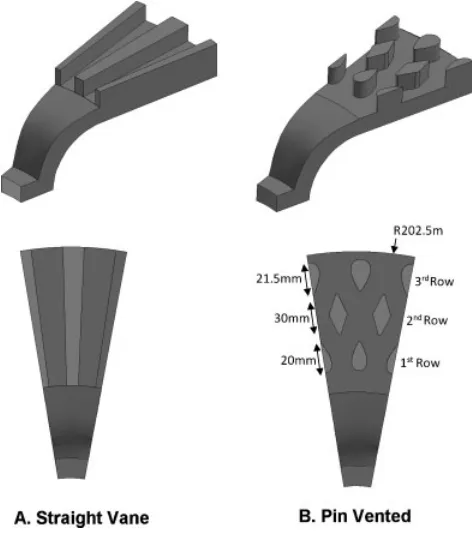
[5], which generates significant temperature rise within the rotor. In high-demand braking applica-tions vented discs are normally employed, as they utilize a greater surface area to dissipate heat. The cooling efficiency of ventilated brake discs depends on two key characteristics: the mass flowrate through the disc (i.e. the pumping efficiency of the rotor) and the average heat transfer coefficient on the surface of the disc [6]. Traditionally ventilated rotors have consisted of two rubbing surfaces separated by straight radial vanes as shown in Fig. 1(a). The thermal dissipation characteristics of a ventilated rotor can be enhanced by using curved vanes within the brake disc, thereby increasing the mass flowrate through the rotor [7]. However, use of curved vanes requires the left and right side discs to be the mirror images of each other to achieve greater pumping efficiency. Another possible means of increasing the heat dissipation of vented rotors is the use of pin-vented discs, which separate the two rubbing surfaces using a series of tear-drop and diamond sectioned columns and pillars instead of radial vanes [6]. The pumping efficiency of pin-vented rotors is less than that of a rotor with traditional vanes. However, Wallis et al. [8] have shown that the pin-vented discs have similar heat transfer rate when compared with discs having curved vanes because of increase in turbulence and hence heat transfer coefficient. Other advantages of these discs [8] include a higher resistance to thermal deformation owing to the more even distribution of material, which results in lower thermal stress build-up within the rotor. It has been further shown (Barigozziet al.[6]) that the presence of a caliper has less effect on the mass flowrate of a pin-vented disc when compared with a curved-vane disc.
In a pin-vented disc the geometry of the pins as well as their distribution may affect heat transfer char-acteristics considerably. Very little work has been reported on the optimization of the geometry of pin-vented rotors to maximize the aerothermodynamic or thermomechanical properties of such rotors. Work carried out on discs with straight radial vanes [9] has shown that a parametric approach could be used to find an optimized configuration of the vanes. It has been shown in the work that the average heat transfer coefficient of the rotor could be improved by 35 per cent over a baseline design by careful selection of geometric parameters. Therefore, it is conceivable that a similar approach could yield a significant improve-ment in the heat transfer coefficient of pin-vented rotors. The optimization of existing brake discs is a key part of the brake design procedure as many of the
parameters defining the brake’s geometry and perfor-mance are often dictated by packaging restraints (wheel diameter and offset influence rotor diameter and caliper size respectively).
The current paper attempts to define a plausible way of defining and controlling the shape of the pins within a pin-vented brake disc to investigate the effects of different pin geometries on the aerother-modynamic properties of the rotor. The parametric study is aimed at understanding the relationship between disc geometry, flow field distribution, and heat dissipation characteristics. A thorough under-standing of parametric interdependence will enable the design of brake discs having robust judder resistance.
Various methods have been used in the literature to investigate flow field characteristics within brake discs. These are experimental, computational, and analytical. The experimental and analytical methods have severe limitations when applied to brake discs because of limited flow space and complex flow field. The accuracy of mass flowrate and heat dissipation predictions has been vastly improved over semi-empirical predictions by the advances in computational fluid dynamics (CFD); now commer-cially available codes are capable of giving highly accurate results for the flow field and cooling rate of brake discs [10–12]. The present work focuses on a three-dimensional CFD parametric study of the effect of pin geometry on flow field characteristics within a commercial disc and its variants.
2 GEOMETRIC PARAMETERS
only two parameters for wedge-shaped pins – length and thickness (defined as a percentage of the chord length) – as shown in Fig. 2. This allows the effect of changing the various parameters on the key flow field and heat transfer characteristics to be studied with relative ease.
Table 1 shows various geometries used in the present analysis. In this analysis the thickness– chord-length ratio of the airfoils and wedges has
been varied, while retaining a fixed chord length and zero degrees of camber for all pins, i.e. symmetrical airfoils. This analysis takes a baseline rotor geometry based on a commercially available pin-vented brake rotor, consisting of a first row with a NACA0050 profile, second row with a 40 per cent wedge pro-file, and a third row with a NACA0060 profile. The thickness–chord-length ratio of the profile of the pins in the first row is varied by¡20 per cent from the baseline design, to find an optimized pin thick-ness for this row. The first row is selected for analysis as it has the greatest effect on the overall flow field distribution within the rotor, because the wake from the first row of pins affects the flow field around the pins downstream.
3 NON-DIMENSIONAL PARAMETERS
It is proposed to evaluate the flow field in the present investigation with the help of non-dimensional numbers to eliminate the effect of scale. The def-inition of the non-dimensional parameters used is given below.
Dimensionless radius: the dimensionless radius is defined as the radial distance between the centre of the brake rotor and the point of interest, divided by the outer radius of the rotor.
rd~
r R
Dimensionless channel width: the non-dimensional channel width is a measure of the distance between
Fig. 2 Pin geometry Fig. 1 Disc geometry (omitting top rubbing surface to
[image:3.595.53.289.85.352.2]show vane geometry)
Table 1 Analysis geometry
Design First row profile First row frontal area (mm2) Second row profile Third row profile
1 NACA0030 72 Wedge40% NACA0060
2 NACA0040 79.2 Wedge40% NACA0060
3 NACA0045 86.4 Wedge40% NACA0060
4 NACA0050 93.6 Wedge40% NACA0060
5 NACA0055 96 Wedge40% NACA0060
6 NACA0060 108 Wedge40% NACA0060
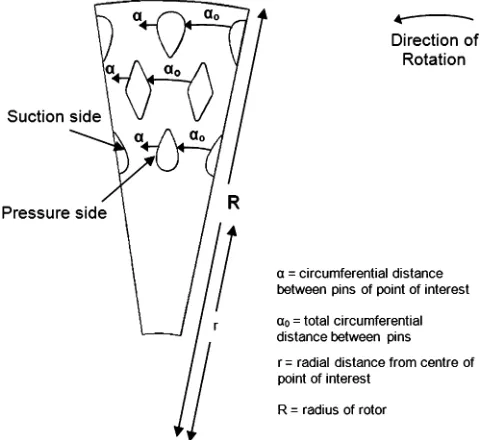
[image:3.595.95.510.537.765.2]the pins from the pressure side to the suction side of the pins within a row. It is defined as the circum-ferential distance between the pressure side of the pin and the point of interest, divided by the total circumferential distance between the pins (Fig. 3)
a0~ a
ao
Dimensionless relative velocity: the dimensionless relative velocity is defined as a ratio of the relative velocity at the point of interrogation and the linear velocity at the outer diameter of the brake disc. In the above the relative velocity at the point of interest is defined as the difference between the flow field velocity vector and the linear vector of the rotating domain at the point of interest.
V Vrel~
Vrel vR
4 MATHEMATICAL FORMULATION
The CFD programs employ a mathematical model to simulate a physical flow field. This includes a set of partial differential equations and boundary condi-tions. The CFD package Fluent solves Navier–Stokes equations, along with the continuity equations and appropriate auxiliary equations depending on the type of application, using a control volume formula-tion. In the present case the conservation equations for mass, momentum, and energy have been solved
with two additional flow transport equations for steady turbulent flow [15].
Fluent uses the finite volume method to solve the Navier–Stokes equations and is known for its robustness in simulating many fluid dynamic phe-nomena. The finite volume method consists of three stages. First is the formal integration of the govern-ing equations of the fluid flow over all the (finite) control volumes of the solution domain. Then comes discretization, involving the substitution of a variety of finite-difference-type approximations for the terms in the integrated equation representing flow processes such as convection, diffusion, and sources. This converts the integral equation into a system of algebraic equations, which can then be solved using iterative methods [16]. The first stage of the process, the control volume integration, is the step that distinguishes the finite volume method from other CFD methods. The statements resulting from this step express the ‘exact’ conservation of the relevant properties for each finite cell volume.
To enable the modelling of a rotating body (in this case the disc) the code employs the rotating ref-erence frame technique. This technique employs a modified version of the momentum and conser-vation equations. In terms of absolute velocities the left-hand side of the momentum equations becomes
L
Ltð Þrn z+:ðrnrnÞzrðV|nÞ
nris defined as relative velocity and Vis the angular velocity vector. The continuity equation employed in rotating reference-frame problems is written as
Lr
Ltz+:ðrnrÞ~Sm
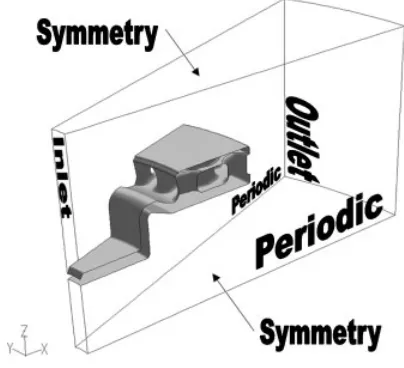
The implementation of periodic boundary (cyclic symmetry) conditions meant that only a periodically repetitive 20usection of the disc was modelled rather than the whole disc. This had the effect of making the model much smaller, translating to lower hard-ware requirements, and saving vast amounts of com-putational time.
[image:4.595.39.285.513.733.2]conditions have been used to generate zero-shear slip walls at the edge of the domain [10].
The speeds of rotation for the simulation range from 500 to 2000 r/min correlating to approximately 25–100 per cent of maximum vehicle speed of a high-performance passenger car. As radiation and conduction to the hub are neglected within the simulation, higher speeds of rotation were chosen because previous work has shown that convective cooling becomes the predominate medium of heat transfer at rotation speeds above 500 r/min [17]. A complete summary of the boundary conditions used is given in Table 2 and shown in Fig. 4.
The Reynolds number over the first row of pins is calculated from the inlet velocity obtained using the equation proposed by Limpert [18] (see below), with a minimum value of 5.966104 for 500 r/min and a maximum value of 9.536105 obtained for 2000 r/min; hence turbulent flow has been assumed to take place within the disc
Vin~0:170604n D2o{D2i
In order to model the turbulence the semi-empirical standard K–e turbulence model with standard wall treatments is employed in this study, as it has been shown to give accurate flow predictions in previous work [10–12]. A mesh independence analysis as well as volume mesh optimization were carried out, and
the final mesh structure consists of a fine mesh near the walls of the disc and a coarse mesh near the boundaries of the domain. It was seen that the results became independent of the mesh spacing when approximately 1.3 million tetrahedral elements were used in the flow domain. The mesh conver-gence analysis was performed on a model with an initial mesh of approximately 500 000 elements. The density of the mesh applied to the edges of the model was increased by a factor of 1.2 until a mesh-independent solution was obtained. The standard relaxation factors were applied with convergence criteria of 0.0001 for all residuals as recommended by the Fluent manual [15] for a tight convergence. A second-order up-wind discretization scheme is utilized as part of the solution regime for greater accuracy at the cell faces. The study was performed on an AMD 3800+ Athlon 64 machine with 2 GB of system RAM using a steady state solution scheme in a run time of approximately 10 h for each of the design iterations.
5 VALIDATION OF COMPUTATIONAL APPROACH
Computational fluid dynamics is an approximate solution technique used in the prediction of flow fields. The accuracy of results from CFD simulations depends on the quality of the mesh and the user’s ability to utilize the correct modelling techniques within the solver. Therefore validation of results obtained from the CFD analysis is essential to make meaningful predictions. In the present work the CFD model has been validated from the data available in the literature. Most of the available literature do not give the exact geometric details of the rotors analysed, making the application of the results for the purpose of validation difficult. Neverthe-less geometric details of the discs studied by Wallis
[image:5.595.91.519.98.156.2]et al. [8] are available. This paper details a CFD comparison of pin and radial vane ventilated rotors; the techniques employed in this study are later validated experimentally using particle image vel-ocimetry in further work by the same author [19], where a strong correlation can be seen between the experimental and computational results for Table 2 Boundary conditions
Boundary Boundary condition Parameters
Inlet Pressure inlet Atmospheric pressure and temperature Outlet Pressure outlet Atmospheric pressure and temperature Domain edges Symmetry Symmetry
Disc surface Wall 800 K temperature, thermal properties of grey cast iron
[image:5.595.70.272.555.739.2]pin-vented rotors. Therefore, it is possible to vali-date the CFD techniques employed in this paper against the experimental data obtained by Wallis by comparing results obtained for the same rotor geometry.
Figure 5 depicts the locations at which simulated results have been compared against the experimen-tal data. The flow fields are compared along two radial lines positioned¡2.5ufrom the centre-line of the second pin at 50 per cent of the passage height. The comparison of the results for non-dimen-sional relative velocity distribution presented in reference [19] with those obtained in the present study for the locations along the first line is shown in Fig. 6. The graph shows that there is generally
good qualitative agreement between the two sets of results. The non-dimensional velocity is seen to increase up to a radius ratio of 0.4 in both cases, beyond which it suddenly drops because of the presence of the first row of pins. There is only marginal difference between the two sets of results up to a radius ratio of 0.5, beyond which Wallis’s results tend to be greater than those obtained from the present study up to a radius ratio of 0.6. The largest discrepancy between the two data sets can be seen at radius ratio 0.7, where the results obtained by Wallis show a much larger peak in the relative velocity magnitude than those from the CFD model. Beyond radius ratio 0.75 the two cases give almost identical values. Overall difference between the two relative velocity values is calculated to be 5 per cent, with an average deviation of 0.3.
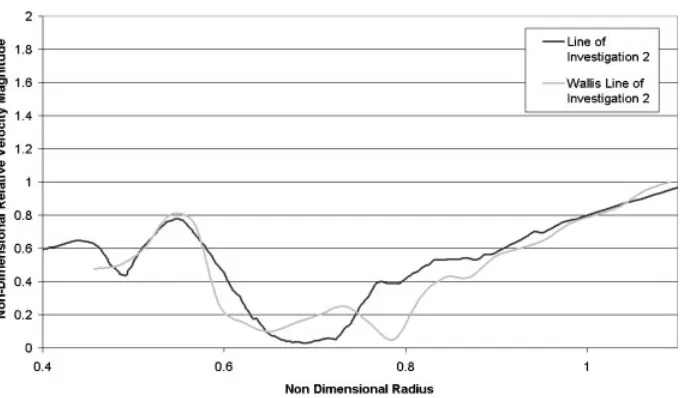
The comparison of the non-dimensional velocity distribution for the second line of investigation is presented in Fig. 7. As with the first line there is generally a strong correlation between the results obtained by Wallis and those from the compu-tational model used in the present study. The non-dimensional relative velocity increases up to a radius ratio of 0.5 where both sets of data show a drop in relative velocity value because of the presence of a stagnation point on the high-pressure side of the first row of pins. Both sets of results then show an increase in relative velocity value until a radius ratio value of 0.55. However, beyond this point a sudden drop in relative velocity is noticed, which has been caused by the wake created behind the second row of pins. There is some difference in the relative Fig. 5 Lines of investigation for comparison of CFD
models
[image:6.595.39.277.294.470.2] [image:6.595.121.465.536.735.2]velocity values at the locations corresponding to the wake trailing the second row of pins. However, the overall difference between the two relative velocity values is 1.5 per cent with an average deviation of 0.3.
It can be concluded from the above discussion that the level of qualitative similarity obtained in the flow patterns in the two analyses is good. Localized differences between the results can be attributed to the limitations of theK–emodel. It also worth noting that there is an error factor of approximately¡0.05 in results given for Wallis as they have been taken from contour plots [19]. Further inaccuracies might have crept in to Wallis’s work because of the numerical interpolation scheme used to convert raw data into contour plots. Although some dis-crepancies have been seen, the overall agreement between the two data sets is sufficiently acceptable to assume that the modelling technique is valid.
6 RESULTS
6.1 Results for baseline disc
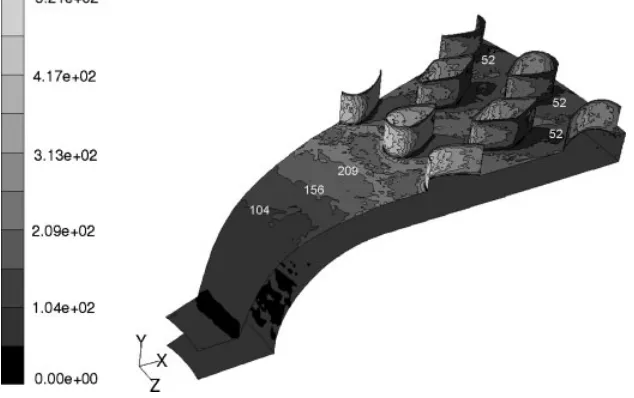
After validating the CFD model, the flow through a commercially available pin-vented brake disc has been analysed. Figure 8 displays the flow field within the baseline brake rotor. Various flow field char-acteristics such as static pressure distribution, temperature distribution, and relative velocity field, which have a strong influence on heat transfer characteristics, have been depicted in this figure. The variation of static pressure over the flow field is
shown in Fig. 8(a). It clearly shows the formation of high static pressure regions at the front of the first and second rows of pins. A considerable variation in static pressure values is seen across the disc. The static pressure value reaches a minimum of 21570 Pa at radius ratio of 0.627 (labelled ‘Min’) on the trailing edge of the first row of pins whereas the maximum static pressure value is 568 Pa at a radius ratio of 0.65 (labelled ‘Max’) on the high-pressure side of the first row of pins. The pressure field indicates that the presence of pins causes a considerable variation in pressure magnitudes.
[image:7.595.136.477.102.301.2]regions of highest temperature on the trailing edge of the second and third rows of pins. In these regions the temperature is 512 K, while the minimum temp-erature is 300 K, giving a temptemp-erature ratio (ratio of maximum temperature to minimum temperature) of 1.70.
To quantify the effect of the above flow para-meters on the cooling characteristics, mass flow-rate at the exit of a 20u section of the disc has
been computed within the Fluent package to be 0.0026 kg/s, equating to a mass flowrate through a complete rotor of 0.0468 kg/s.
Contours of heat transfer coefficient extracted from the CFD study are presented in Fig. 9 to show the relationship between the flow field character-istics presented in Fig. 8 and the heat transfer properties of the rotor. The distribution of heat transfer coefficient over the disc is non-uniform, Fig. 8 Flow field characteristics for a pin-vented rotor
[image:8.595.76.505.81.373.2] [image:8.595.134.451.538.737.2]with troughs in the low-velocity regions and peaks in the high-velocity regions. This is because high-energy dissipation occurs in the high-velocity regions and energy dissipation in the low-velocity regions. The heat transfer coefficient val-ues vary from approximately 520 W/m2K on the high-pressure side of the first row of pins to just below 60 W/m2K on the trailing edge of each row of pins, resulting in an average heat transfer coefficient of 125.4 W/m2K and heat transfer rate of 32.35 kW over the entire rotor. The large variations in heat transfer coefficient are common for pin configura-tions [13]. It can therefore be seen that in a pin-vented disc the heat transfer coefficients vary over a wide range when compared with those generated for a straight-vane-type disc, where the local heat
transfer coefficients tend to vary by around 100 per cent.
[image:9.595.91.522.295.728.2]6.2 Optimization of first row pin geometry The direction of flow in a vented disc is radially outwards. Hence geometric features near the centre of the disc are likely to have a strong influence on mass flowrate and hence heat transfer characteris-tics of the disc. In the present study, therefore, the effect of front row pin geometry, as detailed in section 2 of this paper, on mass flow and heat transfer characteristics has been investigated.
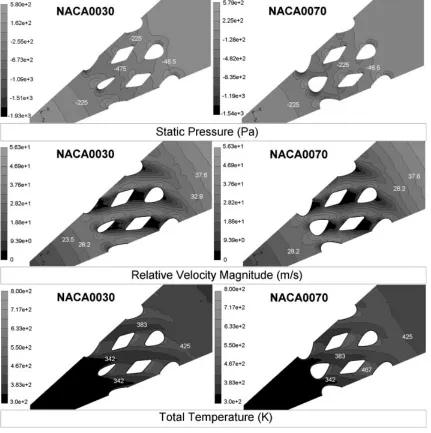
Figure 10 displays the effect of first row pin thickness on the static pressure and temperature
distribution as well as the relative velocity magni-tude. In order to establish clearly the effect of front row pin thickness, the results obtained from two pin geometries widely differing in thickness (NACA0030 and NACA0070) have been presented. The variation in static pressure distribution shows that, as with the baseline disc, both modified geometries generate regions of high pressure on the high-pressure side of the first and second rows of pins and a region of low pressure on the trailing edge of the first row. The NACA0030 profile generates a maximum static pressure of 566 Pa at a radius ratio of 0.627, equating to a 0.3 per cent decrease when compared with the baseline rotor. The minimum static pressure pro-duced by the NACA0030 profile pins is 21930 Pa on the trailing edge of the first row of pins at a radius ratio of 0.645, which is equal to a 23 per cent decrease when compared with the baseline disc. At a radius ratio of 0.600, the NACA0070 profile produces a maximum static pressure of 579 Pa, a 2 per cent increase over the baseline rotor. The value of min-imum pressure generated by NACA0070 profile is 21540 Pa at the same radius ratio, equating to a 2 per cent increase over the baseline design. It can be concluded from the above discussion that the profile of the first row of pins has a marginal effect on the maximum static pressure developed on the high-pressure side, whereas considerable variation is seen in the minimum pressure value. Decreasing thick-ness of the pin results in lower minimum pressure values.
Figure 10 also depicts the relative velocity con-tours within the discs under investigation. As with the baseline rotor, the velocity profiles for the modified geometries vary over a wide range of values. The change in maximum and minimum relative velocity values is negligible between the modified geometries and the baseline rotor. How-ever, there is significant change in the velocity distribution. The NACA0070 profile rotor creates a larger region of high velocity on the trailing edge of the pin and higher velocities at the inlet when compared with the baseline and NACA0030 profile rotors. The NACA0030 profile rotor generates higher velocities upstream of the inlet in comparison with the baseline and NACA0070 rotors owing to reduced upstream blockage. A larger region of high velocity after the stagnation point on the high-pressure side of the first row of pins can also be noticed, leading to a much larger region of high velocity along the high-pressure side of the second and third rows of pins.
The temperature plot shows that higher velocities along the high-pressure faces of the pins give rise to
lower temperatures in these regions compared with the NACA0070 and baseline rotors (more detailed description is required in terms of maximum and minimum values).
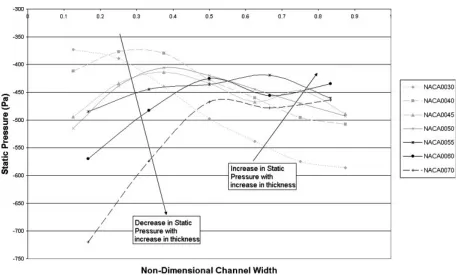
It can be concluded from the above discussion that increasing pin thickness has a large effect on the flow field within the discs. To analyse the above in more depth, static pressure distribution has been analysed at three sections, as shown in Fig. 3. Figure 11 depicts the static pressure distribution between the pins in the first row, at a radius ratio of 0.66 for all the rotor variants. It can be seen that for the baseline profile the static pressure values increase on moving away from the pin pressure side and then start to decrease again towards the suction side. For this disc the static pressure value at a non-dimensional channel width dimension of 0.1 (taken in an anti-clockwise direction) is2515 Pa. The static pressure then increases across the channel width to a maximum of2405 Pa at a channel width of 0.375; after this there is a decrease in static pressure to 2492.5 Pa at a channel width of 0.875. Therefore, the overall change in static pressure across the channel width is 4.4 per cent. Figure 11 clearly shows that increasing thickness of the pin results in lower pressures in the area immediately to the left of the pin (high-pressure region). The trend is opposite on the suction side of the next pin, although differences in magnitudes are not high. It can also be seen from Fig. 11 that the NACA0030 profile pin generates a maximum static pressure of 2373.1 Pa and a mini-mum static pressure of2586.1 Pa, resulting in a 57 per cent decrease in the static pressure across the channel width. The average static pressure across the vane gap is calculated to be2485.6 Pa, whereas the NACA0070 profile pin generates a maximum static pressure of2464.2 Pa on the trailing edge and a minimum static pressure of2719.9 Pa on the high-pressure side, resulting in a 55 per cent increase across the width of the channel with an average static pressure between the pins of2540.6 Pa.
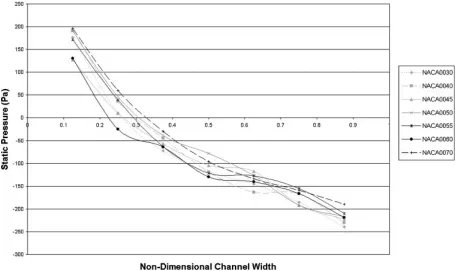
Figures 12 and 13 show the static pressure distribution between the pins in the second and third row respectively. For the baseline disc it can be seen that static pressure initially increases as the non-dimensional distances increase. The static pressure value peaks at a radius ratio value of 0.2 and
[image:11.595.76.534.72.347.2]then it starts decreasing. Similar trends are seen for all variants of the brake line disc as well. It can further be seen from Fig. 13 that an increase in the thickness of the profile of the pins in the first row generally causes an increase in the static pressure distribution across the vane gap. The trend predicts Fig. 11 Effect of first row geometry on static pressure distribution atR50.66
[image:11.595.75.535.464.730.2]that there is approximately a 15 Pa average static pressure rise between the pins in the second row over the range of pin profiles. As with the second row, Fig. 13 shows that the average static pressure between the pins in the third row increases as the pin profile thickness of the first row is increased. Like the second row of pins, the trend predicts an approximate average static pressure rise between the pins of 15 Pa. From these trends it can be concluded that the thinner pin profiles promote higher mass flowrates through the rotor.
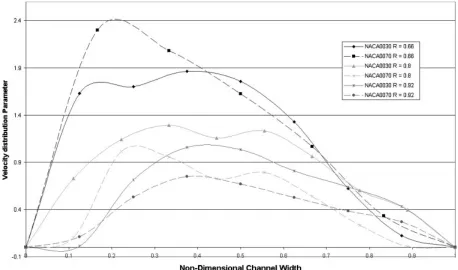
To quantify the effect of the profile of the front row pins on mass flow characteristics, a non-dimen-sional velocity distribution parameter has been used, which is defined as the ratio of the radial velocity component to the tangential velocity component. At a given location this parameter gives a measure of the redistribution of flow. The greater the average non-dimensional velocity distribution parameter across the width of the passage between the pins, the larger the mass flowrate through the rotor. The non-dimensional velocity distribution is analysed across the channel width between the pins at three different radii – 0.66, 0.8, and 0.92 (Fig. 3) – and is shown in Fig. 14. In order to allow the comparison, the non-dimensional velocity values have been plotted against the non-dimensional channel width. It can be seen from Fig. 14 that for the thinnest profile of the first row of pins (NACA0030), the bulk
of the flow passes through the central 80 per cent of the pin gap with significant asymmetry in the velocity profile, with high values of non-dimensional velocity distribution parameter nearer the high-pressure side and low values of velocity param-eter on the suction side at a radius of 0.66. A similar trend is seen for the NACA0070, but the extent of asymmetry is increased. At the middle location (R50.8) for both the profiles, velocity values have reduced considerably because of diffusion, and the extent of asymmetry has reduced as well. Similar trends have been noticed at a radius ofR50.92 mm. Static pressure profiles seen in Fig. 11 tie in with the velocity profiles seen here. At the locations where high velocities have been seen, Fig. 11 shows that the pressure values are smaller.
The pressure and velocity fields directly affect mass flow characteristics of the disc. This section describes the effect of varying the first row pin profile on the mass flowrate of air passing through the disc at various speeds. Figure 15 clearly shows the effect of increasing the frontal area of the pin on mass flowrates through the disc. It can be seen that increase in the pin thickness results in lower mass rate of flow at a given speed.
[image:12.595.63.519.84.355.2]resulting in higher heat transfer rates. This is in agreement with results obtained previously by Limpert [18], Sisson [20], and Wallis and co-workers [8,19], as well as observations made by Barigozziet al.[6].
In order to analyse the heat transfer character-istics, Fig. 16 has been prepared, which depicts heat
[image:13.595.75.533.84.354.2] [image:13.595.81.533.386.639.2]and mass flow characteristics at the maximum speed used in the present investigation of 2000 r/min. It can clearly be seen that as the pin thickness is increased the mass flowrate of air through the disc generally decreases, which results in a correspond-ing decrease in heat transfer rate. It can also be seen Fig. 15 Effect of first row pin thickness on mass flowrate across the range of angular velocities
that the trends seen for mass flow characteristics are similar to heat transfer characteristics, indicating a strong correlation between the two until the pin profile thickness is decreased to NACA0040. In order to gain a greater understanding of what happens when the pin profile is decreased to less than NACA0040, additional models with first row pin profiles of NACA0033, NACA0036, and NACA0039 have been simulated. These points show that the mass flowrate continues to increase with a near linear relationship as the pin profile is decreased, with a maximum of 0.0102 kg/s occurring at NACA0030. The heat transfer rate, however, deviates from the previously linear trend, with a peak heat transfer rate of 1836 W observed for the NACA0036 profile; after this point the heat transfer rate begins to decrease with a decrease in pin profile. Despite the increased flow through the NACA0030 disc compared with the NACA0036, there is a reduction in the total heat transfer. There are two possible reasons for this decrease. The first is the reduction in wetted surface area for the heat to be removed from the rotor. This is in agreement with conclusions drawn by Carloset al.
[21], who stated the importance of maximizing wetted area and heat transfer coefficient to give optimal heat transfer characteristics. However, the reduction in wetted area between the NACA0036 profile and the NACA0030 profile is negligible (less than 0.1 per cent). Another possible explanation for the decrease in the heat transfer for pins with a slimmer profile than
NACA0036 is the increase in inlet area, which causes an increase in the mass flowrate, yet at the same time yields a decrease in the inlet velocities. This in turn reduces the heat transferred because it is well known that heat transfer is a function of the velocity; this has been described earlier as well in the comparison of Figs 8 and 9. The approximate difference between the highest and lowest mass flowrates is 14 per cent and the difference over the range of heat transfer rates is approximately 6 per cent.
7 CONCLUSIONS
[image:14.595.63.518.84.349.2]The present investigation has clearly revealed that pin profiles affect heat transfer characteristics of a pin-vented disc considerably. It has been success-fully shown that through control of one parameter, the pin thickness of one row, it is possible to increase the mass flowrate through the disc by 14 per cent and the heat transfer rate by 6 per cent. It was found that increasing the profile thickness resulted in a decrease in the mass flowrate through the disc and a decrease in the average non-dimensional velocity distribution parameter of the flow within the rotor. This results in a decrease in the heat transfer coef-ficient. In the present investigation, the NACA0030 profile has been found to give the best mass flow, and the NACA0036 has been found to have the best heat transfer characteristics.
REFERENCES
1 Thompson, J. State of the art towards the NVH robust brake – USA position. In Proceedings of Brakes 2006, an NVH Robust Brake Session, York, UK, 7 May 2006.
2 Akebono Braking Technology.Brake noise, vibra-tion and harshness: technology driving customer satisfaction, 2005. Further information available from www.akebonobrakes.com.
3 Steffen, T.Hot spot simulation. In Proceedings of the IMechE Conference on Brakes 2006, York, UK, 2006, pp. 199–208.
4 Dahm, K. L.andDearnley, P. A.Thermal model-ling of disc brake rotors to enable the optimal exploitation of surface engineering. In Proceedings of the IMechE Conference on Brakes 2006, York, UK, 2006, pp. 115–124.
5 Phan, D. and Kondyles, D. Rotor design and analysis; a technique using computational fluid dynamics (CFD) and heat transfer analysis. SAE paper 2003-01-3303, 2003.
6 Barigozzi, G., Cossali, G. E., Perdichizzi, A., Boden, A., and Pacchiana, P. Experimental in-vestigation of the mean and turbulent flow char-acteristics at the exit of automotive vented brake discs. SAE paper 2002-01-2590, 2002.
7 Massey, B. S.Mechanics of fluids,6th edition, 1989, pp. 534–538 (Chapman and Hall).
8 Wallis, L., Leonardi, E.,andMilton, B.Air flow and heat transfer in ventilated disc brake rotors with diamond and tear-drop pillars. Numer. Heat Transfer, Part A, 2001,41, 643–655.
9 Qian, C. Aerodynamic shape optimization using CFD parametric model with brake cooling applica-tion. SAE paper 2002-01-0599, 2002.
10 Tirovic, M. andGalindo-Lopez, C. H. Analysis of air flow and heat dissipation from wheel mounted railway brake discs. In Proceedings of the IMechE Conference on Brakes 2006, York, UK, 2006, pp. 125–134.
11 Voller, G. P., Tirovic, M.,andGibbens, P.Analysis of automotive disc brake cooling characteristics.
Proc. Instn Mech. Engrs, Part D: J. Automobile Engineering, 2003,217, 657–666.
12 Yeo, T. I., Choi, H., and Kim, J. H. Equivalent axisymmetric finite element applied to undercut shape design of ventilated brake disk. In Proceed-ings of the IMechE Conference on Brakes 2006, York, UK, 2006, pp. 135–144.
13 Palmer, E., Fieldhouse, J.,andMishra, R. Optim-isation of pin shape and its configuration for a ‘pin’ type vented brake disc using CFD. In Proceedings of the FISITA World Automotive Congress, October 2006, paper F2006D115.
14 Jacobs, E., Ward, K., and Pinkerton, R. The characteristics of 78 related airfoil sections from tests in the variable-density wind tunnel. In Proceedings of the NACA Conference, Yokohama, Japan, 1933, TR no. 460.
15 Fluent Incorporated. Fluent user guide, 2003 (Fluent Incorporated).
16 Versteeg, H. K.andMalalasekera, W.An introduc-tion to computaintroduc-tional fluid mechanics; the finite volume method, 1995 (Prentice Hall).
17 Daudi, A.andNarain, M.72 curved fin rotor design reduces maximum rotor temperature. SAE paper 1999-01-3395, 1999.
18 Limpert, R. Cooling analysis of disc brake rotors. SAE paper 751014, 1975.
19 Wallis, L. M. A comparison of bi-directional disc brake rotor passage designs, Australian Digital Theses Program, 2003.
20 Sisson, A.Thermal analysis of vented brake rotors. SAE paper 780352, 1978.
21 Carlos, H., Galindo, L., and Tirovic, M. Air flow and heat dissipation analysis of commercial vehicle brake discs. In Proceedings of the 11th European Automotive Congress EAEC, Budapest, Hungary, 2007, paper CV06-3.
APPENDIX Notation
c chord length (m)
Cmax maximum camber (m)
Di inner diameter of disc (m)
Do outer diameter of disc (m)
n speed of rotation (r/min)
p pressure (Pa)
r radial distance from centre of point of interest (m)
rd radius ratio
R radius of rotor (m)
Sm source term (kg)
t time (s)
Th aerofoil profile thickness (m)
n velocity vector (m/s)
nr relative velocity vector (m/s)
Vrel relative velocity magnitude (m/s)
V
Vrel non-dimensional relative velocity magnitude
Xcmax position along chord of maximum camber (m)
a circumferential distance between
pins of point of interest (m)
a9 non-dimensional channel width
a0 Total circumferential distance be-tween pins (m)
m viscosity (Pa s)
r density (kg/m3)
v angular velocity (rad/s)