2017 2nd International Conference on Computer, Mechatronics and Electronic Engineering (CMEE 2017) ISBN: 978-1-60595-532-2
A Method of Load Spectrum Construction for Big Operation Vehicle
Based on User Goal
Lu ZHANG, Wei ZHOU and Wen-liang LI
Key Laboratory of Operation Safety Technology on Transport Vehicles, Ministry of Transport, PRC, Beijing 100088, China
Keywords: Reliability, Time-varying, Big operation vehicle, User goal, Load spectrum.
Abstract. The traditional design of big operation vehicle mainly depends on the experience due to almost neglecting the influence of reliability in actual operating condition and varying road of roughness. A method of user goal’s load spectrum construction for reliability research of big operation vehicle was proposed. Speed operating condition was established and GPS data of vehicle operation was analyzed based on researching the user information of the passenger transportation enterprise, considering the characteristics of large passenger operation of the line and according to the road type on the running route segments. The change between spectral density of road pavement with using year was regressed and derived based on regression of the relationship between riding quality coefficient with using year, combination with pavement riding quality index and international roughness index, and pavement density dependence index with power spectrum. Load of users’ operating speed condition under different using age and user goal’s load spectrum under design life for big operation vehicle was obtained on the collection of user road load and establishing and verification of vehicle dynamics model. This method can provide reference for reliability research of big operation vehicle.
Introduction
Reliability is one of the most focused performance to users, which is no exception for big operation vehicle that has a large number of passengers, quality, use fixed number of year with long range and high fatality rates and large scope. The driving load of bus is the most important factor affecting the reliability of the vehicle, which is determined by the operation condition of the bus, including the roughness of the road, the speed of the driving and the carrying capacity. The product research and development of traditional bus industry mainly depend on experience design, which is less concerned with the impact of the actual working condition of the bus and the inflates of the time-varying pavement. The disadvantages of experience design can lead to that the vehicle matching is difficult to achieve the optimal, vehicle structure design for some roads appear too wastes the resources, and damage of key parts appears insufficient design for some roads. Therefore, many scholars have carried out research on the acquisition of vehicle load spectrum and the construction of target load spectrum.
The surface roughness is a way to influence the driving load of the car by the change of load spectrum, which is the main factor of vehicle operating environment [1]. Yu build the vehicle target load spectrum based on the investigation of the actual working condition of vehicle users and the collection of user road in typical area [2, 3]. Wang used the method of fuzzy clustering and hierarchical division to divide the pavement flatness [4]. Guo determined the maximum load of load spectrum based on adopting one stress amplitude per 106 [5, 6]. Veers introduced the nonlinear parameter model to extrapolate the finite data, and studied the use of moment method to predict the long-term load [7]. Ronold proposed a new model of the moment based on the moment in the extrapolation load [8]. Chengapplied the extrapolation method to the prediction of fatigue life of wind power generation equipment [9]. Peeringa J used the parameter method to predict the impact of wind turbine load type on fatigue life [10]. Johannesson P put forward the method of extrapolation and extrapolation of rain flow [11, 12].
vehicle was proposed. Speed operating condition was established and GPS data of vehicle operation was analyzed based on researching the user information of the passenger transportation enterprise, considering the characteristics of large passenger operation of the line and according to the road type on the running route segments. The change between spectral density of road pavement with using year was regressed and derived based on regression of the relationship between riding quality coefficient with using year, combination with pavement riding quality index and international roughness index, and pavement density dependence index with power spectrum. Load of users’ operating speed condition under different using age and user goal’s load spectrum under design life for big operation vehicle was obtained on the collection of user road load and establishing and verification of vehicle dynamics model. This method can provide reference for reliability research of big operation vehicle.
Acquisition of User Information
The Influence factors of vehicle reliability are user the information of road type, the operation speed, and the number of passengers, which does not consider the driver driving behavior and the influence of vehicle deceleration and steering conditions in this paper.
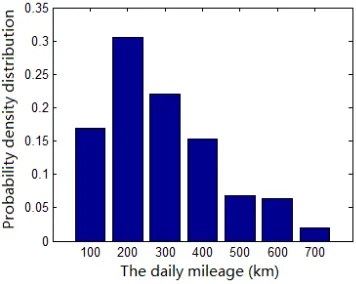
[image:2.612.214.392.404.546.2]According to the investigation of a passenger transport company, the passenger transport company is located in the middle eastern region of China, and the operation route covers all kinds of roads in China. The starting station of the operation route is the passenger terminal of the city. The terminal has Shanghai, Zhengzhou, Yantai, Hengshui, Zaozhuang, Suzhou and Dalian, and more than 200 lines of operation. Based on various operational route of GPS data analysis shows that the vast majority of large operating buses operating line of road type from urban road to the highway and urban road, and large-scale operation of the passenger car running highway and city road mileage rate most about those days. The average mileage of this type of car is 241km, and about 90% of the buses are less than 500km each way, as shown in Figure 1.
Figure 1. Distribution of one single operating mileage for large operating passenger.
Figure 2. Velocity distribution of large operating passenger on urban road.
Figure 3. Velocity distribution of large operating passenger on freeway.
In terms of carrying capacity, the probability of the average passenger carrying capacity of large passenger bus passenger vehicles is 90%.
Time-varying Characteristics of Users' Road Surface Roughness
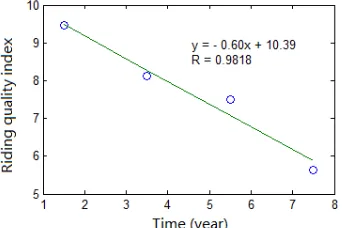
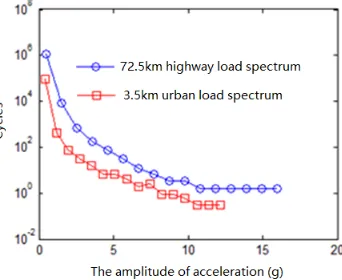
Different grades of road surface have different fatigue damage to vehicle parts. Literature [3] pointed out that the quality of road surface of various roads varies with the year of use. Using the data to return to the road of highway and the road of the city road traffic quality coefficient (out of 10) with the use of the years of the relationship, as shown in figure 4 and figure 5. It can be seen from the figure that the quality index of the road surface has a linear decreasing trend in the general use year, and the rate of change is -0.60 and -0.84 respectively.
[image:3.612.222.393.552.666.2]Figure 5. Riding quality coefficient of urban road change with using age.
Highway Performance Assessment Standards' (JTG H20-2007) put forward the relationship between the road quality index and the international level index [13]:
1 0 100 1 a IRI
RQI
a e =
+ (1) In the formula, IRIis the international level index, m km/ . a0 is the highway and the first highway take 0.026, and the other class highway take 0.0185. a1 is the highway and the first highway take 0.65, and the other class highway take 0.58.
Literature [14] establishes the relationship between the pavement flatness index and the power spectral density:
0 0.60 q( )
IRI= G n (2) In the formula, G nq( 0) is the pavement power spectral density.
In conclusion, the relationship between road power spectrum density and pavement quality coefficient is:
( )
(
)
20
1 0
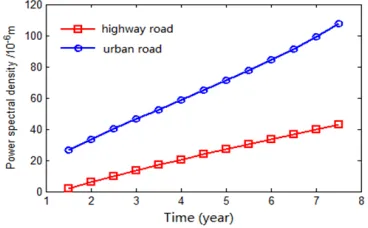
log 100 / 1 / ( )= 0.60 q RQI a a G n − (3) Therefore, combined with the pavement quality coefficient and use year relationship expression, obtained is shown in figure 6 highway and urban road pavement power spectral density changing with the use of year is:
( )
(
)
( )
(
)
0
log 769 / 10.39 0.60 77 0.2535
( )=
log 1081/ 9.69 0.84 108 0.2018 q T highway G n T urban − − − − (4)
In the formula, Tis the years for the use of roads. The highway use year is 1.5 years if the level of the road is less than 1.5 years
[image:4.612.211.395.615.729.2]User Road Load Collection Test
In order to carry out the test model with a large working bus of 11.4 meters, the weight distribution is full, and the three acceleration sensors are installed at the head of each axis. 3d modeling and finite element analysis of key components are used to determine the strain concentration point as the strain gauge paste position. Collected a large operating passenger car users road users road load and reliability testing ground road load, among them, the road user acquisition speed requirements mainly refer to the statistical results of user information, path selected by the user the use of the year for five years.
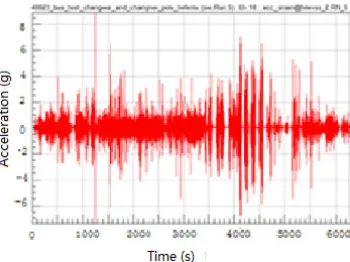
[image:5.612.226.387.215.318.2]For example, the sensor points are shown in figure 7. The time history signal collected is shown in figure 8. The following describes the construction of the user target road load spectrum to take this signal as an example.
Figure 7. Test point for vertical acceleration of the left front wheel spindle.
Figure 8. Vertical acceleration of the left front wheel spindle.
Vehicle Driving Dynamics Model Road Roughness Model
Road roughness is the main source of vehicle vibration, in order to get the vehicle load in in all sorts of different pavement data, set up the mathematics model of road roughness data, get all sorts of different levels of pavement equation is as follows:
2 0 0 ( ) ( )( )
1 ( ) ( )
n Gq n Gq n
n f un
Gq f Gq n u f un =
=
=
ω = 2π = 2π
(5)
By deriving the time domain signal of the inflates of the road surface:
0 0 0
( ) ( ) ( ) ( )
q t = −2πn uq t + 2πn Gq n u w t•
(6) In the formula,uis speed, n0 referred to as the reference space,
1 0 0.1
[image:5.612.220.395.344.475.2]noise in the time domain signal, q t( )is road surface spectrum signal, G nq
( )
is namely for referenceunder the spatial frequency of the road power spectral density value, which known as the road roughness coefficient, the unit is 1
/
mm m−. 1/4 2-degree-of-freedom Vehicle Model
The automobile is a complicated mechanical system, which should be simplified according to the different analysis problems. In plane vehicle dynamics model, tire damping smaller ignored, when the vehicle suspension quality distribution coefficient value ε =ρy2/ab is close to 1, before and
after the vertical vibration of the suspension system is almost independent of, the vehicle dynamics model can be simplified into a quarter of two degrees of freedom vehicle model. See figure 9.
Figure 9. 1/4 two degree freedom vehicle model.
In Fig. 9, m2is the spring load quality, m1 is the spring load, K is the spring stiffness, C is
the damping coefficient of shock absorber, Kt is the stiffness for tires.
The vertical displacement coordinates of the wheel and the body is z1, z2 , which is selected at the respective equilibrium position. The motion differential equation of the model is:
.. . .
2 2 2 1 2 1
.. . .
1 1 1 2 1 2 1
( ) ( ) 0
( ) ( ) t( ) 0
m z c z z k z z
m z c z z k z z k z q
+ − + − =
+ − + − + − =
(7)
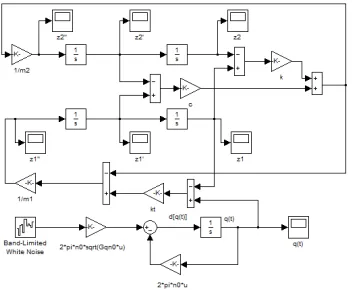
[image:6.612.265.345.211.334.2]Based on the motion differential equation, the simulation model is established directly in Matlab/simulink, as shown in Figure 10.
Figure 10. 1/4 two degree freedom vehicle simulate model.
Verification of Model
[image:6.612.217.393.511.656.2]rain flow matrix, and translated into zero mean load spectrum, compared with the test data, the result is shown in Figure 11. The accuracy of the model is known.
Figure 11. Comparison of load spectrum in simulation and test unit kilometer.
User Target Road Load Spectrum Construction
By rain flow technology, large-scale operation of the passenger car running on the highway and city road left front wheel shaft head vertical acceleration of the rain flow matrix, into zero mean load spectrum (Figure 12), and one of them.
Figure 12. Load spectrum of vertical acceleration in the left front wheel spindle.
According to the ministry of commerce, large operating buses are recommended to be used for 15 years as a large operating passenger vehicle. Suppose that urban roads and highways are maintained at a time of year, and the road surface roughness is consistent with the pavement. In the cycle of each year, the road of the city and the road of the highway are changed with time.
Considering the characteristics of the operation of the large-sized operation bus, the cycle of every t year is divided into the sub-cycle of the year, i.e. the average annual operating mileage of large operating buses in this sub-cycle is 22.63 million kilometers.
The use of years in 0-t and t~2 , 2 ~3t t t is the same as the year. The 15 years obsolete quantity consists of m cycles and n remainder years. n is the remainder years.
Therefore, there is the following relationship: m fix 15 n mod 15,
(
t)
m t n 15 t
= = × + =
, ,
[image:7.612.221.392.321.461.2]Figure 13. Comparison of load spectrum in simulation and test unit kilometer.
If the load spectrum of 0-t years is collected, the load spectrum of the large operation bus can be calculated as follows:
( )
( )
(
)
(
( )
( )
)
1
t t
t n
C m A i B i A i B i
−
=
∑
+ +∑
+ (8)In the formula, A i
( )
,B i( )
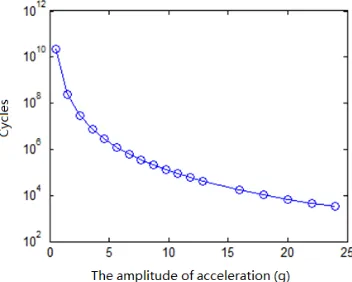
are the load spectrums that run on subway and urban road during the (i-1) to (i) years.Combined with the simulation model, can make users year running speed under the condition of different load, by rain flow matrix, rain flow superposition and transformation of zero mean, user goals can be obtained left front axle head vertical acceleration load spectrum of the large operating passenger car in 15 years, as shown in Figure 14.
Figure 14. User 15 years’ goal load spectrum of big operation vehicle.
Summary
A method of user goal’s load spectrum construction for reliability research of big operation vehicle was proposed, which considering the influence of reliability in actual operating condition and varying road of roughness.
The change between spectral density of road pavement with using year was regressed and derived based on regression of the relationship between riding quality coefficient with using year, combination with pavement riding quality index and international roughness index, and pavement density dependence index with power spectrum.
[image:8.612.218.394.392.533.2]Acknowledgement
We thank the support of the special fund project in basic scientific research operation from the central public welfare science research institute (No. 2014 - 9042).
Reference
[1] Yang Rui-feng. A study on highway surface power spectrum investigation and measurement [J]. Changchun: Jilin University, 2004(10).
[2] Yu Hai-bo. Research on reliability test method correlated proving ground with customers usage for automotive load carrying system [J]. Changchun: Jilin University, 2008(12).
[3] Wang Ruo-ping, Jiao Xian-zheng, Wang Guo-lin, et al. A study on method about typical section selection of road and improvement method [J]. Highway, 2009, 3(3): 102-107.
[4] Ma Ying, Duan Hu-ming Shi Feng. Statistical analysis of road roughness in north China based IRI [J]. Highway, 2012, 9(9):218-223.
[5] GuoHu, Chen Wenhua, Fan Xiaoyan. Research of enhancement coefficient of automobile reliability enhancement test on proving ground [J]. Chinese Journal of Mechanical Engineering, 2004, 40(10): 73-76.
[6] Gao Yunkai, Xue Chengmin, Fang Jianguang. Study on the programmed load spectrum of the body fatigue bench test [J]. Journal of Mechanical Engineering, 2014, 50(4): 92-98.
[7] Veers P S, Terstein S R. Application of measured loads to wind turbine fatigue and reliability analysis[R]. ASME Wind Energy Symposium, 1997:160-169.
[8] Ronold K O, Wedel- Heinen J W, Christensen C J. Reliability-based fatigue design of wind-turbine rotor blades [J]. Engineering Structures, 1999(21): 1101-1114.
[9] Cheng P W, Van Bussel G J W. Reliability-based design methods to determine the extreme response distribution of offshore wind turbines [J] Wind energy, 2003(6): 1-22.
[10] Peeringa J. Comparison of extreme load extrapolations using measured and calculated loads of a MW wind turbine [M]. ECN Wind Energy, 2009.
[11] Johannesson P, Thomas J. Extrapolation of Rain-flow Matrices [J]. Extremes, 2001(4): 241-262.
[12]Johannesson P Extrapolation of load histories and spectra [J]. Fatigue Fract Engng Mater Struct, 2006(29): 201-207.
[13] JTG H20-2007. Highway performance assessment standards[S]. Beijing: Research Institute of Highway Ministry of Transport, 2007.