PREDICTION OF SUSTAINABLE SUPPLY CHAIN
MANAGEMENT FOR GAYO COFFEE USING SYSTEM
DYNAMIC APPROACH
1RACHMAN JAYA, 2MACHFUD,2SAPTA RAHARJA,2MARIMIN
1
Researcher, Assessment Institute for Agricultural Technology Aceh,Indonesia
2
Lecture, Department of Agroindustrial Technology, Bogor Agricultural Technology, Indonesia
E-mail: [email protected], [email protected], [email protected],
ABSTRACT
Gayo coffee is an indigenous commodity in Aceh Province, Indonesia, especially for Gayo ethnic who lives in Gayo Highland. Sustainable supply chain was an extension of conventional supply chain that specifically focuses on economic, social and environment dimension. In operational purpose, third aspects appropriate trade off, one side actors have economic growth and the other side gives negative impact for social and environment aspects. The objectives of this research were to investigate important factors influence in sustainable Gayo coffee supply chain (GCSC), and to predict the future about sustainability of GCSC as well as to build the scenario policy for actors. In this research, we explored relationship among economic, social and environment dimension on farmers, collectors as well as processor while current practice and prediction for the Gayo coffee supply chain using system dynamics and multi-dimensional scaling approach. GCSC chain help to map actors and activities, while the sustainability of GCSC was explained through net profit for economic dimension, social welfares and management by product (pulp) to produce compost as well as water efficiency when production process. Predictions for the future of sustainable for GCSC within all actors based on third dimension were also explored.
Keywords: Sustainable Supply Chain, Gayo Coffee Supply Chain, System Dynamics, Aceh Province
1. INTRODUCTION
In recent years, sustainable supply chain management (SSCM) has been gaining attention because of increasing level of environment damage and social conflict in a production system. SSCM is developed from conventional supply chain that
inherently discussed economic, social and
environment on a product supply chain [1, 2, 3, 4, 5, 6]. But, specifically [7] describe “SSCM as the creation of coordinated supply chains through the voluntary integration of economic, environmental,
and social considerations with key
inter-organizational business systems designed to efficiently and effectively manage the material, information, and capital flows associated with the procurement, production, and distribution of products or services in order to meet stakeholder
requirements and improve the profitability,
competitiveness, and resilience of the organization over the short- and long-term”.
There are economical accomplishments in business process (profit oriented), social aspect refers to actors welfare and environment related to
green productivity and energy efficiency as well as corporate social responsibility [8, 9]. In practically, SSC have driver factors for instance government
through policy regulative [10], economic
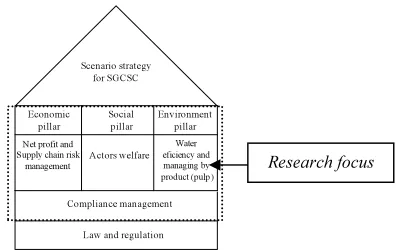
profitability [11], product life-cycle [12]; [13], information technology [14] and [47]. Fig. 1 illustrates the sustainability of Gayo coffee supply chain (SGCSC) concept (house of SSC), including
driver its.
Scenario strategy for SGCSC
Economic pillar
Social pillar
Environment pillar
Compliance management
Law and regulation
Net profit and Supply chain risk
management
Actors welfare
[image:1.595.307.506.575.700.2]Water eficiency and managing by product (pulp)
Figure 1: The house of SGCSC (adapted from [2])
Based on operational conditions, movement of SSC can occur in the form of trade-off three aspects. [3], stated that generally enterprise have
high revenue from their business activities, therefore that situation can damage environmental and triggered social conflict with society around its surrounding community. To solve that problem, many experts recommended for all actors who are involved in a product supply chain should achieve sustainable development concept in their supply chain. According to [15], that sustainability index of GCSC was 35.33 which mean less sustainable, hence based on leverage analysis, several elements which most influence on GCSC were net profit, risk management, actors skills, water efficiency and utilizing pulp to produce a compost.
Gayo Coffee (GC) is a main commodity for Acehnese, as well as palm, cocoa and nilam, particularly for Gayo ethnic. Long time ago, these products had given life for them, but basically haven’t economically income. Nowadays, the total area planted with Arabica Gayo coffee reached 81.000 ha at Bener Merah and Aceh Tengah Districts, with an average productivity of 0.79 ton/ha, comparatively lower than Brazil and Vietnam [16, 17, 18]. In supply chain contexts, there are problem on its management. That problem is caused by ineffective and inefficient management of supply chain, as well as only driven by one aspect is economic. Effective refers to balancing among three dimensions, hence efficient relates to the cost of production [19, 20, 21].
This research is motivated by needs a method that can be used as tools by stakeholder in decision-making process, on recovery of Gayo Coffee business. The basic of strategy must be including economic aspect, likes risk analyzing and mitigation of supply chain, profit and how to generate a benefits fairness distribution model. Aspect social consisted of relationships role among actors and actors skills plus the environmental discussion, such as the water efficiency in production process (based on eco-efficiency concepts), by product management like utilize pulp to compost and organic agriculture system [34]. The objectives of this research were to study the sustainability model behavior and to develop a scenario policy in Gayo coffee supply chain.
The structure paper consist a literature review that discusses definition, dimension and elements of
SSCM from previousresearch to develop our study
based on three aspects in SSCM. In the next step, we will describe the methodology which is used, and then the findings in study which are going to explained based on literature review. Finally, we concern the sustainability index of GCSC and future research.
2. LITERATURE REVIEW
A. Sustainable supply chain management
Previous research has identified about SSCM that developed at various industry [22], and from another side [23] to predict that SSCM will become hot topic in the future. Furthermore, they stated that SSCM means that organizations in supply chain structure have to take responsibility for the environmental and social performance of their supplier. SSCM in our research discuss integrating economic, social and environment dimension for Gayo coffee commodity. Generally, economic dimension including net profit for each actor [24, 25] social aspect discuss related to actors welfare level [26] and environmental consists by product (pulp) utilize to compost [27, 28]. For detailed elements will be discussed on next step.
B. Elements in Sustainable supply chain management
As discussed in the previous chapter that our study consisted of three dimension namely economic, social and environment which have element for each. To be more specific, we use demand as elements in the economic dimension [29, 30] total cost [31,32], price [33] and total produce for each actors. Moving to environment dimension, elements in this section include composting of pulp [16, 27, 34] and water efficiency in production process [35]. Mean while, social dimension discuss an actor’s skills which is analyzed based on experience actors and numbers of training who is followed.
C. System dynamic in supply chain
System dynamics (SD) is a reliable technique to construct, analyze and simulates in complex system. In the early 60’s, Forrester introduced the system dynamics methodology for modeling and simulating an industrial management cases [36, 22]. After then, this methodology has been used to solve industrial problems. [30] state that SD can be used an approch to understand behavior of the system, through feed back mechanism. Many publications which is using SD to solve supply chain problems,
e.g. [29] developing model to remanufacturing in
closed-loop supply chains, [20] used SD to build a
scenario for optimizing trade-off between
fruits, [39] apply SD to describe the disaster relief of supply chain.
In this research we are using the SD methodology to build the scenario to establish GCSC sustainability even more. Diverse with many researchers which were used SD in supply chain area, our study focus on three pillars in
sustainability e.g. Economic, social and
environment on farmers, collectors and processor, whereas they are focus on internal supply chain such as demand, supply, price, market, life-cycle, transportation and inventory.
D. The Gayo Coffee Supply Chain System (GSCS) Structure
Arabica coffee is produced at Gayo highland namely, Gayo coffee. It was refers to a zone that consist in Bukit Barisan highland at Sumatera island, whereas base on national administration, it was exists in Aceh Tengah and Bener Meriah district, Aceh Province, Indonesia. In 2010, total produce of GC reach up to 35.000 ton, these numbers are produced from 81.000 ha planting area, with an average productivity 0.79 ton/ha. This number is rather low, than Arabic coffee exporter likes Brazil and Vietnam [40,15].
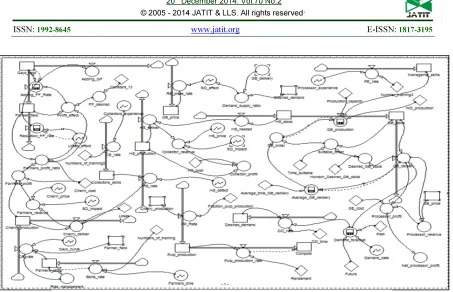
GCSC activities were including many actors and activities (Fig 2). It was begun from the farmers that actions e.g. agriculture, harvesting and primary handling to produce Cherri coffee. The Collectors activities are including secondary handling to produce the Hard Skin (HS) coffee. Processor consisted of processing HS coffee to green bean. Uniquely in GCSC processor can also remains as exporter to sell GC to buyer for several countries in European Union, Japan, South Korea, USA, Australia and New Zealand [17,18;15].
Farmers Collectors Processor and
exporter Importer
Produced is cherri Produced is HS coffee Produced is green bean Focus study
Remarks: Material flow
Money flow Information flow
Figure 2: Structure of GCSC
In sum, several literatures have reviewed above can explain about the dimension and elements which influence the sustainability of GCSC. Furthermore, it can be discussed on macro
forester diagram, including relationship among
dimension and elements for each actor.
3. METHOD AND ANALYSIS
A. Problem defeniton
The fundamental assumption of this research is how to increase the sustainability index (35.33) of GCSC, rather sustain category [15] to more sustain. Based on the fact, we have to undertake a study that can increase its. Our works is begun from developing GCSC structure. According to [22], in sustainability perspective of Gayo coffee, the main activities were to mapping supply chain structure which is including all actors and activities. The output from the first step would be used as input to modeling of supply chain sustainability, through system dynamic approach.
Next step, we arranged the research design to comprising how to collect data and what the methodology used. Based from that, we can explain that this work completely using two methodologies to build the scenario. Mapping of Gayo coffee structure was done by descriptive analysis. It is consists of how to all actors carry out their business in meaning “from field to the table”.
B. Forrester diagram
This research was arranged using SD to explain the role of each element in GCSC. According to [29], the first step is to build system map through a causal loop diagram (Figure 3). It is Essential that, we could saw role of actors relationship while both accomplish their business, due to a causal loop diagram represents the main feedback mechanisms. These mechanisms are either negative (balancing) or positive (reinforcing) feedback.
Base on figure 3, we view three dimensions necessary to build sustainable of GSCS, such as economic dimension: profit and production volume, social: actor’s skills and relationship of them as well as environment: utilizing pulp to compost and efficiency water. Respectively those dimensions
have relationship which was denoted positive (+)
and negative (-), where relationship (+) show, there was relation (+) between each elements, meaning this state was, if one of value element increase then increase another element, in the manner, if relation
each element (-), then decrease another element
[29].
[image:3.595.97.287.550.670.2]
processor depend on demand by importer that have fluctuating, on the other hand, this condition influence price and then influenced profit.
Hence profit of collectors depends on the production volume of HS coffee and certainly purchasing price from processor and so do to farmers. Social aspect concerned on social welfare, in this research it was influenced by actors profit, whereas environment dimension focus on managing pulp and water efficiency, while coffee is produced by farmers, collectors and processor.
Production of green bean Production of
HS Production
of cherri
Demand of green bean Productivity
By product (pulp) Carrying capacity
Price of cherri Farmers profit Employee processor walfare Collectors profit Processor profit Price of green bean Compost production + + -+ + +
Price of HS
+ -+ + + + + -+ + + + + + + + +
Figure 3:Macro Forrester diagram
C. Stock flow diagram
The next step of SD technique was developing a stock flow diagram to capture interrelation among dimension or elements. The stock flow was translated using mathematical equations, which was solved by simulation. In this research stock flow has been developed via Powersim constructor (figure 4). Normally, the diagram was constructed using stock, flow, delay, converter and constants.
Symbolized elements were rectangles to stock, flow symbolized by valves, converter represented via circles were intermediate elements used for auxiliary structure, and constants represented by rhombuses were the model parameters. Stocks refer to the status of variables at a point/moment of time while flows exist during a period of time. Stocks are accumulated over time through inflows and outflows. Auxiliary variables are used to connect between stocks and flows as well as among themselves.
D. Model Validation
In system dynamic technique, after model has developed. Next step is to validate model, our research its have done by conceptual and
operational validity which refer to [41].
Conceptual validity used face validity technique,
namely ask to people knowledge (experts) about
the system whether the model and its behavior are
realistic, on the other handoperational validityused
mean absolute percentage errors (MAPE)
Technique. The objective this section was to assess the overall reliability of the model [42]. In statistical perfective, MAPE is a quantitative measure to find out how close the prediction outputs within actual data [43]. For instance, one of the out puts model is green bean price, the validation this part was done by compare between simulations outputs with real price on the same time. The formula of MAPE can be seen as follow:
MAPE= ∑||
x100% ...(1)
Where:
Xm is output simulation
Xd is actual data
n is numbers of data
[image:4.595.107.289.258.367.2]The reliable of model can be explained from MAPE, normally in to three categories, namely: very good (if MAPE<5%), moderate (if 5 %<MAPE<10%) and bad (if MAPE>10%). Validation is performed by green bean price of Gayo coffee which comprises between result simulations with the actual price (Table 1). The MAPE is 3.5, which mean the model can represent actual conditions. From conceptual model, several experts have given suggestion that the conceptual model accordance with the substances our research. On the other hand, the MAPE for green bean production is 4.95.
Table 1. Model validation
The parameter Actual Simulation MAPE (%) Farmers
Production volume*) 39.88 22.2 8.32 Collectors
Production volume*) 19.93 20.205 11.45 Processor
Green bean price+) Production volume*)
5.312.485 25.75 5.337.000 26.12 3.56 4.95 *) Rupiah/Ton, average from 2006-2013
+)
Rupiah, average from 2006-2013
4. RESULT AND DISCUSSION
A.Economic dimension
Based on the result of prediction model (Figure 5), we can see that there are significant increases in profit for farmers, collectors and processors. This is happened because the product sales prices for each
actor increase as well as the consumer demands,
376 equally to all of the actors, for instance the first tier, farmers, only get 20-30% of total profits, this is not proportionally compared to the processors who obtain about 2 – 3 times as high as the farmers. Even though some policies such as fair trade agreement, organic labeling and geographical indication protection have been implemented, those do not give significant contribution to farmers’ welfare in coffee producers [45].
Figure 5:ThePrediction of actor’s profit
B. Environmental Dimension
The environmental dimension in this research emphasized on the utilization of pulp of cherry (by product of the pulping process) which is composted as organic fertilizer by either farmers or collectors. Based on the result of prediction model (Figure 6), the number of pulp production of 30 Ha plantation areas in 2011 was approximately 20 tons, and then it increased to about 28 tons in 2012 before decreasing gradually to 24 tons in 2014. It can be predicted that this number will continue to grow to 50 tons in 2018.
The pattern for compost production is quite different from the pulp productions; it shows that the compost production rises gradually up to about 40 tons in 2018. The utilization of compost that produced by farmers gives significant economy advantages. [16] reported that 1 kg of an-organic fertilizers has the same fertilizing effect to the soil
as 12 kg of compost. Therefore,farmers are able to
minimize the production cost up to Rp. 109.350.000/ year (this prediction is calculated by assuming that 1 kg chemical fertilizer (non subsidy by government) is Rp. 9000/Kg.
C.Social dimension
Social dimension refers to actors’ skills in sustainable Gayo coffee supply chain due to its influence for risk management and production process.
Figure 6:The prediction of compost production
The focused skills in this research was number of training that experienced by all of actors, this trainings usually are conducted by technical institution such as non government organization, university, research and development institute, etc. Figure 7 shows that the skill score of actors will rise steadily by accumulating of theirs training from 2011 to 2018, it can be seen clearly that collectors will experience the highest score compared to farmers and managerial.
Figure 7:The Prediction of skills actors
C. Prediction of the sustainable supply chain for coffee Gayo
To assess the nature of its sustainability, the Multi Dimensional Scaling (MDS) analysis was undertaken to predict it in 2018. MDS was developed by Raled [46] which using the output of the system dynamics as an input of this software. Transformation process had to be conducted to change numeric data (output of system dynamics) to ordinal data by “if then rules” before data input
process in MDS software. Figure 8 illustrates the
result of the prediction, aggregate sustainability index of GCSC is 60.55, and this number is categorized as most sustainable. On the other hand, in 2011 the aggregate sustainability index of GCSC was 35.33 [15], which were less sustainable. Thus, it can be said that system dynamics that has been developed are able to improve the sustainability
level through some interventions on key
parameters.
100,000 200,000 300,000 400,000 500,000 600,000 700,000 800,000
2011 2012 2013 2014 2015 2016 2017 2018 Farmers (x000)
Collectors (x000) Processor (x0000)
30 40 50 60
Pulp (ton/years)
Compost (ton/years)
1.00 2.00 3.00 4.00
2011 2012 2013 2014 2015 2016 2017 2018 Farmers
[image:5.595.89.310.740.838.2]
Figure 8:The sustainability index GCSC on 2018
by Raled output.
5
.
CONCLUSIONWe presented the development of a dynamic of sustainable supply chain for Gayo coffee for improving the sustainability performance. The dynamic model is proven from the comprehensive description and analysis of the SGCSS systems operation taking into economic, social and environmental dimension. Economic dimension focused on actors’ profits, social dimension emphasized on the actors’ skills and environmental dimension concerned on the pulp utilization as compost.
Based on the economic dimension, in 2018 the actors’ profits will increase significantly due to the consumer demand and coffee productivity. From the social dimension, the actors’ skill will improve significantly as the effects of technical skills accumulation from training program that held by some institutions such as university, research institute and extension worker. In addition, the composting process from pulp can minimize the production cost and also provide added-value for famers.
The system dynamics model of sustainable supply chain for Gayo coffee that has been constructed can be used to increase the aggregation sustainability index significantly to be more sustainable.
REFRENCES:
[1] B.M. Beamon, “Supply chain design and
analysis: Models and methods”, International
Journal of Production Economics”, Vol. 55, no. 3, 1998 pp. 281-294.
[2] S.R.A. Ratan, A. Sekhari, M. Rahman, A.Z. Bouras, and Y. Ouzrouti, ” Sustainable Supply Chain Management: State of the Art”,
International Conference on Software, Knowledge, Information Management and Applications, Paro: Bhutan. 2010.
[3] B. Cetinkaya, Developing a Sustainable Supply
Chain Strategy, in C. Tyssen et al. (eds).
Sustainable Supply Chain Management.
Springer-Verlag Berlin Heidelberg, 2011. [4] B.Ageron, A. Gunasekaran, and A.Spalanzani,
“Sustainable supply management: an empirical
study”, Int. J. Production Economics, Article in
press, 2012.
[5] S. Seuring and S. Gold, ”Conducting content-analysis based literature reviews in supply chain
management”, Supply Chain Management: An
International Journal, vol. 17, no. 5, pp. 544-555, 2011.
[6] S. Seuring, “A review of modeling approaches for sustainable supply chain management”.
Decision Support Systems, Article in Press, 2010.
[7] P. Ahi and C. Searcy,” A comparative literature analysis of defenition for green and sustainable
supply chain management”, Journal of Cleaner
Production, Article in press, pp.1-13, 2013. [8] M.J. Hutchins and J.W. Sutherland, ”An
exploration of measures of social sustainability and their application to supply chain decisions”,
Journal of Cleaner Production, vol.16, pp.1688–1698, 2008.
[9] L.C.Giunipero, R.E. Hooker and D. Denslow,”
Purchasing and supply management
sustainability: Drivers and barriers”, Journal of
Purchasing & Supply Management, vol. 18, pp. 258–269, 2012.
[10] W.J.V. Vermeulen, M.T.J. Kok,” Government
interventions in sustainable supply chain governance: Experience in Dutch front-running cases”, Ecological Economics, Article in Press, 2012.
[11] A. Sharma, R. Gopalkrishnan, A. Mehrotra, and R. Krishnan, “Sustainability and business-to-Business marketing: a framework and
implications”, Industrial Marketing
Management, vol.39, pp. 330–341
,
2010. [12] B. Kaiser, P.D. Eagan and H. Shaner,“Solutions to health care waste: life-cycle
thinking and ‘‘green’’ purchasing”,
Environmental Health Perspectives, vol.109 no.3, pp.205–207, 2001.
[13] A.M. Fleury and B. Davies,” Sustainable supply chains—minerals and sustainable development, going beyond the mine”,
Resources Policy, vol. 37, pp. 175–178, 2012. [14] F.Teuteberg and D. Wittstruck,” A Systematic
Review of Sustainable Supply Chain
Management Research: What is there and
what is missing?”, MKWI, pp.1001-1015,
2010.
60.55 GOOD
BAD
UP
DOWN -60.00
-40.00 -20.00 0.00 20.00 40.00 60.00
0.00 50.00 100.00 150.00
Ot
h
er
Di
st
in
g
ish
in
g
F
ea
tu
re
s
[15] R. Jaya, Machfud, S. Raharja and Marimin, “Sustainability analysis for Gayo coffee
supply chain”, Int. Journal Advances on
Advanced Science, Engineering and Information Technology, vol. 3, no. 2, pp.
24-28, 2013.
[16] M. Adams and A.E. Ghaly, “Maximizing
sustainability of the costarican coffee
industry”, J. of Cleaner Production, vol. 15,
pp. 1716-1729, 2007.
[17] H.W. Ibrahim and S. Zailani, “A review on the competitiveness of global supply chain in
a coffee industry in Indonesia”, International
Business Management, vol. 4, no. 3, pp. 105-115, 2010.
[18] R. Jaya, Machfud and M. Ismail,
“Applications of ISM and ME-MCDM for stakeholder level position and determine of activities alternative for improvement Gayo
Coffee quality (ID)”, J. Teknologi Industri
Pertanian, vol. 21, no. 1, pp. 1-8, 2011. [19] E.S. Bernardes, “The effect of supply
management on aspects of social capital and the impact on performance: A social network
perspective”, Journal of Supply Chain
Management. vol. 46, no. 1, pp. 45-56, 2011. [20] K.H. Widodo, “Sustainable supply chain based
scenario for optimizing trade-off between Indonesian furniture and crude-palm oil
industries”. Operations and Supply Chain
Management, vol. 3, no.3, pp. 176-185, 2010. [21] S. Gupta and O.D. Palsule-Desai, “Sustainable
supply chain management: Review and
research opportunities”, IIMB Management
Review. Article in Press, 2011.
[22] S. Seuring and M. Muller,“From a literature review to a conceptual framework for
sustainable supply chain management”,
Journal of Cleaner Production, vol. 16, pp. 1699–1710, 2008.
[23] H. Walker and N. Jones, “Sustainable supply chain management across the UK private
sector”, Supply Chain Managament: An
International Journal, vol.17, no.1, pp.15-28, 2012.
[24] Z. Wu and M. Pagell, ” Balancing priorities: Decision-making in sustainable supply chain
management”. Journal of Operations
Management, vol. 29, pp. 577–590, 2011. [25] Z. Zailani. K. Jeyaraman, G. Vengadasan and
R. Premkumar, “Sustainable supply chain management (SSCM) in Malaysia: A Survey”.
Int. J. Production Economics, Article-inpress, 2012.
[26] S. Vachon and Z. Mao,” Linking supply chain strength to sustainable development: a
country-level analysis”, Journal of Cleaner
Production, vol. 16, pp. 1552–1560, 2008. [27] K. Liu and G.W. Price, ”Evaluation of three
composting system for the management of
spent coffee grounds”, Bioresource
Technology, vol.102, pp.7966-7974, 2011.
[28] M.R. Khadivi and S.M.T.F. Ghomi, ”Solid
waste facilities location using of analytical network process and data envelopment
analysis approaches”, Waste management,
Vol.32,pp.1258-1265, 2012.
[29] D. Vlachos, P. Georgiadis and E. Iakovou, “A system dynamics model for dynamic capacity planning of remanufacturing in closed-loop
supply chains”, Computers and Operations
Research, vol. 34, pp. 367–394, 2007. [30] G. Papachristos,” Transition inertia due to
competition in supply chains with
remanufacturing and recycling: A systems
dynamics model”, Environmental Innovation
and Societal Transitions, Article in Press, 2014.
[31] H. Min and W.P. Galle, “Green purchasing
strategies: trends and implications”,
International Journal of Purchasing and Materials Management, vol. 33 No. 3, pp. 10-17, 1997.
[32] S. Seuring, “A review of modeling approaches for sustainable supply chain management”.
Decision Support Systems, Article in Press, 2012.
[33] I. Giannoccarco and P. Pontrandolfo, ”Supply chain coordination by revenue sharing
contracts”, Int. J. Production Economic,
vol.89, pp.131-139, 2004.
[34] P.S. Murthy and M.M. Naidu, “Sustainable management of coffee industry by-products
and value addition—A review”, Resources,
Conservation and Recycling, Vol. 66, pp. 45– 58, 2012.
[35] F. Figge and T. Hahn,”Sustainable value added-measuring corporate contributions to
sustainability beyond eco-efficiency
,
Ecological economics, vol.48, pp.173-187, 2004.
[36] J.W. Forrester and P.M. Senge, “Tests for building confidence in system dynamics
models”, TIMS Studies in the Management
Sciences, vol. 14, pp. 209–28, 1980.
[37] C.F. Lee and C.P. Chung, ”An inventory model for deteriorating items in a supply chain
Procedia-Social and Behavioral Sciences, vol. 40, pp. 41–51, 2012.
[38] E. Teimoury, H. Nedaei, S. Ansari and M. Sabbaghi,” A multi-objective analysis for import quota policy making in a perishable fruit and vegetable supply chain: A system
dynamics approach”, Computers and
Electronics in Agriculture, vol. 93,pp. 37–45, 2013.
[39] M. Peng, Y. Peng and H. Chen,”Post-seismic supply chain risk management: A system dynamics disruption analysis approach for
inventory and logistics planning”, Computers
& Operations Research, vol. 42, pp. 14–24, 2014.
[40] Indonesian Statistical Board, Indonesia
statistical estate,
2011
.
[41] R. G. Sargent, “Validation and verification of
simulation models”. Proceedings of the
Winter Simulation Conference. Syracuse, NY 13244. USA, 1997.
[42] H. Lembito, K.B. Seminar, N. Kusnadi and Y. Arkeman, ” Designing a supply chain system dynamic model for palm oil agro-industries”,
International Journal of Information Technology and Business Management, vol. 12, no. 1, pp.1-8, 2012.
[43] R. Hyndman and A. Koehler,”Another look at measures of forecast accuracy”, International
Journal of Forecasting, vol. 22, no. 4, pp. 679–688, 2006.
[44] A. Mahta and J.P. Chavas,” Responding to the coffee crisis: What can we learn from price
dynamics?”, Journal of Development
Economics, vol. 85, pp. 282–311, 2008. [45] T.D. Beuchelt and M. Zeller,“Profits and
poverty: Certification's troubled link for Nicaragua's organic and fair-trade coffee
producers”, Ecological Economics, vol. 70,
pp.1316–1324, 2011.
[46] J. Alder, T.J. Pitcher, D. Preikshot, Kaschner, Feriss,”How good is good? a rapid appraisal technique for evaluation of the sustainability status of fisheries of the north atlantic”. In Pauly and Pitcher (Eds.) Methods for Evaluation the impacts of fisheries on the
north atlantic ecosystem. Fisheries Research
Report, vol. 8, no. 2, 2000.
[47] Suharjito and Marimin,”risks balancing model
of agri-supply chain using fuzzy risks utility
regression”, Journal of Theoretical and
Applied Information Technology, vol.41, no. 2,pp. 13-23, 2012.