3-D INTERFACE DESIGN OF THE VIRTUAL WORLD
IN E-LEARNING
BENS PARDAMEAN1, ALIF WIJAYAKUSUMAH2
1,2
Computer Science Graduate Program, Bina Nusantara University, Jakarta, Indonesia
1
Email: [email protected]
ABSTRACT
Digital applications in teaching and learning are becoming more essential. It is believed that an online learning system can significantly improve the quality of education since it transcends time and space, a desirable trait in today’s fast-paced and Internet-laden world. Nowadays, the 3D interface system used as a medium of online learning has further improved the 2D interface system. However, what kind of 3D interface system should be designed to increase students’ interaction and engagement with the system? This paper details a 3D interface design that can meet the demands of interactivity and engagement for the system. By applying the Qualitative-Interactive approach, data were collected through literature study and interviews with several experienced practitioners in the field of online learning. Based on the results of data analysis, it was concluded that there were two key features that should be included in the 3D interface design, namely avatar and environment. The presence of both features is expected to increase students’ interactivity and engagement within an online learning system. A prototype design was created to depict a more concrete picture on the benefits and the ease of 3D interface system usage, equipped with both avatar and environment features.
Keywords: E-Learning, 3D Environment, Avatar, 3D Virtual World, Learning Management System, Gesture Animation
1. INTRODUCTION
At an April 2007 symposium, Gartner states that by the end of 2011, 80% of active Internet users, including Fortune 500 companies, would have a virtual world. Permeation of the virtual world in almost all aspects of human life, such as business, entertainment, commercial, art, health, trade, and education can no longer be avoided. In fact, the use of virtual world technology in education has been embraced in recent years. 3D e-learning technology is now a blend of synchronous learning tools, web 2.0, social networking, and video games [1].
Virtual 3D technology is becoming increasingly popular and important in education because of its ability to create environments of 3D-displays that are more realistic, interesting, interactive, and meaningful. Virtual 3D and its interactivity are the main features that distinguish the 3D learning format from other virtual format types. Educational applications that combine virtual reality can enhance students’ interactivity and engagement [2]. 3D visualization format offers several advantages for
educational institutions, teachers, and also learners:
1. 3D can further explore places that cannot be reached in real life;
2. 3D can host the practice of teaching, learning, and discussing materials, even those with some degree of controversial topics, at a less (if not least) expensive cost and simpler method;
3. 3D virtualization offers a more realistic interactivity [1, 3, 4].
The virtual environment represents a collaborative system where components have more capabilities and more power than individually. The working context of virtual environment is built on four elements, namely connectivity, purpose, technology and separation. [10]
development and the virtual enterprise for production processes [11].
E-learning is a term, introduced along with the introduction of information and communication technology for educational purposes [13]. Definitions of e-learning are various, diverse and lack unity, consequently, it is of outmost importance to provide precise definitions of and the related notions. Hereby we are referring to the process of studying and teaching as e-learning when it includes information and communication technology, regardless of the mode or the scope of its use [14]. Kirschner and Paas [15] defined e-learning as a learning process in which Internet plays the key role in the presentation, support, management and assessment of learning.
Rosenberg [16] defines e-learning as a learning process in which information technology partially or fully undertakes the role of a mediator between different stakeholders involved in the learning process. We refer to the process of studying and teaching as e-learning when it includes information and communication technology, regardless of the mode or the scope of its use [14, 17]. E-learning extends the company out to ever-widening circles of impact [12].
CMS (Content Management System) can facilitate the delivery of learning resources, broadens the capacity for tracking and reporting of teaching & learning across an institution, simplify and automate administrative and supervisory tasks, and serve a useful function for institutional accreditation. Some of these systems are equipped with business intelligence tools to analyze data and create reports to facilitate curriculum governance and education delivery [18].
2. PROBLEM FORMULATION
Based on field observations and interviews, it was concluded that the public in general is still skeptical on the ability that distance learning program has in enhancing and increasing the knowledge and skills of the learners. This paradigm is caused by a long history of experiencing the use of a conventional face-to-face teaching system, the dominant role of the teacher, and the minimum application of an independent-learning culture. In order to change people’s perception, practical steps to convince
public on the efficiency and effectiveness of e-Learning courses in transferring knowledge had to be done.
Based on the current conditions mentioned above, two research questions were formulated for this study:
1. What kind of 3-Dimensional design is appropriate for the e-learning system? 2. What important features should be
available in a 3-Dimensional design?
3. METHODOLOGY
Qualitative-Interpretative methodology was conducted to answer the above problems and the following steps were taken. The research methodology of this study was the Qualitative-Interpretative approach. Qualitative approach is a process of deeply understanding the problem based on a holistic picture processed by words. It conveys the detailed information obtained from the consultants and conducted in a natural condition. This approach best suits the nature of this study because it is natural and involves natural subjects such as consultants, research subjects, and the researcher who objectively and naturally analyzes and interprets data obtained without any intervention.
The Qualitative-Interpretative approach must be delivered in a series of systematic research action as shown in figure 1. The initial step was the initiation of literature studies strategies, conducted via search engines, e-books and online journals. This step allowed for the garnering of a detailed and deep understanding on the theory design of a 3D interface in e-learning.
Literature studies included a study of the sources of materials related to the design of creating an online learning system.
After the literature studies, interviews were conducted to obtain detailed and in-depth information on current designs of 3D interface
along with their existing and essential features, leading to the formulation of an ideal 3D interface design. The interview with a few e-learning practitioners as consultants also served as a way to obtain evaluation and feedback on the 3D interface design designed in this study [6, 7].
[image:3.595.177.411.330.444.2]The data obtained were then analyzed using the descriptive methods and grounded theory [8]. Afterwards, the design was presented to consultants for evaluation using the principles of Technology Acceptance Model (TAM), which categorized the attitude factor of each user's behavior into two variables: ease of use and usefulness [9].
Figure 1. Research Methodology
4. RESULTS
After collecting and analyzing the data obtained, this study observed that there were two salient features in a 3D interface design which were environment and avatars. Both features were deemed effective in increasing the interactivity and engagement of learners towards the use of 3D interface design as e-learning medium.
E-learning is a sophisticated computerized learning issue that requires exploration from many points of views. It involves various domains, such as social, emotional, psychological, and other related areas. These can be represented in three platforms which are virtual classroom, game-based, and storytelling. Entertainment features represented by multimedia, avatars with graphics, and game activity [19].
As it has been mentioned, e-learning is not only an educational issue but also a complex experience that involves various domains [20]. Many e-learning systems still present insufficient information, forcing students to navigate too quickly to less text-based and more interactive sites [21]. Online learners today require more than mere information; they need to fill the gap missing in e-learning systems, an environment similar to that experienced in traditional learning, to interact with someone who could represent their teacher, to feel that they are in a classroom learning from other students, experiencing enjoyment during their learning, emotionally involved with the lesson and the instructor and learning from the teacher‘s facial expressions, gestures, hand movements and other activities that can convey the message [22].
games and this could be referred to as the enjoyment they are obtaining. Where mature learners are still not comfortable with this new medium, however, this might be due to their missing the element of interaction or to the developer paying less attention to this class of society [24].
Environment
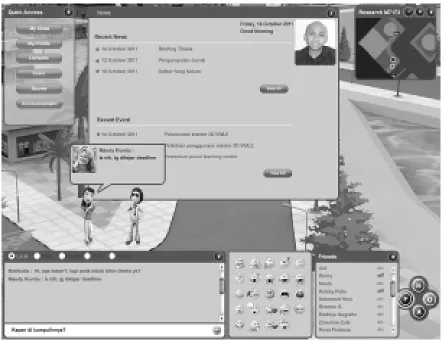
There was a classroom that functioned as a place of virtual learning, set in a circular seating arrangement. Figure 2 was a portrait of a virtual environment, after login, default view displays current news, and quick access menus, other than that there are two people communicating, and each communication (chat) is displayed in bubble along with the picture of the interlocutor.
The menu for chat was available below and above the screen environment. The media for communication was via text or chat, which consisted of five types:
1. Local, communication was only visible in a folder/room;
2. Party, communication was only visible to one particular group or in a group; 3. Friends, communication was visible
only to one person;
4. Room, communication was visible to everyone who is in the same room or location;
[image:4.595.86.530.336.678.2]5. Private, personal communication between participants.
Figure 2. Environment
This communication could not be seen by others, and was done by double-clicking other participants twice. Icons were an interactive
so forth. Menu icons could be run by clicking an icon and the character would automatically perform the movement in accordance with the selected icon.
A map on the top right of the screen could be activated or deactivated. Map was crucial in locating a place and detecting the presence of other participants.
The menu on the bottom right consisted of four
main menus: home, online, activities, and friends. Home was divided into a menu profile, forums, emails, blogs, groups, and settings. Online consisted of a list of people who were online in a folder. Activities (a list of user activity) showed such as subjects taken and their scores. Friends displayed a list of friends who are online or offline.
Avatar
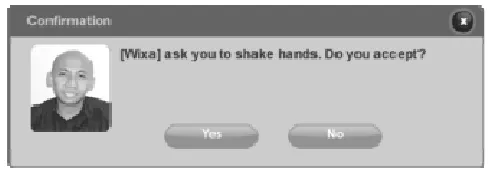
[image:5.595.175.419.318.404.2]Avatar created a more realistic interaction, such as shaking hands as it is shown in figure 3.
Figure 3. Handshake Request
Figure 3 constituted an invitation from a user to another user to shake hands. If "YES", then the user who initiated the invite would automatically walk towards the user who accepted the invitation.
Another factor that could increase interactivity was gesture animation feature. Users simply clicked the icon on the gesture animation menu or simply typed in the
corresponding command
column in the chat box.
Figure 4. Creating An Avatar
[image:6.595.87.512.530.746.2]The process of making the aforementioned fields is described in table 1 and table 2.
Table 1. Avatar Field Definition
Item Table Field Name Data Type Rule & Description Remark
Name
3D_user
user_
username Varchar Textbox, mandatory User name for login
Password user_password Varchar Textbox, mandatory User name for login
Gender user_gender Integer Radio button, mandatory 0 = male, 1= female
Type user_type Integer Dropdown list 0 = student, 1 = lecturer
Hair
3D_visual
visual_hair Integer Choice of hair
Changes automatically Appear in the avatar
Eyewear visual_eyewear Integer Choice of eyewear
Body visual_upperwear Integer Choice of upper wear
Bottom visual_
bottomwear Integer Choice of bottom wear
Two tables were required to execute the blue print shown in figure 4. First, the table of 3D_user contained the user data, such as username and password. Table 2 was the table of 3D_visual, containing data about the accessories chosen by the user, and specific data for special avatars, such as the avatar of the instructor. Please note that this is a sample table that will be
created in the
process of making an avatar. As for other supporting tables, they were not included into this paper.
[image:7.595.105.493.276.623.2]The explanation on the process of avatar creation and the process run by the buttons can be found in table 2.
Table 2. Avatar Process Definition
Item Name Process Remark
Button Rotate
Right Turning an avatar around 360o to the right
Seeing the look of an avatar from the side and back angle
Button Rotate Left Turning an avatar around 360o to the left
Button Submit When clicked, the selected avatar will be saved to the database
Button Random When clicked, the avatar will be randomly selected by the system
Button Cancel When clicked, it will cancel the selection
Button Eyewear Featuring 12 types of eyewear options
Button Body Featuring 12 types of upper wear options
Button Bottom Featuring 12 types of bottom wear options
Button Shoes Featuring 12 types of shoes options
Button Icon Showing direct model chosen on the avatar Icon eyewear, upper wear, bottom wear, shoes
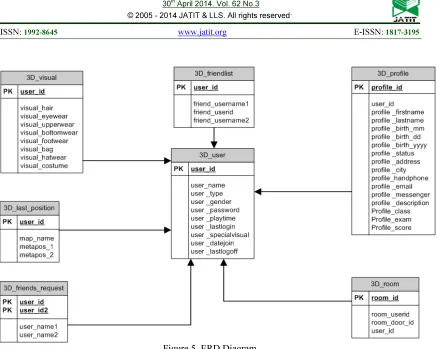
Figure 5 displays the entity relationship diagram (ERD) in which inter-relationship of the main tables is displayed. The tables include:
1. 3D_friendlist, containing friends list data;3D_last_position, containing the last position before the user logs off, so that the user can log back in to the last position;
2. 3D_friend_request, containing a list of
requests to be friends;
3. 3D_user, containing the user data; 4. 3D_visual, containing the accessories of
user data;
5. 3D_profile, containing complete data from each user;
Figure 5. ERD Diagram
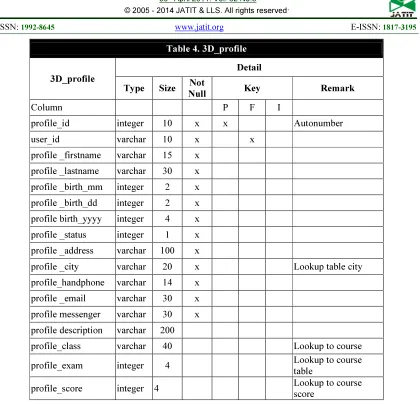
[image:8.595.118.485.492.740.2]Further explanation on properties for table 3D user is shown in table 3 and table 4. The tables include field name, data type, length of character, and other explanations.
Table 3. 3D_user
3D_user Detail
Type Size Not
Null Key Remark
Column P F I
user_id varchar 10 x x Student number
user _name varchar 30 x User login
user _type integer 5 x 0 = dosen, 1= mahasiswa
user _gender integer 1 x 0 = male, 1= female
user _password varchar 14 x Encripted
user _playtime integer 8
user _lastlogin datetime 0 x Default getdate()
user _specialvisual varchar 32 Special avatar special for
lecturer
user _datejoin datetime 0 x Default getdate()
Table 4. 3D_profile
3D_profile
Detail
Type Size Not
Null Key Remark
Column P F I
profile_id integer 10 x x Autonumber
user_id varchar 10 x x
profile _firstname varchar 15 x
profile _lastname varchar 30 x
profile _birth_mm integer 2 x
profile _birth_dd integer 2 x
profile birth_yyyy integer 4 x profile _status integer 1 x
profile _address varchar 100 x
profile _city varchar 20 x Lookup table city
profile_handphone varchar 14 x
profile _email varchar 30 x
profile messenger varchar 30 x
profile description varchar 200
profile_class varchar 40 Lookup to course
profile_exam integer 4 Lookup to course
table
profile_score integer 4 Lookup to course
score
The important role of avatar in the 3D virtual world application as a medium in e-learning could be seen clearly in the process of design making, starting from the drafting of the interface design to the field definitions to the field process to the database design. Multimedia is widely used in education, even for special needs. Research in Romania conducted by Nedelcut and Pop has proven the advantages of multimedia resources such as movies, audio and animation for keeping the student’s interest awake on its music educational system [25].
Designing the special instruction using interactive multimedia elements is not an easy task. Dellaporta stated that the designing task can be affected by both the look of graphical user interface (GUI) and the visual readability of the content. These multimedia elements were applied and there could be more potentials for different types of cartoon characters, graphics,
screen design, navigation button designs, voice over, sound effects, as well as animation. However, the researcher believes that the attention component can be improved by putting humorous elements such as humorous story content or humorous supporting cartoon characters [25].
5. CONCLUSION
interactivity and engagement of learners towards the 3D interface design as e-learning medium.
REFERENCES
[1] Kallonis, P., & Sampson, D., Implementing A 3D Virtual Classroom Simulation For Teachers’ Continuing Professional Development. Proceedings, 2010.
[2] Kapp, K., & O’Driscoll., T. Learning in 3D. San Francisco: Pfeiffer, 2010.
[3] Dickey, M., A Review of The Design Affordances And Constraints of Two 3D Virtual Worlds As Interactive Learning Environments. Interactive Learning Environment. Brave New (Interactive) Worlds, 2005.
[4] Schmeil., A., Knowledge Sharing And Collaborative Learning In Second Life: A Classification Of Virtual 3D Group Interaction Scripts. Journal of Universal Computer Science, 2008.
[5] Myers, K., A Set Of Principles For Conducting And Evaluating Interpretive Field Studies In Information Systems. MIS Quarterly, 1999, 23(1), pp. 67–94.
[6] Rivoltella, P., Digital Literacy: Tools and Methodologies for Information Society. New York: IGI Publishing, 2008.
[7] Ning, G., Williams, A., & Gul, L., Designing And Learning In 3D Virtual Worlds. International Conference on Cognition and Exploratory Learning in Digital Age, 2007.
[8] Strauss, A. & Corbin, J., Basics of Qualitative Research: Techniques and Procedures for Developing Grounded Theory, Sage Publications, Thousand Oaks, California, 1998.
[9] Davis, F., D., Perceived usefulness, perceived ease of use, and user acceptance of information technology. MIS Quarterly, 13(3), 319-339, 1989.
[10] Ciurea, C., & Pocatilu P., Designing M-Learning Applications for Collaborative Virtual Environments, International Journal of Education And Information Technologies, Issue 1, Volume 6, 2012.
[11] Ivan, I. & Ciurea C., Security of Collaborative Banking Systems, Proceedings of the 4th International Conference on Security for Information Technology and Communications, SECITC'11, November 17-18, 2011,
Bucharest, Romania, ISBN 978-606-505-493-6.
[12] Arh, T., Blažič, A. J., & Peternel, M.M., Practice Firms, E-learning and Web 2.0 Technologies as a Bases of SELPRAF Training Programme for Unemployed, International Journal of Education And Information Technologies, Issue 1, Volume 6, 2012.
[13] Arh, T., Kokalj, R., Dinevski, D. & Jerman-Blažič, B. (2008). Pregled stanja na področju e-izobraževanja v Sloveniji. Organizacija, 41(3), 155–167.
[14] Henry, P., E-learning technology, content and services. Education+Training, 43(4), 251–259, 2011.
[15] Kirchner, P. A. & Pass, F., Web enhanced higher education: a Tower of Babel. Computers in Human Behaviour, 17(4), 347–353, 2001.
[16] Rosenberg, M., E-Learning, Strategies for Developing Knowledge in the Digital Age. NewYork: McGraw-Hill, 2001.
[17] Dinevski, D. & Plenković, M., Modern University and e-learning. Media, culture and public relations, 2, 137−146, 2002 [18] Sat Sharma, Charles Conway, Keith
McConnell, Ira Ripstein, Bruce Martin, Aarti Paul, Ilana Simon, Jocelyn Advent, Carol Ann Northcott. Chuck Loewen, Dean Sandham, Use of Online Portal for Advanced Learning (OPAL) to enhance Medical Education, International Journal of Education And Information Technologies, Issue 1, Volume 6, 2012.
[19] Khaled Ayad , Dimitrios Rigas , Comparing virtual classroom, game-based learning and storytelling teachings in e-learning, Programme for Unemployed, International Journal of Education And Information Technologies, Issue 1, Volume 4, 2010.
[20] Z. Yan, H. Hao, L. Hobbs, and N. Wen, The Psychology of E-Learning: A Field of Study, Journal of Educational Computing Research, vol. 29, pp. 285-296, 2003. [21] D. Zhang, J. L. Zhao, L. Zhou, and J. F.
Nunamaker Jr, Can e-learning replace classroom learning?, Communications of the ACM, vol. 47, pp. 75-79, 2004.
[23] R. P. Githens, Older adults and e-learning: Opportunities and barriers, Quarterly Review of Distance Education, vol. 8, 2007. [24] M. Prensky, Digital natives, digital
immigrants, On the Horizon, vol. 9, pp. 1-6, 2001.