REPRESENTING TEXT DOCUMENTS IN TRAINING
DOCUMENT SPACES: A NOVEL MODEL FOR DOCUMENT
REPRESENTATION
1ASMAA MOUNTASSIR, 2HOUDA BENBRAHIM, 3ILHAM BERRADA
1,2,3
ALBIRONI Research Team, ENSIAS, Mohamed 5 University, Souissi, Rabat, Morocco
E-mail: [email protected] , [email protected] , [email protected]
ABSTRACT
In this paper, we propose a novel model for Document Representation in an attempt to address the problem of huge dimensionality and vector sparseness that are commonly faced in Text Classification tasks. The proposed model consists of representing text documents in the space of training documents at a first stage. Afterward, the generated vectors are projected in a new space where the number of dimensions corresponds to the number of categories. To evaluate the effectiveness of our model, we focus on a problem of binary classification. We conduct our experiments on Arabic and English data sets of Opinion Mining. We use as classifiers Support Vector Machines (SVM) and k-Nearest Neighbors (k-NN) which are known by their effectiveness in classical Text Classification tasks. We compare the performance of our model with that of the classical Vector Space Model (VSM) by the consideration of three evaluative criteria, namely dimensionality of the generated vectors, time (of learning and testing) taken by the classifiers, and classification results in terms of accuracy. Our experiments show that the effectiveness of our model (in comparison with the classical VSM) depends on the used classifier. Results yielded by k-NN when applying our model are better or as those obtained when applying the classical VSM. For SVM, results yielded when applying our model are in general, slightly lower than those obtained when using VSM. However, the gain in terms of time and dimensionality reduction is so promising since they are dramatically decreased by the application of our model.
Keywords: Document Representation, Text Classification, Opinion Mining, Machine Learning, Natural
Language Processing.
1. INTRODUCTION
With the increasing amount of available text documents in digital forms (either on the web or in databases), the need to automatically organize and classify these documents becomes more important and, at the same time, more challenging. We can find a wide range of domains in which we use Text Classification techniques. Among these domains
we find Categorization by Topic [27], Opinion
Mining [1], Recommendation Systems [15],
Question Answering [40] and Spam Detection [25]. Automated Text Classification (TC) is a supervised learning task that consists of assigning some pre-defined category labels to new documents (called test documents) on the basis of the likelihood suggested by labeled documents (called training documents). A growing number of machine learning methods are applied to this problem, including Naïve Bayes, Decision Trees, Support
Vector Machines, and k-Nearest Neighbors [31].
As text documents cannot be directly interpretable by such learning algorithms, we need to represent these documents by the use of the
Vector Space Model (VSM) [30]. VSM consists of
generating for each document its corresponding feature vector. Given a feature set, and for a given document, the generated vector gives to each feature its weight with respect to the document. Note that a feature weight used to measure how important is the feature regarding the document. At this stage, two issues are to be addressed. The first issue is how to build the feature set. The second issue is how to weight these features.
ISSN: 1992-8645 www.jatit.org E-ISSN: 1817-3195
Other works try to enrich the feature set by including other kinds of features such as parts of speech [20], semantic [12], syntactic [1], stylistic [1], and morphological [3] features.
Concerning the weighting issue, we can find various weighting schema, the most used ones are
presence and frequency-based weightings [17]. We
can also find the popular TF-IDF weighting (aka Term Frequency Inverse Document Frequency) and its different variants which are studied by Paltoglou & Thelwall [19].
The major problem that is faced when applying VSM on text documents is the huge dimensionality of the extracted features from training documents. Consequently, we may face the problem of vector sparseness. There are some attempts to overcome this problem by the application of several techniques to reduce, in a selective manner, dimensionality of features. Among these techniques, we find some standard ones such as
stemming [33], stop word removal [28] and
term-frequency thresholding [16]. We find also some
sophisticated techniques called Feature Selection algorithms, including Chi-Square, Information Gain
and Mutual Information [6][38].These techniques
seek to identify, among the native features, the most relevant ones to use them to generate feature vectors for text documents. Nevertheless, and even with the application of such techniques, the dimensionality remains strong especially when we deal with large data sets. Such huge dimensionality makes some classifiers intractable. Moreover, it makes classification tasks so expensive in terms of both memory and time. Note that even if we proceed to an aggressive feature reduction, it is more likely to face the problem of over-fitting. These issues are the main motivation behind the suggestion of a novel model to represent text documents differently.
The present paper has as major goal to remedy the problem related to the huge dimensionality of the generated vectors by VSM on the one hand, and the problem of vector sparseness on the other hand. We propose a novel two-stage model to represent text documents. The first step of this model consists of generating new vectors for documents by representing them in the space of training documents. The second step uses the norms of these generated vectors to project documents in a one-dimensional space. We evaluate our model by the
consideration of a problem of Opinion Mining [22]
which corresponds to a problem of binary classification where the aim is to classify opinionated documents as either positive or negative. We conduct our experiments on four
Arabic data sets and an English data set. These data sets are collections of comments or reviews written by mere internet users on the web. We use two standard classification algorithms known by their effectiveness in Text Classification, namely
Support Vector Machines [35] and k-Nearest
Neighbors [5]. We evaluate the proposed model by
comparing its effectiveness with that of the classical document representation based on VSM. The effectiveness is measured in terms of three criteria. The first criterion is related to the dimensionality of the generated vectors. The second one deals with the time taken by each classifier for learning and testing. The third criterion corresponds to the obtained results of classification in terms of accuracy. We specify that we focus, in this study, on reducing dimensionality and required time for classification rather than enhancing the performance of classification. In other words, we do not seek to primarily get better performance classification with regard to the use of the classical representation.
The remainder of this paper is organized as follows. In the second section, we describe the classical document preprocessing and representation. The third section gives more details about the proposed model. In the fourth section we present the data collection that we use. The fifth section describes our experiments as well as the obtained results. The last section concludes the paper and presents our future works.
2. CLASSICAL DOCUMENT
PREPROCESSING AND REPRESENTATION
Before we can use Machine Learning techniques to classify a set of text documents, it is necessary to first preprocess these documents and then map them onto a vector space. The first step is called document preprocessing. The second step is known as document representation. We give below more details about these two steps.
2.1 Classical Document Preprocessing
Document preprocessing consists of cleaning and normalizing text documents to prepare them to classification step. We present below some common tasks of preprocessing phase. We illustrate by some Arabic examples, rather than English ones, as the processing of this language is more complex than English.
• Tokenization: This task used to transform
by white spaces. This transformation includes also the removal of punctuation marks, numbers and special characters. We can tokenize a given text into either single words or phrases depending on the adopted model. The most common model is the bag-of-words which consists of splitting a given text into single words. We can also use the n-gram
word model [32]. As a definition, an n-gram word
is a sequence of n words in a given document. If n is equal to 1, we talk about unigrams, if it is equal to 2, they are called bigrams, and so on. For example, in the sentence «ﺎ ﻌﺋﺍﺭ ﻞﺴﻠﺴﻤﻟﺍﻥﺎﻛ ﺪﻘﻟ » (which can be translated as “the series was wonderful”), the unigrams that we can extract are « ﺪﻘﻟ », « ﻥﺎﻛ », « ﻞﺴﻠﺴﻤﻟﺍ » and « ﺎﻌﺋﺍﺭ » (for the translated sentence, the unigrams are respectively “the”, “series”, “was” and “wonderful”). The bigrams that we can find are « ﻥﺎﻛ ﺪﻘﻟ», « ﻞﺴﻠﺴﻤﻟﺍﻥﺎﻛ » and « ﺎ ﻌﺋﺍﺭ ﻞﺴﻠﺴﻤﻟﺍ » (for the translated sentence, the bigrams are respectively “the series”, “series was”, and “was wonderful”).
• Segmentation: This process is specific to
the Arabic language. It consists of separating a word from its clitics (i.e. proclitics and enclitics) and the determiner Al [2]. As a definition, clitics are a kind of affixes that can be attached to Arabic words; they can be prepositions, conjunctions, future markers, etc. As examples, the segmentation
of the attached word «
ﺢﺒﺼﻴﺳﻭ
» (which isequivalent in English to the phrase “and it will
become”) gives «
ﺢﺒﺼﻳ
» (i.e. it becomes), whilethe segmentation of the attached word «
ﻪﺒﺘﻛ
»(which is equivalent to the English phrase “he wrote it”) gives «
ﺐﺘﻛ
» (i.e. he wrote). The first example illustrates proclitic removal while the second one is a case of enclitic removal.• Stemming: Word stemming is a crude
pseudo-linguistic process which removes suffices to reduce words to their word stem [33]. For example, the words ‘classifier’, ‘classified’ and ‘classifying’ would all be reduced to the word stem ‘classify’. Consequently, the dimensionality of the feature space can be reduced by mapping morphologically similar words onto their word stem. A widely applied stemming algorithm is the suffix stripper developed by Porter [24]. In the Arabic language, there are two different morphological analysis techniques; namely stemming and light-stemming. While stemming reduces the word to its stem, light-stemming removes common affixes from the word
without reducing it to its stem [11]. If we apply
stemming on the words «
ﺏﺎﺘﻜﻟﺍ
» (the book), «ﺔﺒﺘﻜﻤﻟﺍ
» (the library) and «ﺐﺘﻜﻤﻟﺍ
» (the desk), wewill obtain the same stem «
ﺐﺘﻛ
» (to write).Nevertheless, the application of light-stemming on the words «
ﺐﺘﻜﻟﺍ
» (the books) and «ﻥﺎﺒﺘﻜﻣ
» (two desks) will give respectively «ﺏﺎﺘﻛ
» (a book) and«
ﺐﺘﻜﻣ
» (a desk). The main idea for using lightstemming [9][9] is that many word variants do not
have similar meanings or semantics although these word variants are generated from the same root.
• Stop Word Removal: Typically, stop
words refer to function words such as articles, prepositions, conjunctions, and pronouns, which provide structure in language rather than content [28]. Such words do not have an impact on category discrimination.
• Term Frequency Thresholding: This
process consists of eliminating words whose frequencies are either above a pre-specified upper threshold or below a pre-specified lower threshold. This process helps to enhance classification performance since terms that rarely appear in a document collection will have little discriminative
power and can be eliminated [34]. Likewise, high
frequency terms are assumed to be common and thus not to have discriminative power either. We specify that there is no theoretical rule to set the threshold; it is chosen empirically and hence its value depends on the experimental environment.
2.2 Classical Document Representation
The classical document representation consists of mapping each document onto a vector representation. These vectors are generated by the use of VSM. The retained terms (single words or phrases) after preprocessing are called features (or index terms). For a given document, its corresponding vector is obtained by computing the weight of each term with respect to that document.
ISSN: 1992-8645 www.jatit.org E-ISSN: 1817-3195
the task of Dimensionality Reduction which consists of several techniques. Besides the common methods (stemming, stop words removal and thresholding), there are several feature selection algorithms that compute the “goodness” of each feature in order to evaluate how significant it is. Thanks to these algorithms, we can perform aggressive dimensionality reduction without losing in classification effectiveness [38].
3. NOVEL MODEL FOR DOCUMENT
REPRESENTATION
As mentioned in the introduction, the main idea behind the proposed document representation model is to represent each text document by a vector in the space of training documents for each category. Consequently, each document has as many vectors as the number of categories. In the following, we give further details on the proposed model. For simplification, we consider a problem of binary-class text classification.
Our model consists first of splitting training set
D into two sub-sets D+ and D- which include
respectively positive and negative training documents. Given the feature set that we extract commonly from training documents, we aim to build for each feature its two vectors v+ and v- that might represent it in D+ and D- respectively. Note that the dimensionality of v+ corresponds to the number of positive training documents (i.e. cardinality of D+). It is the same for v-. For a feature f, its corresponding v+ is obtained as follows: the ith
component of v+ corresponds to the weight of f
with regard to the ith document of D+. This weight has as value 1 if f appears in that document; and 0 otherwise. Vector v- is obtained likewise. After building for all features their v+ and v-, we proceed to building for each document its corresponding V+
and V-. For a document d, we obtain its V+ by
summing vectors v+ that correspond to all features which appear in d. In other words, we consider just features that occur in d, then we sum their associated v+ vectors. The resulting vector is called
V+ and is associated to document d. We proceed
likewise to associate vector V- to document d. Note that this representation process is applied on both training and test documents.
This novel representation, which consists of
generating for each document its corresponding V+
and V-, helps to overcome the problem of huge
dimensionality since the number of training (positive and negative) documents is much lower than the number of extracted features from training documents. Yet, the generated vectors are
considerably less sparse than the common generated vectors in feature space.
As we can notice, for a document d (either
training or test), its corresponding V+ used to
represent d in the positive training document space.
V+ shows how many features are shared between
document d and each positive training document. Likewise, its corresponding V- used to represent d in the negative training document space. V- shows how many features are shared between document d and each negative training document. We give below the algorithm of the proposed model steps.
Input: Number of positive training documents n+ Number of negative training documents n Number of test documents M
Number of features N in training documents Positive training set D+ ={d+i} (i=1.. n
+
) Negative training set D- ={d-i} (i=1.. n-)
Test set T={ti} (i=1.. M)
Feature set F={fi} (i=1.. N) for eachfeature fЄF
v+(f)=(wf(d+1),…, wf(d+n+))
//wf(d+i)=1 if f appears in d+i, 0 otherwise
v-(f)= (wf(d-1),…, wf(d-n-))
//wf(d
-i)=1 if f appears in d
-i, 0 otherwise
end for
for eachdocument dЄD
V+(d)=
(
)
*
(
)
1 i
N
i i
d
v
f
∑
=+
δ
V-(d)=
(
)
*
(
)
1 i
N
i i
d
v
f
∑
=−
δ
//δi(d)=1 if fi appears in d, 0 otherwise
end for
for eachdocument dЄT
V+(d)=
(
)
*
(
)
1 i
N
i i
d
v
f
∑
=+
δ
V-(d)= 1
(
)
*
(
i)
N
i i
d
v
f
∑
=−
δ
//δi(d)=1 if fi appears in d, 0 otherwise end for
end algorithm
After that representation, we compute for each document (either training or test) the Lp norms of
its V+ and V- following the formula:
||X||p=
p p
i i
x
)
1/(
∑
of its V- reflects to what degree document d is similar to the negative training documents.
To each document d, we associate as score the ratio of ||V+(d)|| and ||V-(d)||. The objective is to represent all documents (training and test) in a one-dimensional space by their associated scores. Afterward, we can apply some classification algorithms such as Support Vector Machines and k-Nearest Neighbors together with the new representation model.
4. DATA COLLECTIONS
4.1 Arabic Data Sets
We use three Arabic data sets built, from Aljazeera’s website forums (www.aljazeera.net), by Mountassir et al. in [17][18]. We call these data sets
respectively DS1, DS2 and DS3. DS1 [18] consists
of 468 comments about movie reviews about one historical series. It contains 184 positive documents vs. 284 negative ones. DS2 [17] is a collection of 1003 comments about 18 sport issues. It consists of 486 positive documents vs. 517 negative ones. DS3 [18] is a collection of 611 comments about one political issue. It consists of 149 positive documents and 462 negative documents. These three data sets are labeled manually by one annotator. Note that DS1 and DS3 are unbalanced data sets. This problem is tackled in section 5.
We use also the Opinion Corpus for Arabic (OCA1) built by Rushdi-Saleh et al. [26]. It consists
of 500 movie-reviews collected from several Arabic blog sites and web pages. The distribution of documents is 250 positive documents vs. 250 negative ones. This data set is labeled automatically on the basis of rating systems.
4.2 English Data Sets
We use as English data set the polarity dataset v2.02 built by Pang and Lee [21]. It consists of 2000 movie-reviews collected from IMDb website (www.imdb.com). The distribution of documents is 1000 positive documents vs. 1000 negative ones. This data set is also labeled automatically on the basis of rating systems. In the following, we call this data set IMDB.
In Table 1, we summarize the language and the structure of the used data sets. We show for each data set the distribution of each class as well as the total number of documents.
1
http://sinai.ujaen.es/wiki/index.php/OCA_Corpus_%28Engli sh_version%29
2
http://www.cs.cornell.edu/people/pabo/movie-review-data/
Table 1: Structure Of The Studied Data Sets.
Language Data
Set POS NEG Total
Arabic
DS1 184 284 468
DS2 486 517 1003
DS3 149 462 611
OCA 250 250 500 English IMDB 1000 1000 2000
5. EXPERIMENTS
This section describes the experiments that we conduct to evaluate the performance of the proposed model. First, we present the experimental design by giving some details about data set processing (sampling and balancing methods), document pre-processing, parameter of our model, classification algorithms and the significance test that we use. Afterward, we present and discuss the different results.
5.1 Experimental Design 5.1.1 Data Set Sampling
We resample our data sets by randomly splitting them into two sets where 75% represent the training part and 25% represent the test part. This split is stratified with regard to both category and feature distribution. We repeat this split 25 times so as to generate 25 samples for each data set.
For each data set, we conduct the experiments on all its samples and we record the obtained result on each sample. The final result that we associate to the data set is obtained by averaging its samples’ results.
5.1.2 Data Set Balancing
As two of the studied data sets (DS1 and DS3) are unbalanced and as we use Support Vector Machines (SVM) and k-Nearest Neighbors (kNN) as classifiers, we have to equalize the class distribution of the unbalanced data sets. Indeed,
Mountassir et al. [18] study SVM and kNN in the
context of unbalanced data sets. They conclude that these two classifiers are sensitive to class imbalance and hence require balancing data sets to achieve the best results.
ISSN: 1992-8645 www.jatit.org E-ISSN: 1817-3195
We point out that this balancing is applied only on training sets for each data set; test sets are let as they are. Training sets need to be balanced in order not to bias classifiers’ learning. But test sets are not modified so as to test classifiers on sets representing the reality [18].
5.1.3 Preprocessing
The preprocessing of our data sets consists of removing from text documents all punctuation marks, special characters and numbers. As stemming process, we apply the stemmer of Khoja
and Garside [11] on the Arabic documents, and the
Porter stemmer3 [24] on the English documents.
We use, as weighting scheme, binary weights which are based on term presence. For the Arabic data sets, we remove, from feature space, terms that occur once in the data set. For the English data set, we remove from native features terms whose frequencies are less than or equal to 6. Recall that the English data set is much larger than the Arabic ones. We specify that these thresholds are chosen empirically so as to reduce the native dimensionality and at the same time to get better classification results. Indeed, and since our documents are written by mere internet users, this thresholding may help us to clean documents from, among others, typing errors made by these internet users. For all our data sets, we adopt the standard bag-of-words model. Finally, we note that we do not remove stop words.
5.1.4 Classification and Algorithms
The present study focuses on one-label binary classification where each document is assigned one of the two categories POSITIVE or NEGATIVE.
We use the data mining package Weka [37] to
perform our tasks of preprocessing and classification. The proposed representation is implemented within this toolkit. We use as classification algorithms Support Vector Machines (SVM) and k-Nearest Neighbor (k-NN). These algorithms are shown as effective for several Text Classification tasks [20][39]. For SVM classifier, we employ a normalized polynomial kernel with a
Sequential Minimum Optimization (SMO) [23].
Concerning k-NN classifier, we use a linear search. When applying the classical document representation, we use a cosine-based distance [29]. But when applying our model (i.e. the dimensionality is very small), we use the Euclidean distance. Among the tested odd values of k (which range from 1 to 31 in the present study), we choose those that allow achieving the best results. The
3
http://snowball.tartarus.org/algorithms/porter/stemmer.html
selected values are various depending on the data sets.
For the parameter p (degree of norm) of the proposed model, we test several values and find that the value that yields the best classification results for all the data sets corresponds to 2.
5.1.5 Statistically Significant Test
To compare between two algorithms, we use the paired t-test which is a widely used statistical test
within the Machine Learning community [4].
Assume that we have k samples for a given data set. Learning algorithms A and B are both trained on training set and the resulting classifiers are
tested on test set of each sample i. Let piA
(respectively piB) be the observed proportion of test
documents correctly classified by algorithm A (respectively B) on the sample i. If we assume the k differences pi = piA - piB are drawn independently
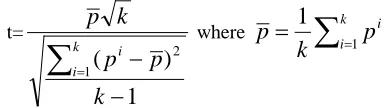
from a normal distribution, then we can apply Student’s t-test by computing the statistic [8]:
t=
1
)
(
1
2
−
−
∑
=k
p
p
k
p
k
i i
where
=
∑
k=i i
p
k
p
1
1
Under the null hypothesis (i.e. the two learning algorithms A and B have the same accuracy on the test set), this statistic has a t-distribution with k-1 degrees of freedom. For a two-sided test with probability of incorrectly rejecting the null hypothesis of 0.05, the null hypothesis can be rejected if |t|>tk-1,0.975. The value of tk-1,0.975 is
obtained from the t-table.
For our experiments, k=25. So, according to t-table, the null hypothesis is rejected when |t|>2.064.
5.2 Results
As mentioned in the introduction, we evaluate our model by comparing its effectiveness with the
classical document representation (which
[image:6.612.324.518.331.385.2]our representation corresponds to the number of training (positive and negative) documents.
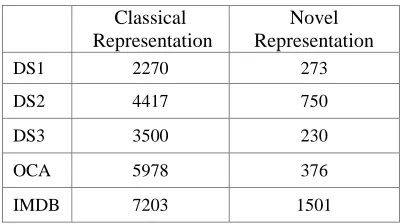
Our goal, by the consideration of this criterion, is to highlight the contribution of our representation to reduce the dimensionality of the generated vectors (even these vectors are not actually used in classification since they are projected in a one-dimensional space) without using some feature selection method. We also aim, by that table, to give an insight on the complexity related to each representation.
As we can see from Table 2, the rate of dimensionality reduction is considerable since it ranges from 6.3% (for OCA) to 20.8% (for IMDB). So, it is obvious that our representation is more effective than the classical one in terms of the first criterion related to dimensionality.
Table 2: Dimensionality Of The Generated Vectors By The Application Of Each Representation.
Classical Representation
Novel Representation
DS1 2270 273
DS2 4417 750
DS3 3500 230
OCA 5978 376
IMDB 7203 1501
The second criterion that we consider to evaluate our model corresponds to the time taken by each classification algorithm for learning and testing. In Table 3, we show for each classifier (SVM and k-NN), time (in terms of seconds) that it takes following the application of each representation on each data set. Our goal is to compare the required time by each classification algorithm when using each of the two representations. We specify that we use, for our experiments, a machine with 1.83GHz CPUs and 2GB of memory.
Table 3: Time Taken For Learning And Classification In Terms Of Seconds By Each Classifier By The Application
Of Each Representation.
Classical Representation
Novel Representation
SVM k-NN SVM k-NN
DS1 9 457 1.4 2.8
DS2 85 7325 0.5 12
DS3 12 846 0.4 2.9
OCA 80 4016 0.6 3.4
IMDB 3194 142023 1.5 58
It is clear from Table 3 that the application of our approach leads to a considerable time reduction for the two classifiers on all data sets. The rate of time reduction is so interesting since it can be up to 0.04% for SVM (on IMDB) and 0.04% for k-NN (on IMDB). So, and as a second conclusion, we can say that our representation model is highly effective in comparison with the classical method when considering the time taken by classifiers for learning and testing.
The third and last criterion that we take into account while comparing our representation model with the classical one concerns the classification accuracy. In Table 4, we report for each classifier the obtained classification result in terms of accuracy following the application of each representation on each data set. We also mention, for each result, the corresponding standard deviation since the reported result (in each cell) represents the average of results obtained on the 25 samples of each data set.
Table 4: Classification Results In Terms Of Accuracy For Each Classifier By The Application Of Each
Representation
Classical Representation
Novel Representation
SVM k-NN SVM k-NN
DS1
71.8 ± 4.2
62.89 ± 5.5
70.71 ± 5
71.9 ± 3.8
DS2
71.30 ± 2.8
67.34 ± 2.3
66.72 ± 3.4
66.67 ± 3.3
DS3
65.1 ± 4.4
62.18 ± 5.2
63.38 ± 5.2
60.24 ± 6.1
OCA
90.25 ± 2.3
85.87 ± 3.1
88.13 ± 3.1
87.17 ± 2.7
IMDB
85.49 ± 1.2
78.6 ± 1.4
81.38 ± 1.7
81.36 ±2
[image:7.612.94.298.323.435.2]ISSN: 1992-8645 www.jatit.org E-ISSN: 1817-3195
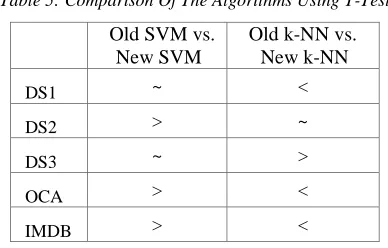
Table 5: Comparison Of The Algorithms Using T-Test
Old SVM vs. New SVM
Old k-NN vs. New k-NN
DS1 ~ <
DS2 > ~
DS3 ~ >
OCA > <
IMDB > <
The decision that we report can be ‘>’ (i.e. the first classifier is better than the second classifier), ‘<’ (the first classifier is worse than the second classifier) or ’~’ (the first classifier is the same as the second classifier).We specify that, in Table 5, we denote by Old SVM the application of the classical representation together with SVM, while New SVM refers to the application of the new representation model together with SVM. It is the same for Old and New k-NN.
As we can see from Table 5, the application of our representation leads, in general, to a slight degradation of the performance of SVM. Indeed, Table 5 shows that Old SVM outperforms New SVM in most of cases (on DS2, OCA and IMDB). Old SVM and New SVM have the same accuracy on DS1 and DS3. By referring to Table 4, we can see that this degradation in SVM performance ranges from 2.12% to 4.58M% in terms of accuracy. This can be understandable since SVM is known by its insensitivity to feature dimensionality. In other words, the performance of SVM is not affected whatever is the dimensionality of the used vectors. So, we can conclude that the application of our representation can lead to a slight loss of information while using SVM. Nevertheless, it is not the case with k-NN since Table 5 shows, typically, a competitiveness of Old k-NN and New k-NN. Indeed, New k-NN outperforms Old k-NN only on DS1, OCA and IMDB. But Old k-NN outperforms New k-NN only on DS3. The two classifiers have the same performance on DS2. So, we can say that we do not loose information by the application of our representation while using k-NN. On the contrary, we can improve the performance of k-NN with up to 9.01% of accuracy. As a conclusion concerning classification accuracy, we can say that the effectiveness of our model depends on the used classifier; it is clearly effective if we use k-NN, and slightly less effective if we use SVM.
As a summarized conclusion, we can say that our representation model is shown to be more
effective than the classical representation in terms of dimensionality reduction and time taken for learning and testing by the classifiers. However, the effectiveness of our model in terms of classification accuracy depends on the used classifier. When we use SVM, we can lose some information by the application of our method (in comparison with the classical representation); but when we use k-NN, we can improve the performance by the application of the proposed representation model.
6. CONCLUSION AND FUTURE WORKS
The study that we report in this paper has as goal to propose a novel model for Document Representation in an attempt to overcome the problems related to huge dimensionality and vector sparseness which are commonly faced in Text Classification problems. Instead of using vectors generated in feature space, we propose to represent text documents in the training document spaces. We focus, in this study, on reducing dimensionality and required time for classification rather than enhancing the performance of classification. We evaluate our model by comparing its effectiveness with the classical representation which corresponds to Vector Space Model. We consider, for this comparison, three criteria, namely the dimensionality of the generated vectors, the time required by classifiers for learning and testing, and classification result in terms of accuracy. We consider a problem of binary classification. We use bi-lingual Opinion Mining data sets (including four Arabic data sets and one English data set). We use as classification algorithms Support Vector Machines and k-Nearest Neighbors. We use the paired t-test to perform a statistically significant comparison between the used classifiers. Our results show that the proposed model outperforms dramatically the classical representation in terms of dimensionality reduction and time taken by the classifiers. However, by considering the criterion related to classification performance, we can say that the effectiveness of our model depends on the used classification algorithm. Indeed, when using Support Vector Machines, we can record a slight degradation of its performance by the application of our model. However, the performance of k-Nearest Neighbors can be significantly improved when we apply the proposed method.
Classification by Topic where there are many categories. We also seek to propose a novel classification method that fits more with the new representation and that can outperform the tested Support Vector Machines and k-Nearest Neighbors. Finally, we look forward to modifying the proposed approach so as to overcome the problem of unbalanced data sets which is commonly encountered in Text Classification problems.
REFRENCES:
[1] A. Abbasi, H. Chen, and A. Salem, “Sentiment
Analysis in Multiple Languages: Feature Selection for Opinion Classification in Web Forums,” In ACM Trans. Inf.Syst., 26,2008, pp.1–34.
[2] M. Abdul-Mageed, M. T. Diab, and M.
Korayem, “Subjectivity and Sentiment Analysis of Modern Standard Arabic,” in Proc. ACL 2011, Portland, Oregon, USA, 2011.
[3] M. Abdul-Mageed, S. Kuebler, and M. Diab,
“SAMAR: A System for Subjectivity and Sentiment Analysis of Social Media Arabic,” Proceedings of the 3rd Workshop on Computational Approaches to Subjectivity and Sentiment Analysis (WASSA), ICC Jeju, Republic of Korea, 2012.
[4] R. R. Bouckaert, “Choosing between two
learning algorithms based on calibrated tests,” In ICML’03, 2003.
[5] B. V. Dasarathy, “Nearest Neighbor (NN)
Norms: NN Pattern Classification Techniques,” McGraw-Hill Computer Science Series. Las Alamitos, California: IEEE Computer Society Press, 1991.
[6] M. Dash, and H. Liu, “Feature selection for
classification,” Intelligent Data Analysis 1(3), 1997.
[7] K. Dave, S. Lawrence, and D. M. Pennock,
“Mining the peanut gallery: Opinion extraction and semantic classification of product reviews,” In Proceedings of the 12th International Conference on the World Wide Web, 2003, pp.519-528.
[8] T. G. Dietterich, “Approximate statistical tests for comparing supervised classification learning algorithms,” Neural Computation, v.10 n.7, 1998, pp.1895-1923.
[9] R. Duwairi, M. Al-Refai, and N. Khasawneh,
“Stemming Versus Light Stemming as Feature Selection Techniques for Arabic Text
Categorization,” 4th Int. Conf. on Innovations in Information Technology IIT’07, 2007.
[10]A. Kehagias, V. Petridis, V. G. Kaburlasos,
and P. Fragkou, “A comparison of word and sense-based text categorization using several classification algorithms,” Journal of Intelligent Information Systems, Vol. 21, 2000, pp. 227-247.
[11]S. Khoja, and R. Garside, “Stemming Arabic
text,” Computer Science Department, Lancaster University, Lancaster, 1999.
[12]S.-M. Kim, and E. Hovy, “Determining the
sentiment of opinions,” In Proceedings of the 20th international conference on computational linguistics (COLING 2004), Geneva, Switzerland, 2004, pp.1367–1373.
[13]A. C. König, and E. Brill, “Reducing the
human overhead in text categorization,” In Proceedings of the 12th ACM SIGKDD conference on knowledge discovery and data mining, Philadelphia, Pennsylvania,USA, 2006, pp.598–603.
[14]D. D. Lewis, “Representation and Learning in
Information Retrieval,” Ph. D. thesis, Department of Computer and Information Science, University of Massachusetts, USA, 1992.
[15]Y. Li, J. Nie, Y. Zhang, B. Wang, B. Yan, and
F. Weng, “Contextual recommendation based on text mining,” In Proceedings of the 23rd International Conference on Computational Linguistics: Posters, 2010, pp.692–700.
[16]H. P. Luhn, “The Automatic Creation of
Literature Abstracts,” 1958,pp. 118–125.
[17]A. Mountassir, H. Benbrahim, and I. Berrada,
“A cross-study of Sentiment Classification on Arabic corpora,” In Research and Development in Intelligent Systems XXIX, M. Bramer and M. Petridis, Editors. 2012, Springer London, pp.259-272.
[18]A. Mountassir, H. Benbrahim, and I. Berrada,
“An empirical study to address the problem of Unbalanced Data Sets in Sentiment Classification,” In proc of IEEE International Conference on Systems, Man and Cybernetics (SMC’12), Seoul, Korea, 2012, pp.3280-3285.
[19]G. Paltoglou, and M. Thelwall, “A study of
Information Retrieal weighting schemes for
sentiment analysis,” In Proc. Of the 48th
ISSN: 1992-8645 www.jatit.org E-ISSN: 1817-3195
[20]B. Pang, L. Lee, and S. Vaithyanathain,
“Thumbs up? Sentiment classification using machine learning techniques,” In Proceedings of the Conference on Empirical Methods in Natural Language Processing, 2002, pp.79-86. [21]B. Pang, and L. Lee, “A sentimental education:
Sentiment analysis using subjectivity summarization based on minimum cuts,” In Proceedings of the 42nd Annual Meeting of the ACL, Barcelona, Spain, July. ACL’04, 2004.
[22]B. Pang, and L. Lee, “Opinion Mining and
Sentiment Analysis,” Now Publishers Inc, 2008.
[23]J. Platt, “Fast training on SVMs using
sequential minimal optimization,” In B. Scholkopf, C. Burges, and A. Smola (Ed.), Advances in Kernel Methods: Support Vector Learning, MIT Press, Cambridge, MA, 1999.
[24]M. F. Porter, “An algorithm for suffix
stripping,” Program 14(3), 1980, pp.130–137.
[25]M. Prilepok, T. Jezowicz, J. Platos, and V.
Snasel, “Spam detection using compression and PSO,” Computational Aspects of Social Networks (CASoN), 2012 Fourth International Conference on , 2012, pp.263-270.
[26]M. Rushdi-Saleh, M. T. Mrtin-Valdivia, L. A.
Urena-Lopez, and J. M. Perea-Ortega, “Bilingual Experiments with an Arabic-English Corpus for Opinion Mining,” In Proc. of Recent Advances in Natural Language Processing 2011, Hissar, Bulgaria.
[27]M. K. Saad, and W. Ashour, “Arabic
Morphological Tools for Text Mining,” 6th ArchEng Int. Symposiums, EEECS’10 the 6th Int. Symposium on Electrical and Electronics Engineering and Computer Science, European University of Lefke, Cyprus, 2010.
[28]M. Sahami, “Using Machine Learning to
Improve Information Access,” Ph. D. thesis, Department of Computer Science, Stanford University, 1998.
[29]G. Salton, and M. McGill, “Modern
Information Retrieval,” New York: McGraw-Hill, 1983.
[30]G. Salton, “Automatic Text Processing: The
Transformation, Analysis, and Retrieval of Information by Computer,” Reading, Pennsylvania: Addison-Wesley, 1989.
[31]F. Sebastiani, “Machine learning in automated
text categorization,” ACM Comput. Surv., Volume 34, Number 1, 2002.
[32]C. Shannon, “A mathematical theory of
communication,” Bell System Technical Journal, 27, Bell System Technical Journal, 1948.
[33]A. F. Smeaton, “Information retrieval: Still
butting heads with natural language processing,” In Information Extraction. International Summer School SCIE 1997, pp.115–139. Springer-Verlag.
[34]C. J. Van Rijsbergen, “Information Retrieval,” (2 ed.). London: Butterworths, 1979.
[35]V. Vapnik, “The Nature of Statistical
Learning,” Springer-Verlag, 1995.
[36]C. Whitelaw, N. Garg, and S. Argamon,
“Using appraisal groups for sentiment analysis,” In Proceedings of the 14th ACM Conference on Information and Knowledge Management, 2005, pp.625-631.
[37]I. H. Witten, and E. Frank, “Data Mining:
Practical machine learning tools and techniques,” 2nd Edition, Morgan Kaufmann, San Francisco, California, 2005.
[38]Y. Yang, and J. O. Pedersen, “A comparative
study on feature selection in text categorization,” In Proceedings of the Fourteenth International Conference, 1997.
[39]Y. Yang, “An evaluation of statistical
approaches to text categorization,” Inform. Retr. 1, 1–2, 1999.
[40]H. Yu, and V. Hatzivassiloglou, “Towards
answering opinion questions: Separating facts from opinions and identifying the polarity of opinion sentences,” in Proceedings of the Conference on Empirical Methods in Natural Language Processing (EMNLP), 2003.
[41]W. Zhang, T. Yoshida, and X. Tang, “Text