AN EXPERIMENT OF THICK FILM FORCE SENSOR USING
MEMS SIMULATION SOFTWARE
1M.H. CHONG, 2H.JAAFAR, 3W.Z.W.HASAN, 4S.SHAFIE, 5M.N.HAMIDUN, 6M.M. ISA, 7,1A.F. HAWARY
Student, 1Department of Electrical and Electronics Engineering, Faculty of Engineering, UPM Serdang, 43400 Selangor, MALAYSIA
Lecturer, 2Department of Electrical and Electronics Engineering, Faculty of Engineering, UPM Serdang, 43400 Selangor, MALAYSIA
Senior Lecturer, 3Department of Electrical and Electronics Engineering, Faculty of Engineering, UPM Serdang, 43400 Selangor, MALAYSIA
Senior Lecturer, 4Department of Electrical and Electronics Engineering, Faculty of Engineering, UPM Serdang, 43400 Selangor, MALAYSIA
Assoc Prof, 5Functional Devices Laboratory, Institute of Advanced Technology, UPM Serdang, 43400 Selangor, MALAYSIA
Senior Lecturer, 6Department of Electrical and Electronics Engineering, Faculty of Engineering, UPM Serdang, 43400 Selangor, MALAYSIA
Lecturer, 7School of Mechanical Engineering, USM Nibong Tebal Penang, 14300 Selangor, MALAYSIA
E-mail: [email protected], [email protected], [email protected],
4[email protected], 5[email protected], 6[email protected], 7[email protected]
ABSTRACT
Force sensor (or pressure sensor) has gained increasing interest among the researchers. Using the Microelectromechanical Systems or MEMS technology, the size of the force sensor can be miniaturized and this ignites more possible application in the field of biomedical and robotic applications. Recent researches show the application of force sensor on the prosthetic hand, an artificial limb connected to an amputated person. This paper presents on simulating the sensitivity of the thick film force sensor using IntelliSuite software. The force sensor is realized by using the piezoresistive material on the cantilever structure.There are three force sensor designs are simulated. Two of the designs are simulated using glass as substrate, and while the remaining one is of alumina substrate. The sensitivity simulated is much smaller compared to the estimations made using equations. The simulations show that the glass sensor fares better than the alumina sensor. If the substrate is the same, the sensor with the bigger dimension has better sensitivity.
Keywords: MEMS, Force Sensor, Intellisuite, Piezoresistors, Piezoresistive Coefficient
1. INTRODUCTION
Miniature force sensor isa popular topicin the Microelectromechanical Systems (MEMS). The miniaturisation of the size of the force sensorallows applicationssuch as in robotic prosthetics hand [1]-[2], fuel-cell performance diagnosis [3] and in the field of medical [4]-[5].A miniature force sensor can be classified as microelectromechanical system (MEMS) since the device is small and its operation involves both electrical and mechanical principlesthat makes prototyping very difficult. Therefore, the software has been developed to allow the design and simulation of MEMS device
to be made prior to fabrication. Examples of such software are ANSYS, CAEMEMS and IntelliSuite [5]-[7].
substrate via simulation approach using the IntelliSuite simulation software.
Previous research on the application of static force sensor in the prosthetic hand application showed the sensitivity of about 150μV per 1N applied [1].Low voltage is hard to be detected by measurement equipment such as voltmeter unless the equipment is of very high quality. Besides that, low output voltage would also susceptible to background noise which will affect the measurement of the voltage.This research aims to find out whether using glass substrate with low Young’s modulus could improve the sensitivity of the device at the expense of lower sustainable forces of the sensor.
There are various kind of tactile sensing technology, such as strain gauge, capacitive, piezoresistive, and optical force sensors [8]. A piezoresistive force sensor can beconstructed using piezoresistors on a cantilever which arearrangedin a Wheatstone bridge configuration. A piezoresistive material changes its resistivity when its structure undergoes deformation. A force exerted on the sensor will temporary bend the piezoresistive material of the cantilever. The change in resistance is proportional to the amount of force being exerted. An input voltage passed along the resistive materials could detect the change in resistance by measuring its final output voltage. The advantage of a Wheatstone bridge configuration is that it can compensate the temperature effect (piezoresistors are temperature sensitive) by changing all the resistance in the bridge with the same percentage [9].
This paper is mainly about simulating the resistivity performance of threestatic force sensors using piezoresistive materials, two made of glass substrate, another of alumina substrate. The simulation is carried outusing IntelliSuite software. The design of the force sensorsare based on the static force sensor design by Cranny et al. [1], but the substrate material and the dimensions of the device are altered.This research intends to find out how the sizing of the sensor affects sensitivity. Besides that, this research also intends to find out what would be the sensitivity achievable by using glass substrate.The sensitivity refers to the amount of output voltage change per unit Newton. Even though glass substrate is not very feasible in thick film device due to the low melting point, however glass has low Young’s modulus, which is supposed to give better sensitivity. Thus, this paper
contributes in terms of methodology where some researches may use different method, design, simulation, specification, process technology and even different materials. The simulation carried out and conclusion made on how sizing affect the sensitivity needed to improve the implementation of current practice and to speed up improvements in the device performances, mainly the sensitivity.
2. MODELLING OF CANTILEVER FORCE
SENSOR
The piezoresistive effect allows a thick-film resistor to change its resistance proportional to the strain experienced. Such resistor is said to exhibits a gauge factor, G, which is defined as the unit change in resistance per unit of strain applied. The gauge factor of the thick film resistor is given by the equation [1]:
The represents the change in resistance
value, while and represents the original resistance value and the strain experienced respectively.
The Vout represents the output voltage,G is the gauge factor of the piezoresistors, E is the Young’s modulus of the substrate. The output of the force sensor can be measured by probing a multimeter between V+ and V-.For more details on the static force sensor modeling, one can refers to the paper done by Cranny et al. [1].
Assume thatESL 3414 paste (G=14) is used for the piezoresistors,when alumina (E=415 GPa) is used as the substrate, the force measurement sensitivity attainable for Size Bsensor according to equation (2)will be about 37μVV-1N-1. If aninput
voltage of is supplied, the
measurement sensitivity will be about 185μVN-1.
Similarly, when pyrex glass (E=55 GPa) is used, the theoretical force measurement sensitivity attainable for both Size A and Size B sensors is about 280μVV-1N-1. If an input voltage of
3. METHODOLOGY
3D Builder
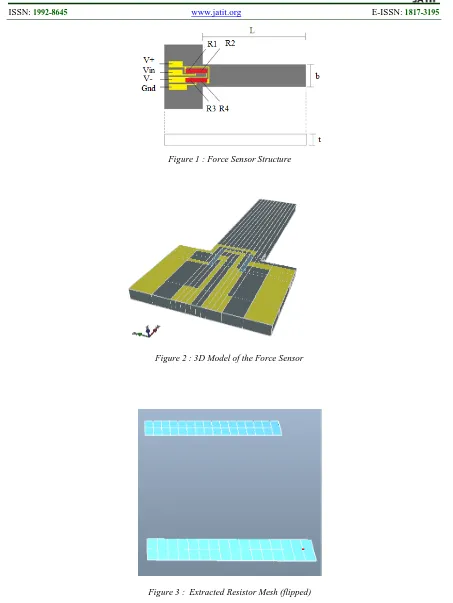
The force sensor model was drawn using the 3D Builder module of the IntelliSuite. The level 0 is drawn with the cantilever structure which represent the substrate, while level 1 and level 2 is drawn for the interconnect material and the piezoresistors respectively. Each piezoresistor size is 2mm0.5mm for Size A and 4mm1mm for Size B. After the drawings are validated that there is no overlapping and illegal elements, the design is exported to analysis module. The height of level 0 is modified to be 3mm. Assume that ESL 9912-K FL (silver base) is used for the interconnect and ESL 3414 is used for the piezoresistor, the height of level 2 and level 3 is set to 12.5μm and 11μm respectively.
ThermoElectroMechanical (TEM) Analysis
The 3D model is as shown in the Figure 2. The faces pointed by the red arrows are set as fixed boundary, while the faces pointed by the green arrows are set as
XY-fixed boundary. This is to limit the movement of the cantilever to be in the z-direction only during the analysis. Next, the pyrex glass parameters is imported to entity 1. Since parameters of silver is not available in the TEM library, the parameters of entity 2 is edited manually to match that of the silver’s. The resistivity of the TEM is set in volume resistivity (Ω-cm), but the datasheet of the thick film paste only mention sheet resistivity (Ω/ ). The sheet resistivity, , is given by the equation below[10]:
Similarly, the volume resistivity, , is:
where R is the resistance, W is the width, t is the thickness and L is the length of the resistor.
Thus, the volume resistivity can be calculated based on the thickness and sheet resistivity using equation:
As for the entity 3, which is the piezoresistor, only the volume resistivity was edited with other parameters left as default. The default parameters for the entity in TEM module is silicon bulk.
Next, the entity 3 in defined as the piezoresistor by setting the piezoresistive coefficients
and . Since only gauge factor is mentioned in the datasheet for the ESL 3414 series, the piezocoefficients are set using estimation. The piezoresistors lie on the same axis with the cantilever, with is in the <111> direction [11]. According to Chang Liu [9], the longitudinal gauge factor can be found by multiplying the Young’s
modulus with . Since it is a linear
equation, each piezoresistive coefficient can be estimated using equation
The is the longitudinal gauge factor of the ESL 3414, is the gauge factor for a p-type silicon which is about 115, is the original piezoresistive coefficient, and is the current piezoresistive coefficient estimated for the ESL3414.
The mesh resistor is extracted and temperature load of 27oC correspond to the room temperature on equator is defined onto the resistors. The auto-mesh function is used to further display the resistors in the smaller mesh. Next, the resistor is flipped as shown in Figure 3. A voltage load of 5V is defined onto the node Band 0V load is defined onto the node E pointed by the red arrows. Negative current loads are defined onto nodes A and C while positive current loads onto nodes D and F.
Static analysis is performed and the resultant potentials at node A, C, D and F are tabulated as VR2, VR1, VR4 and VR3 respectively. An example of the resultant potential is shown in Figure 4. The circled part of the “Messages” window is the node potential at VR4.
after the pressure load is placed as shown in Figure 5.
All current loads are of the same value which is 72.2μA. Static analysis is performed and the resultant potentials at node A, C, D and F are tabulated as VR2, VR1, VR4 and VR3 respectively. The following equations are used to calculate the output.
After finish analyzing for the pyrex glass design, the alumina Al2O3 parameters is imported for the
entity 1and the same procedure is repeated to obtain the data for the alumina design.
4. RESULTS AND DISCUSSION
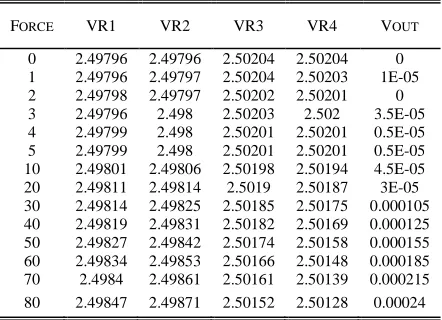
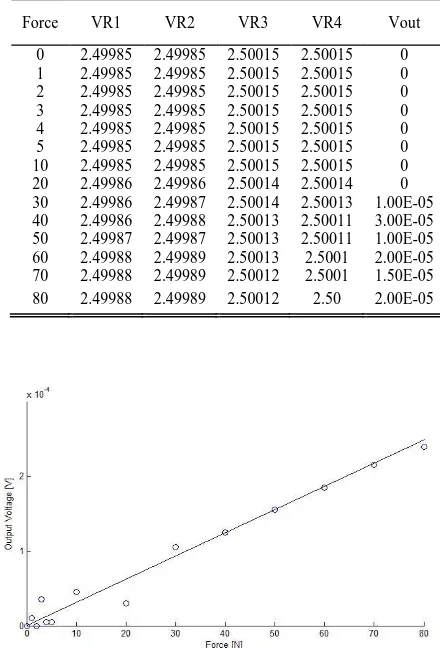
[image:4.612.100.269.199.281.2]The simulation results for the Size A glass substrate force sensor is tabulated in Table I and its graph is plotted as shown in Figure 6, while for Size B glass substrate force sensor, the results are tabulated in Table II and plotted as in Figure 7. Similarly, the alumina force sensor simulation result is shown in Table II and its graph is shown in Figure 8.
The simulated sensitivity is very small compared with the estimated value calculated using equation 2. For the Size A glass based sensor, the sensitivity obtained is just 3.1μVN-1 as opposed to 1.4mVN-1. Meanwhile, the Size B glass sensor has the sensitivity of about 4.3μVN-1. The bigger sizing gives better sensitivity possibly because it has longer piezoresistors. (On the other hand) Shorter resistor gives lower gauge factor [10]. Moreover, its length to thickness ratio is also greater.
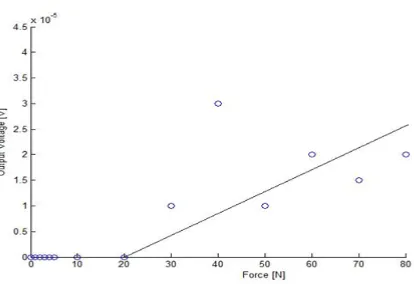
As for the alumina based sensor, the simulation cannot detect any applied forces less than 20N. The response is not entirely linear and the sensitivity is also too low as compared with the theoretical sensitivity calculated using equation (2), with sensitivity of about 4.3μVN-1.
Cranny’s research [1] reported that the actual fabricated model has sensitivity of about 8 times
lower than the calculated value using equation (2). However, the simulation results in this report showed not as good as reported. This means the simulations obtained for the thick film piezoresistive force sensor obtained is inaccurate (This means the result obtained from this simulations is considerably inaccurate). One possible cause of the incorrect result is possibly because the methodology is not properly formulated. The parameters for entity 3 during the TEM analysis are just assumed to be p-type silicon where as the real composition of the piezoresistive paste is not taken into consideration. The TEM module also lacked the selection of thick film material in its library of material parameters.
5. CONCLUSION
The simulations for both the glass and alumina force sensors showed very low sensitivity. It is observed that the performance using alumina substrate is much worse than the glass substrate design in term of the sensitivity.However, for the same substrate material,the sensitivity is much better when using bigger sizes.
All the above results are observed within the capability of IntelliSuite software. It is developed to simulate the performance of thick film MEMS devices.The simulation results at this point is yet to find the convincing result for a thick film device may not be accurate. Future research is proposed to fabricate out the force sensors so that experiment can be done to compare the actual sensitivity with the simulated result.
6. ACKNOWLEDGEMENTS
The authors wish to thank Universiti Putra Malaysia for providing the IntelliSuite software and other facilities for this research.
REFRENCES:
[1] A. Cranny, D. P. J. Cotton, P. H. Chappell, S. P. Beeby, and N. M.White, Thick-film force, slip and temperature sensors for a prosthetic hand, Meas. Sci. Technol., vol. 16,:1–11, 2005 [2] D. P. J. Cotton, P. H. Chappell, A. Cranny, N.
M.White, and S. P. Beeby, A Novel Thick-Film Piezoelectric Slip Sensor for aProsthetic Hand, IEEE Sensors Journal, Vol. 7(No.5):752-761, May 2007
sensors, International Journal of Hydrogen Energy, vol.37:4448-4456, 2012
[4] N.Maalej, and J.G. Webster, A miniature electrooptical force transducer,Biomedical Engineering, IEEE Transactions on , vol.35(no.2):pp.93-98, Feb. 1988
[5] K.R. Lin, C.H. Chang, T.H Liu, S.W. Lin, and C.H. Lin, Experimental and numerical estimations into the force distribution on an occlusal surface utilizing a flexible force sensor array, Journal of Biomechanics, vol.44:1879-1884, 2011
[6] S. Crary, Y. Zhang, CAEMEMS: an integrated computer-aided engineering workbench for micro-electro-mechanical systems, Micro
Electro Mechanical Systems, 1990.
Proceedings, An Investigation of Micro Structures, Sensors, Actuators, Machines and Robots. IEEE , no., pp.113-114, 11-14 Feb 1990
[7] S.Chowdhury, G.A. Jullien, M.A. Ahmadi, W.C. Miller,A MEMS micromagnetic actuator for use in a bionic interface,Circuits and Systems, 2000. Proceedings. ISCAS 2000 Geneva. The 2000 IEEE International Symposium on , vol.5:181-18, 2000
[8] M. Fässler, Force Sensing Technologies,
Studies on Mechatronics, Autonomous System Lab, Swiss Federal Institute of Technology Zurich, 2010
[9] Chang Liu,Foundation of MEMS, (Illinois Ece Series, 2006, p.p207-245)
[10]C. Song, D.V. Kerns, Jr., J.L. Davidson,
Measurement of Metal Migration on Thick-film Piezoresistors and Their Terminations, Southeastcon '91., IEEE Proceedings of, vol.2, pp.1110-1112, 7-10 Apr 1991
[11]O.B. Wright, N. Nishiguchi, Vibrational dynamics of force microscopy: Effect of tip dimensions, Applied Physics Letters, vol.71, no.5, pp.626-628, Aug 1997
Figure 1 : Force Sensor Structure
Figure 2 : 3D Model of the Force Sensor
[image:6.612.218.404.475.644.2]Figure 4 : Example of Static Analysis Result (glass size A at 10N)
Figure 5 : Resultant z-Displacement of The Force Sensor (glass size A at 10N)
Table 1 : Simulation Results for Size A Glass Force Sensor
FORCE VR1 VR2 VR3 VR4 VOUT
0 2.49796 2.49796 2.50204 2.50204 0 1 2.49796 2.49797 2.50204 2.50203 1E-05 2 2.49798 2.49797 2.50202 2.50201 0 3 2.49796 2.498 2.50203 2.502 3.5E-05 4 2.49799 2.498 2.50201 2.50201 0.5E-05 5 2.49799 2.498 2.50201 2.50201 0.5E-05 10 2.49801 2.49806 2.50198 2.50194 4.5E-05 20 2.49811 2.49814 2.5019 2.50187 3E-05 30 2.49814 2.49825 2.50185 2.50175 0.000105 40 2.49819 2.49831 2.50182 2.50169 0.000125 50 2.49827 2.49842 2.50174 2.50158 0.000155 60 2.49834 2.49853 2.50166 2.50148 0.000185 70 2.4984 2.49861 2.50161 2.50139 0.000215 80 2.49847 2.49871 2.50152 2.50128 0.00024
[image:7.612.196.417.537.697.2]Table 2 : Simulation Results for Size B Glass Force Sensor
Force VR1 VR2 VR3 VR4 Vout
[image:8.612.192.412.330.654.2]0 2.49985 2.49985 2.50015 2.50015 0 1 2.49985 2.49986 2.50015 2.50014 1.00E-05 2 2.49986 2.49986 2.50014 2.50014 0 3 2.50018 2.49987 2.50014 2.50013 -1.50E-04 4 2.49986 2.49988 2.50014 2.50011 2.50E-05 5 2.49987 2.49987 2.50013 2.50012 0.50E-05 10 2.49987 2.4999 2.50012 2.50007 0.50E-04 20 2.4999 2.49995 2.50009 2.49999 0.75E-04 30 2.49993 2.5 2.50005 2.49992 1.00E-04 40 2.49997 2.50021 2.50001 2.49984 2.05E-04 50 2.49999 2.50028 2.49998 2.49977 2.50E-04 60 2.50002 2.50035 2.49995 2.49969 2.95E-04 70 2.50005 2.50039 2.4999 2.49961 3.15E-04 80 2.50032 2.50103 2.49952 2.49874 7.45E-04
Table 3 : Simulation Results for Size B Alumina Force Sensor
Force VR1 VR2 VR3 VR4 Vout
[image:8.612.198.415.330.492.2]0 2.49985 2.49985 2.50015 2.50015 0 1 2.49985 2.49985 2.50015 2.50015 0 2 2.49985 2.49985 2.50015 2.50015 0 3 2.49985 2.49985 2.50015 2.50015 0 4 2.49985 2.49985 2.50015 2.50015 0 5 2.49985 2.49985 2.50015 2.50015 0 10 2.49985 2.49985 2.50015 2.50015 0 20 2.49986 2.49986 2.50014 2.50014 0 30 2.49986 2.49987 2.50014 2.50013 1.00E-05 40 2.49986 2.49988 2.50013 2.50011 3.00E-05 50 2.49987 2.49987 2.50013 2.50011 1.00E-05 60 2.49988 2.49989 2.50013 2.5001 2.00E-05 70 2.49988 2.49989 2.50012 2.5001 1.50E-05 80 2.49988 2.49989 2.50012 2.50 2.00E-05
Figure 7 : Output Voltage Versus Force for Size B Glass Based Force Sensor
[image:9.612.197.404.324.466.2]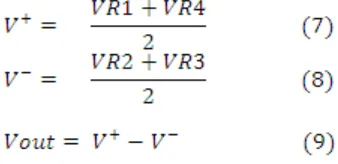
![Assessment of Physiological Health Status in Relations to Different Anthropometric and Cardio respiratory Measures of Head Supported Load Carrying Male Porters of Sikkim, India [Article Retracted]](data:image/gif;base64,R0lGODlhAQABAIAAAP///wAAACH5BAEAAAAALAAAAAABAAEAAAICRAEAOw==)