Munich Personal RePEc Archive
The Comparison of the Recent Crises in
Turkey in terms of Output Gap
Goksel, Turkmen and Ozturkler, Harun
June 2012
Online at
https://mpra.ub.uni-muenchen.de/40806/
The Comparison of the Recent Crises in Turkey in terms of Output Gap
Abstract
The importance of output gap and its timely measure come from the fact that it can serve as a guide to
macroeconomic policy design. The knowledge of the position of an economy in a cycle is invaluable
information and it has an important role in formulation of monetary, fiscal, and income policies. In
this paper, we measure potential GDP and output gap for the Turkish Economy for the period between
1998Q1 and 2011Q4, using production function approach. We analyze the crises and the boom periods
in terms of output gap. We find that according to the length of downturn and recovery periods, the
worst crisis is the 2001. However, when we compare the crises according to the magnitude, the biggest
collapse occurs during 2008 crisis. After recovering from 2008 crisis, once again the actual real GDP
remains higher than the potential GDP for 5 successive quarters. Moreover, in this period actual real
GDP is back on its old trend suggesting that the recovery period is over for Turkey and the negative
effects of 2008 global crisis are not permanent.
Keywords: Crises, Output gap, Potential GDP, Production function approach, Turkey
JEL codes: E32, E66
1. Introduction
The importance of output gap and its timely measure come from the fact that it can serve as a
guide to macroeconomic policy design. This is because, as Buahari and Khan (2008) argue,
output gap estimates can signal cyclical position of the economy by providing information on
inflationary or contractionary pressures. The knowledge of the position of an economy in the
cycle is an invaluable information based on which a counter cyclical economy policy can be
formulated. Therefore, the output gap is considered to be a key indicator of future economic
Potential output is the level of activity that the economy can sustain, given the quantity and
quality of its factors of production and technology. As reported by Gerlach (2011), The
Economist used the term potential for the first time in 1911 and the term output gap for the
first time in 1964. The output gap is simply the difference between actual output and potential
output. However, there are many different definitions, emphasizing different aspects and
phases of the deviations of actual output from potential output. Given its importance, the
output gap has been the focus of considerable research effort in the economics literature. The
center of attention in this research effort was on various techniques for estimating potential
output. A better measure of potential output will help to eliminate significant uncertainties
associated with output gap. Different sets of assumptions can be used in combination with
various econometric techniques to provide different measures of the output gap. There are
four main approaches to the measurement of potential output, and therefore, the output gap:
i) univariate non-structural approach, studying univariate properties of real GDP; some
examples are peak to peak method, linear trending, Hodrick-Prescott Filter, Beveridge-Nelson
decomposition, and unobservable component method; ii) direct measures, using survey data;
iii) structural methods, some examples are production function approach and Okun’s law
approach, defining potential output on the basis of the natural rate of unemployment; and iv)
multivariate non-structural approach; defining potential output in relation with the other
macroeconomic magnitudes, such as inflation and unemployment; some examples are
multivariate Beveridge Nelson decomposition, multivariate Hodrick-Prescott filter, and
multivariate unobservable components method.
The theoretical work differs according to conceptualization of the dynamics of potential
output and the output gap. The theoretical approach to output gap naturally starts with its
realized if the labor force was fully employed, output gap is the difference between the level
of actual output and full employment level of output. However, from the perspectives of
monetary economists, the potential output is typically defined as the level of output that is
consistent with no inflation pressure in the economy. Therefore, output gap will be the
difference between actual output and “non inflation accelerating” level of output. In this case,
Phillips (1958) curve constructs the transmission path between financial and real sectors of
the economy.
From a purely theoretical perspective, the discussion of the concept of output gap can be
classified as Keynesian standpoint, based on Okun (1962), and monetarist standpoint, based
on Friedman (1968).2 Okun defined the concept of gross national income (GNP) gap as the
difference between potential and actual GNP. One must emphasize two facets of Okun’s
definition of the gap: The first important constituent of this definition is that it refers to GNP,
rather than gross domestic product (GDP). Secondly, the potential refers to the level of GNP
that can be produced without inflationary pressure. In monetarist setting of Friedman, in
Lucas’s (1972) words, the potential output concept refers to “the natural level of output”
corresponding to “the natural rate of unemployment”. More recently, Taylor (1993) rule
revitalized the interest in measuring potential output although the concept itself was not used
by Taylor.
On the other hand, there are also some criticisms to the concept of potential GDP. As pointed
out by Plosser and Schwert (1979), even if there is an agreement on how to estimate potential
output, there are still problems with meaning and usefulness of a supply side concept like
potential output. According to Plosser and Schwert, it is not even an equilibrium concept
since there is no relation with aggregate demand. For example, Raizin and Loungani (2005)
argue that under the current level of globalization, policy makers may put a greater emphasis
and open developing country such as Turkey, which has experienced severe economic crisis
in recent history, the measure of output gap is crucial for setting economic policies to have a
stable and sustainable per capita income growth level.
In this paper, we measure potential GDP and output gap for the Turkish Economy during the
period of 1998Q1 and 2011Q4. We use a structural method namely, production function
approach. We first present our findings related to potential GDP and output gap and then we
evaluate economic developments in Turkish Economy with respect to our findings.
The organization of the paper is as follows: Section 2 describes the methodology. Section 3
presents the empirical findings, evaluation of economic developments and policies. Finally,
section 4 concludes.
2. Methodology: The Production Function Approach
In this section, we make use of production function approach to measure potential GDP and
output gap. The Turkish economy is assumed to be characterized by an aggregate
Cobb-Douglas constant returns to scale production function during the period of
1998Q1-2011Q4:
= , (1)
where is output, is total factor productivity (TFP) , is capital input, is labor input,
and and (1 − ) are capital and labor shares of income, respectively. We use real GDP data
for output and total annual hours worked for labor input. For capital input, real capital stock
data is constructed using the perpetual inventory method:3
where is a constant deprication rate and is real investment. Data used in the model for real
GDP, real investment, total annual hours worked are obtained from Turkish Statistical
Institute.4 Real capital stock data is constructed using depreciation rate, real investment data
and an initial value for real capital stock, .5 After constructing data for , we also obtain
total factor productivity data using (1):
=
(3)
Following the previous studies (e.g., Gollin (2002)) we set = 0.3 and = 0.05.6 Hence,
now we have parameters and time series for all variables, , , , and . Given all variables
and parameters, our next step is measuring the potential output, ∗. First, we remove the
cyclical parts of time series A and L by using the HP filter, and obtain detrended series, ∗
and ∗.7 Using ∗, and ∗, we obtain potential output, ∗, from equation (4):8
∗ = ∗ ∗ (4)
Finally, output gap (YGAP) is calculated by the difference between real output and potential
output: = − ∗.
3. Empirical Findings and Evaluation of Economic Developments and Policies
3.1. Empirical Findings
In this section, we first present the output gap as a percent of potential GDP for the entire
period between 1998Q1 and 2011Q4. We, then, analyze the details of the sub-periods: recent
crises (1998, 2001, and 2008) and the boom period (2004-2008).
First of all, we compare the actual real GDP (1998 fixed prices) and the potential GDP
(calculated as explained in Section 2) for the entire period in Figure 1. Figure 1 seems to
all three crises, namely crises in 1998, 2001 and 2008. However, the most remarkable point is
the 2008 crisis, which highlights the effects of the global crisis on the Turkish economy. The
output gap reaches its peak in 2009Q1, however, at the end of 2011 the actual GDP is back on
[image:7.595.74.529.227.466.2]its old trend.
Figure 1: Actual Real GDP and Potential Real GDP: 1998Q1-2011Q4.
Source: Actual real GDP data is obtained from Turkish Statistical Institute Databank. Potential real GDP is
calculated as explained in section 3.
Figure 2 shows the output gap as a percent of potential GDP for the entire period. The
evolution of output gap represents a good picture of the Turkish economy for the period. It
captures 1998 crisis followed by a relatively short recovery period, 2001 crisis followed by a
long boom period, and 2008 crisis followed by a relatively long recovery period. As seen in
the figure, the magnitude of 2008 crisis is more than that of both 1998 and 2001 crises in
terms of the GDP gap. The 1998 crisis seems to include a double deep, the crisis defined with
a “w” in the literature. On the other hand, 2001 and 2008 crises can be characterized with a
single deep, the crisis described as “v” type in the literature.
0 5000 10000 15000 20000 25000 30000 35000 98 Q 1 98 Q 4 99 Q 3 00 Q 2 01 Q 1 01 Q 4 02 Q 3 03 Q 2 04 Q 1 04 Q 4 05 Q 3 06 Q 2 07 Q 1 07 Q 4 08 Q 3 09 Q 2 10 Q 1 10 Q 4 11 Q 3
Real GDP (1998 Fixed Prices, Million TL)
Figure 2: GDP Gap as a percent of Potential GDP: 1998Q1-2011Q4.
Source: Authors’ calculations using data in Figure 1.
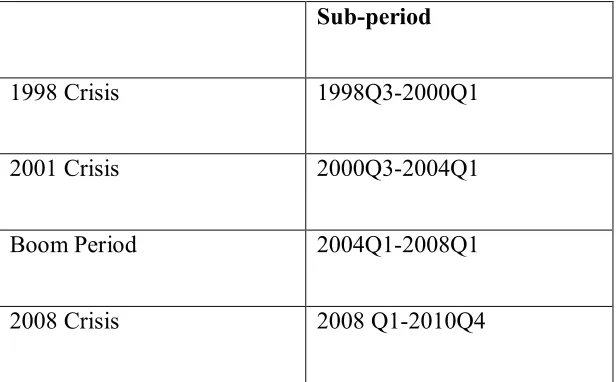
Table 1 presents the sub-periods of crises and booms chosen according to the movements in
the GDP gap as percent of potential GDP (henceforth “GDPGAP” stands for the term “GDP
gap as percent of potential GDP”). The period under consideration is characterized mainly by
three crises sub-periods and a long boom period.
We define the “crisis period” as the quarters which satisfies the following conditions
simultaneously: GDPGAP should start from the peak, drop to negative values, and take at
least 4 successive negative values. Crisis period ends if GDPGAP takes a positive value and
this positive value should be followed by 2 successive periods with positive values. We define
the “boom period” which includes quarters with positive percentage GDP gap for at least 8
successive periods. Table 1 summarizes the crises and boom periods for the entire period.
-15,0 -10,0 -5,0 0,0 5,0 10,0 98 Q 1 98 Q 4 99 Q 3 00 Q 2 01 Q 1 01 Q 4 02 Q 3 03 Q 2 04 Q 1 04 Q 4 05 Q 3 06 Q 2 07 Q 1 07 Q 4 08 Q 3 09 Q 2 10 Q 1 10 Q 4 11 Q 3
Table 1: Crises and Boom Periods between 1998Q1-2011Q4
Sub-period
1998 Crisis 1998Q3-2000Q1
2001 Crisis 2000Q3-2004Q1
Boom Period 2004Q1-2008Q1
2008 Crisis 2008 Q1-2010Q4
Source: Authors’ findings.
Now, we focus on the details of these sub-periods of crises and the boom.
1st Crisis: 1998Q3-2000Q1
In 1998Q3 the GDP gap is 3.41 percent of potential GDP and there is a decrease in this gap in
the following two quarters. The average decrease per quarter is 3.37 percentage points. After
reaching the deep in 1999Q1 with -3.32 percent of potential GDP, it takes 4 quarters to
recover and the average increase is 0.92 percentage points per quarter in this recovery period.
We define the “recovery period” as the quarters which starts from the deep and continues until
the first positive GDPGAP value (which should be followed by 2 successive periods with
positive GDP gap).
2nd Crisis: 2000Q3-2004Q1
The decrease in GDPGAP starts at 2000Q3 and this decline continues until 2001Q4. In this
period, GDPGAP declines 12.18 percentage points in absolute terms. This decrease is from
deep, it takes 9 quarters for the recovery to take place. In this recovery period, the average
increase is 1.35 percentage points per quarter.
3rd Crisis: 2008Q1–2010Q4
2008Q1 is the peak of the entire period in terms of the GDPGAP. However, as most of the
world economies, Turkey also suffered from the 2008 global crisis. At the beginning of this
sub-period, the GDPGAP is 6.90%. After this peak, GADPGAP declined for following four
quarters, and the gap reached to its minimum value of -11.46% in 2009Q1 for the entire
period. The average decline per quarter was 4.5 percentage points during these four quarters.
On the other hand, after reaching the deep, it took 7 quarters for the gap to recover and the
average increase in this period was 1.89 percentage points per quarter.
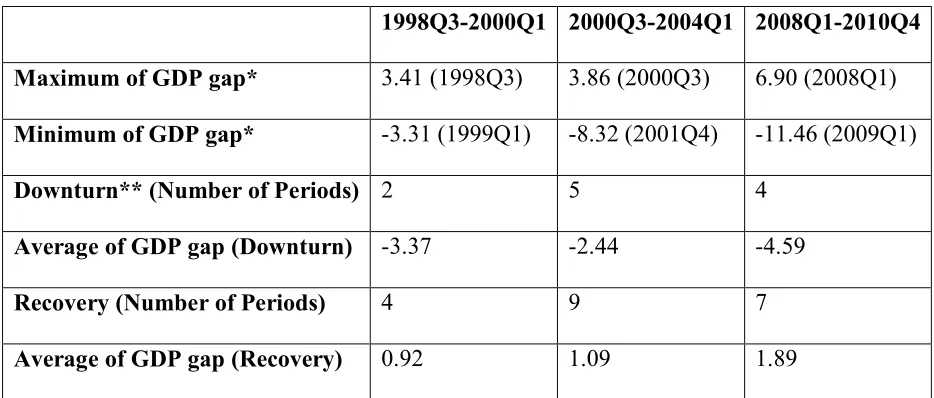
[image:10.595.64.531.449.648.2]Comparisons of these crises are summarized in Table 2.
Table 2: Comparisons of 1998, 2001 and 2008 Crises.
1998Q3-2000Q1 2000Q3-2004Q1 2008Q1-2010Q4
Maximum of GDP gap* 3.41 (1998Q3) 3.86 (2000Q3) 6.90 (2008Q1)
Minimum of GDP gap* -3.31 (1999Q1) -8.32 (2001Q4) -11.46 (2009Q1)
Downturn** (Number of Periods) 2 5 4
Average of GDP gap (Downturn) -3.37 -2.44 -4.59
Recovery (Number of Periods) 4 9 7
Average of GDP gap (Recovery) 0.92 1.09 1.89
Source: Authors’ findings.*GDP gap as a percent of potential GDP. **Downturn is defined as the period from
the peak to deep in a given time horizon.
If we compare these crises according to the length of downturn and recovery periods, the
crisis when compared to the other two crises. However, when we compare the crises
according to the magnitude, the biggest collapse occurs during 2008 crisis. The average
decrease in this downturn period is 4.59 percentage points per quarter and it takes only in 4
quarters for the GDPGAP to reach its minimum level for the entire period. However, recovery
period is shorter in 2008 crisis when compared to 2001 crisis.
The Boom Period: 2004Q1–2008 Q1
The GDP gap is always positive between 2004Q1 and 2008Q2. In other words, actual real
GDP is higher than the potential GDP for 18 quarters successively and reach the maximum
level at 2008 Q1. This peak is also the highest value for the entire period. 2008 global crisis
leads to the end of this boom period in Turkey.
Effects of 2008 Crisis: 2010Q4 -2011Q4
After recovering from 2008 crisis, once again the actual real GDP remains higher than the
potential GDP for 5 successive quarters. A remarkable point for this period is that actual real
GDP is back on its old trend as seen in figure 1. This observation suggests two important
results. First, the recovery period is over for Turkey. Second, the negative effects of 2008
global crisis are not permanent.
The Relationship between the Growth Rate of Actual Real GDP and GDPGAPFigure 3
presents the growth rate of actual real GDP (relative to the same quarter in the previous year)
and the GDPGAP. The correlation between these two variables is +0.78. This finding
supports the fact that timely measure of output gap is crucial in formulating counter cyclical
Figure 3: Real GDP Growth Rate and GDPGAP: 1998Q1-2011Q4
Source: Authors’ calculations using data in Figure 1.
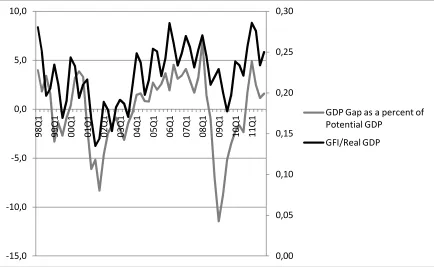
The Relationship between the Share of Gross Fixed Investment in Real GDP and
GDPGAP
Finally, figure 4 presents the share of gross fixed investment in real GDP and GDPGAP. The
observations appear to show a close relationship between the two variables. The correlation
coefficient between the share of gross fixed investment in real GDP and GDPGAP is 0.62. It
is easily seen that 2001 and 2008 crises had crucial negative effects on the share of gross fixed
investment in real GDP due to sharp decreases in GDPGAP. Therefore, public investment
policy decision processes should take output gap measures into account.
-20,0 -15,0 -10,0 -5,0 0,0 5,0 10,0 15,0 99 Q 1 99 Q 4 00 Q 3 01 Q 2 02 Q 1 02 Q 4 03 Q 3 04 Q 2 05 Q 1 05 Q 4 06 Q 3 07 Q 2 08 Q 1 08 Q 4 09 Q 3 10 Q 2 11 Q 1 11 Q
4 GDP Gap as a Percent of Potential GDP
Figure 4: Share of Gross Fixed Investment in Real GDP (GFI/Real GDP) (Right Hand
Scale) and GDPGAP(Left Hand Scale): 1998Q1-2011Q4.
Source: Authors’ calculations using data in Figure 1.
3.2. Economic Developments and Policies for the Crises and the Boom Period
Ozatay (2009) distinguishes economic crises according to the roots of causes: externally
caused crises and internally caused crises. In this respect, from the perspective of the Turkish
economy 1998 and 2008 crises are externally caused crises, while 2001 is an internally caused
crisis. As emphasized by Kazgan (2008), internal factors including economy policies lead to
both a tendency for the economy to slide into crisis and difficulty for the government to
control and overcome the crisis. On the other hand, Rodrik (2002) claims that even if a
country takes all the precautions, it still remains open to the external developments, and
therefore, policymakers need to guard against not only domestic shocks but also external
shocks. In this subsection, we document economic developments in these three crises period
0,00 0,05 0,10 0,15 0,20 0,25 0,30 -15,0 -10,0 -5,0 0,0 5,0 10,0 98 Q 1 99 Q 1 00 Q 1 01 Q 1 02 Q 1 03 Q 1 04 Q 1 05 Q 1 06 Q 1 07 Q 1 08 Q 1 09 Q 1 10 Q 1 11 Q
1 GDP Gap as a percent of
and the boom period between 2001 and 2008 crises and evaluate these developments on the
basis of our findings.
1998 Crisis: 1998Q3-2000Q1
The Turkish economy faced a severe economic crisis in 1994 and Turkey introduced a major
economic stabilization program in the April of 1994. The major cause of 1994 crisis was
unsustainable public deficits and resulting inflationary pressures.9 Therefore, the stabilization
program aimed at reducing the fiscal deficit, and tightening monetary policies. However, the
Turkish economy recovered from the 1994 crisis quickly, at least in terms of growth rates. In
the following three years the Turkish economy grew over 7% annually. As mentioned in
Central Bank’s (CB) Annual Report (1998), the rapid growth cycle, which began in 1995,
continued until the second quarter of 1998. However, measures to reduce inflation, effect of
capital outflow due to expected effect of Russian crises on the Turkish economy, contraction
in world demand due to 1997 South Asian crisis, and excess capacity due to high investment
after Custom Union (CU) agreement ended growth trend. Growth rate went from 8.7 percent
in 1997 to 4.4 in 1998. During 1998 domestic and foreign demand contracted, however since
slow down in import was over that of export, a current account surplus was observed.
Consumer price inflation also decreased by 29.4 percentage point in 1998. In its Annual
Report for 1999, CB takes recession as starting in the second quarter of 1998, and deepening
in 1999. August 1998 Russian crisis led to massive capital outflow, as a result interest rates
increased significantly. High interest rates and earthquakes in August and November 1999
contributed to the recession. Furthermore, inflation rose sharply in 1999. According to
Tokgoz (2011), this period was matched with the contraction in the world economy. Our
findings for GDP gap as a percent of real potential GDP completely matches the
crisis period includes a down turn sub-period of 1998Q3 to 1999Q1 and a recovery sub-period
of 1999Q2 to 2000Q1.
2001 Crisis: 2000Q3-2004Q1
According to CB’ Annual Report (2000), the deterioration of the public financial balance, the
rise in domestic debt stock due to the continuation of high levels of real interest rates, the
accelerating trend of the inflation rate, and the continuing economic contraction made it
mandatory to put a new medium-term program into implementation in 2000. Therefore,
developments in 2000 in the Turkish economy were tried to be managed through this
“Disinflation Program”. The main objectives of the program were: reducing the inflation rate
to one digit numbers within 3 years, and decreasing the real interest rates to reasonable levels.
Economic policy tools to be utilized were the primary surplus by applying contractionary
fiscal policies, structural reforms, and privatizations. While the recovery in domestic demand
led GDP to grow notably in the first three quarters of 2000 (GDP was 6.5 percent up
compared to the same period of the previous year), the rapidly deteriorating current account
deficit, delays in the implementation of structural reforms in the second half of 2000, and
deviations from the privatization targets caused uneasiness in both domestic and external
markets. According to CB’s Annual Report 2001, the Supplemental Reserve Facility provided
by the International Monetary Fund, short-term capital inflows, and additional structural and
financial measures to enhance the existing program led to a to a relative relaxation in the
financial markets. The crises at the end of 2000 and the beginning of 2001 increased the
fragility of the financial sector to a great extent, and the banks constituting the main portion of
the financial sector faced serious deteriorations in their financial structures. These
developments led to a financial crisis, which we call 2001 crisis.
Following the financial crises in November 2000 and February 2001, the new economic
program called “Strengthening the Turkish Economy” was put into practice. There were
deep-rooted structural factors behind these two crises. Therefore, the main goals of the program
comprised; reducing uncertainties in the financial markets; completing structural reforms to
promote economic efficiency; and focusing macroeconomic policies on the disinflation effort
to assure a sustainable growth path. On the other hand, as pointed out by Ekzen (2009), the
new economic program aimed at changing the growth model of Turkey from being based on
domestic demand to be based on external demand. Furthermore, as a part of structural
reforms, in April 2001, the new Central Bank Law was enacted, providing the CB with more
autonomy. The new Law stated that the CB’s main policy objective is the maintenance of
price stability. With this Law CB changed its monetary policy focus and introduced inflation
targeting regime.
As mentioned in CB’s Annual Report (2002), in early 2002, considering the instability in the
domestic and foreign financial markets the economic program called “Strengthening the
Turkish Economy” was revised to cover the 2002-2004 period. The fundamentals of the
revised program were to enhance the resilience in the economy against shocks and therefore,
to decrease vulnerability in case of any possible crisis. In this respect, the main policy tools
were the floating exchange rate and inflation targeting regimes. Due to contractionary fiscal
and monetary policies, the real GNP growth rate was limited during the period.
According to our findings in terms of GDP gap as a percent of real potential GDP, in 2001
crisis, we take the 2000Q3-2001Q4 period as downturn, while the period 2002Q1-2004Q1 as
the recovery periods. CB Annul Report (2003) also makes similar decomposition of the
period in 2002. Therefore, the primary objectives of the 2003 program were determined as
disinflation, the reduction of the debt burden, and the attainment of sustainable high growth
rates.
The Boom Period: 2004Q1-2008Q1
According to CB Annual Report (2004), the main objectives of the stabilization program for
2004 were to achieve a high growth rate; to reduce consumer price inflation to the targeted
level and to achieve the primary surplus target, thus reducing public sector debt stock which
creates pressure on the macroeconomic equilibrium. To attain these objectives, fiscal,
monetary and income policies were effectively used. Productivity gains and an increase in
domestic demand had helped to close the GDP gap that emerged in 2001. As mentioned
above, our findings show 2002Q1-2004Q1 period ad as a recovery period. In its 2005 Annual
Report CB also identifies the same period as a recovery period and asserts that the recovery
continued in 2005. According to the same report, the main determinants of the ongoing
positive trend in 2005 were the increase in confidence stemming from resolute
implementation of the economic program, maintenance of the fiscal discipline without
concession, ongoing structural reforms, the strong level of the Turkish Lira, and the ongoing
decline in interest rates. As mention in its Annual Report 2006, CB adapted a “full-fledged”
inflation targeting monetary policy. Together with this policy, the other reforms, which
strengthened the market mechanism, improved financial sector capacity to provide resources
to the real sector, enhanced the labor force quality, and increased competition, contributed to
price stability and sustainable growth in 2006. On the other hand, in the final year of the boom
period, as reported in CB Annual Report 2007, sharp increase in private consumption and
investment expenditures resulted in saving deficiency, as a result the boom in economic
current account deficit and private sector debt stock. In addition, contraction in agriculture
and decline in consumer and investor confidence due to global financial turbulence signaled
the end of the boom period. According to Öniş (2010), the key element in case of Turkey is
an externally driven economic growth based on significant capital inflows. However, 2008
global economic crisis exposed the limitations of this model.
2008 Crisis: 2008Q1-2010Q4
Boratav (2011) separates world economy’s business cycles as follows: 1998-2001 crisis
period; 2002-2007 recovery/boom period; and 2008-after crisis period. The developments in
the Turkish economy show a similar pattern. As an open economy with free capital
movements, the Turkish economy is naturally prone to international economic crises.
Therefore, 2008 global economic crises, the worst global crises since the great depression,
resulted in a crisis in Turkey as well. As mention in CB Annual Report 2008, the global
financial crisis that emerged in the US subprime mortgage market in August 2007 and
deepened following the bankruptcy of several large US financial institutions in September
2008 began to have significant adverse effects on the real economy in 2008. One must keep in
mind the fact that the boom period discussed above was not only due to the “right policies”
and structural reforms but also favorable conditions in international markets. In the second
quarter of 2006, fluctuations in international markets caused risk premiums in Turkey and
other emerging market economies to rise. CB responded this development by a monetary
tightening, which led to further economic slowdown and economic activity contracted at a
faster pace in 2008. According to the CB Annual Report 2009, the effects of the global
financial crisis continued into 2009. On the other hand, with massive government
interventions, the effects of the crisis started to weaken by mid-2009, and the global economy
path in 2009: Having deepened during the final quarter of 2008, the global downturn began to
weigh more heavily on the Turkish economy in 2009. On the other hand, as pointed out by
CB Annual Report 2010, the Turkish economy recovered rapidly as the effects of the global
financial crisis tapered off in 2010: Turkey became the one of the fastest growing economies
across OECD countries. Furthermore, in 2010, the positive outlook for GDP growth helped
improve the labor market, and accordingly, employment followed a strong upward trend.
According to Simsek and Simsek (2011), 2001 domestic crisis saved the Turkish economy
from the severe effects of the 2008 global crisis. This is because of the fact that structural
reforms implemented following the 2001 crises lessened the vulnerabilities in the Turkish
economy, especially in the financial sector. In addition, the fruits of the boom period that
followed the 2001 crisis made it possible for Turkey to further strength its economy against
economic crises. However, according to Yorukoglu and Atasoy (2010), although financial
sector remained roust during the crisis, the real sector has been significantly affected through
for channels; international trade channel, expectations channel, foreign capital flows channel,
and credit channel.
4. Conclusion
The output gap is defined as the difference between actual real GDP and potential GDP. It is
considered to be a key indicator of future economic activity and it has an important role in
formulation of monetary, fiscal, and income policies. In this paper, we measure potential GDP
and output gap for the Turkish Economy for the period of 1998Q1 and 2011Q4. We use a
structural method namely, production function approach.
We analyze the crises and the boom period in terms of output gap. 1998 crisis includes a
double deep, the type of crisis described with “w” in the literature. On the other hand, 2001
in the literature. In addition, 1998 and 2008 are externally caused crises, while 2001 is an
internally caused crisis. We find that according to the length of downturn and recovery
periods, the worst one is the 2001 crisis. Both the downturn and the recovery periods are
longer in 2001 crisis when compared to the other two crises. However, when we compare the
crises according to the magnitude, the biggest collapse occurs during 2008 crisis. The average
decrease in this downturn period is 4.59 percentage points per quarter and it takes only in 4
quarters for the GDP gap as a percent of potential GDP to reach its minimum level for the
entire period. On the other hand, recovery period is shorter in 2008 crisis when compared to
2001 crisis. After recovering from 2008 crisis, once again the actual real GDP remains higher
than the potential GDP for 5 successive quarters. A remarkable point for this period is that
actual real GDP is back on its old trend as suggesting that the recovery period is over for
Turkey and the negative effects of 2008 global crisis are not permanent.
Finally, our empirical findings show that GDP gap and the growth rate of actual GDP have a
strong correlation. This conclusion implies the fact that timely measure of output gap is
crucial in formulating counter cyclical economy policies. In addition, the correlation
coefficient between the share of fixed investment and GDP gap is 0.62, implying that public
investment policy decision processes should take output gap measures into account.
Notes.
1 Dore (1995, p.217) asserts that “an income policy may be the answer to reducing the
ravages of business cycles and consequent stop and go policies that accompany it”.
2 For a discussion of output gap from Keynesian and monetarist standpoints, see Congdon
(2008).
3 Real GDP, total annual hours worked and real investment variables are seasonally adjusted. 4 Data and author’s calculations are available upon request.
5 One could choose the initial capital stock such that the capital-output ratio in initial period
matched the average capital-output ratio over a reference period. We choose 1998Q1-1999Q4 period as a reference period.
share across countries.
7 We set the smoothing parameter to 1600.
8 Unlike the labor input, the capital input does not need to be cyclically adjusted to create a
“potential” level. See Congressional Budget Office (2001) for more discussion.
9 Public sector borrowing requirement/Gross National Product ratio was 7% in 1994. See
Central Bank of Republic of Turkey, Statistical Data, Public Sector Borrowing Requirement, www.tcmb.gov.tr.
References
Artus, J. R. 1977. “Measures of Potential Output in Manufacturing for Eight Industrial Countries, 1955-78.” IMF Staff Papers, Vol. 24, No. 1, pp. 1-35.
Boratav, K. 2011. Türkiye İktisat Tarihi: 1908-2009. İmge Kitabevi, Ankara.
Bukhari, S. ; H. A. S. Adnan; and S. U. Khan. 2008. “Estimating Output Gap for Pakistan Economy: Structural and Statistical Approaches.” State Bank of Pakistan, Working Paper Series, No. 24.
Central Bank of Republic of Turkey. 1994. Statistical Data, Public Sector Borrowing Requirement, www.tcmb.gov.tr.
Central Bank of Republic of Turkey. 1999-2011. Annual Reports 1998-2010, www.tcmb.gov.tr.
Congdon, T. 2008. “Two Concepts of the Output Gap.” World Economics, Vol. 9, No.1, pp.147-175.
Congressional Budget Office. 2001. “CBO’s Method for Estimating Potential Output: An Update.” http://www.cbo.gov.
Dore, M. H. I. 1995. The Macro Dynamics of Business Cycles: A Comparative Evaluation. Blackwell Publishers, Massachusetts.
Ekzen, N. 2009. Türkiye Kısa İktisat Tarihi. ODTÜ Yayıncılık, Ankara.
Friedman, M. 1968. “The Role of Monetary Policy.” American Economic Review, Vol. 58 (March), pp. 1-17.
Gerlach, P. 2011. “The Global Output Gap: Measurement Issues and Regional Disparities.”
Bank of International Settlements Quarterly Review, June.
Gollin, D. 2002. “Getting Income Shares Right.” Journal of Political Economy, Vol. 110, No. 2, pp. 458-474.
Lucas, R. E. Jr. 1972. Econometric Testing of the Natural Rate Hypothesis, in Otto Eckstein (ed.), TheEconometrics of Price Determination Conference (Washington, D. C.: Board of Governors of the Federal Reserve System), pp. 50–59.
Okun, A. M. 1962. “Potential GNP: Its Measurement and Significance.” in Proceedings of the Business and Economic Statistics Section, American Statistical Association, Washington, D.C., pp. 98-103.
Öniş, Z. 2010. “Crises and Transformation in Turkish Political Economy.” Turkish Policy Quarterly, Vol. 9, No. 3, pp. 45-61.
Özatay, F. 2009. Finansal Krizler ve Türkiye. Doğan Kitabevi, İstanbul.
Phillips, A. W. 1958. “The Relationship between Unemployment and the Rate of Change on Money Wage Rates in the United Kingdom, 1861-1957.” Economica, Vol. 25, No. 100, pp. 283-299.
Plosser, C. I., and G. W. Schwert. 1979. “Potential GNP: Its Measurement and Significance.” Carnegie Rochester Conference Series on Public Policy, Vol.10, pp. 179-186.
Razin, A. and P. Loungani. 2005 “Globalization and Inflation –Output Tradeoff.” NBER Working Paper Series 11641.
Rodrik, D. 2012. “The Turkish Economy after the Global Financial Crisis.” Ekonomi-tek, Vol. 1, No.1, pp. 41-61.
Simşek, H. A., and N. Simşek. 2011. “Has the Turkish Economy been Less Affected by the 2008 Global Crisis: A Macroeconomic Perspective.” Research Journal of International Studies, Vol. 2 (December), pp. 168-187.
Taylor, J. B. 1993. “Discretion versus Policy Rules in Practice.”Carnegie-Rochester Conference Series on Public Policy, Elsevier Science Publishers, Amsterdam. pp. 195–214.
Tokgöz, E. 2011. Türkiye’nin İktisadi Gelişme Tarihi (1914-2011). İmaj Yayınevi, Ankara.