Munich Personal RePEc Archive
X-Efficiency of Innovation Processes:
Concept and Evaluation based on Data
Envelopment Analysis
Herimalala, Rahobisoa and Gaussens, Olivier
Centre for Research in Economics and Management, University of
Caen Basse Normandie
October 2012
X-Efficiency of Innovation Processes: Concept and Evaluation based
on Data Envelopment Analysis
Rahobisoa Herimalalaa,∗
, Olivier Gaussensa,∗
a
Centre of Research in Economics and Management - 19 rue Claude Bloch, 14032 Caen Cedex, France
Abstract
This paper investigates X-(in)efficiency of innovation processes in Small and Medium-sized Enterprises (SMEs). We have adopted the following approach: (a) we provide both a concept of X-(in)efficiency and a model of innovation processes for each SME; (b) from this model we evaluate both the dimensions of the innovation processes and the X-(in)efficiency of these processes using a variant of the Data Envelopment Analysis (DEA) model; (c) finally, we characterize X-inefficiency by using techniques of exploratory analysis derived from an empirical analysis. Our approach has been applied to regional SMEs in Normandy (France) with a representative random sample of 80 innovative businesses. The results show the existence of X- inefficiency in the innovation processes of SMEs in 71% of cases. This X-inefficiency arises primarily from the difficulties that entrepreneurs face in implementing the interacting rules and standards of exploitation and exploration activities.
Keywords: Data Envelopment Analysis, Multiple Projections, X-Efficiency, Innovation Process.
1. Introduction
In small and medium-sized enterprises (SMEs), innovation is an undisputed source of com-petitiveness and growth (Guan et al.,2006). However, the development of innovation strategies depends upon a better understanding of the innovation process. We therefore need to clarify our conception of innovation and the innovation process. Using the Oslo Manual (OECD, 2005), we consider innovation to be the implementation of a new or significantly improved product, or process, a new marketing method, or a new organizational method in business practice, work-place organization or external relations in our investigation. At the same time, this manual describes innovation as a permanent, dynamic and evolutive process, but does not adequately define properly the innovation process itself. However, Chesbrough and Rosenbloom (2002) have defined the innovation process as one which transforms strategic, technological and non-technological knowledge specific to the entrepreneur into business process (new value) under conditions of uncertainty. Here we adopt this last definition of the innovation process.
In addition, much theoretical and empirical work on innovation and business has focused on two fundamental points regarding innovation: the role of SMEs, and the influence of orga-nization (Cohen, 1995; Rothwell and Dodgson, 2004). However, as far as we know, there is no study that explores the efficiency of innovation processes in these organizations, despite this
∗Corresponding authors
Email addresses: [email protected](Rahobisoa Herimalala),
question being of importance to the decision making units (DMUs) developing action plans for better innovation strategies. Only one study, covering innovative firms in China and carried out by Guan et al.(2006), has investigated the efficiency of innovation harmonizing processes, which is an input-output system of competitiveness. This study does not deal with the ef-ficiency of the innovation process as defined previously. On the other hand, a recent survey undertaken in the IDEIS project1 has shown how unsatisfactory the development of business
innovation in the majority of SMEs in the Normandy region is. The main issue is whether this phenomenon is due to the inefficiency of their innovation processes. The same survey has also revealed that most entrepreneurs see the innovation process as more or less a black box. In fact, this perception derives from those aspects of innovation that are not directly measurable or observable, or are even intangible (Hansen, 2001; Guan et al., 2006). In reality, innovation is a latent variable. This situation often causes difficulties for entrepreneurs modeling their innovation processes, in identifying and measuring the dimensions of innovation, such as inputs and outputs. It may even be the cause of the inefficiency of their innovation processes.
Our study is motivated by these three main points: first, we propose a modeling of the innovation process using some procedures established in the literature. Here we also identify the dimensions of the innovation. Secondly, using this model, we propose an evaluation model of the efficiency of innovation process. We show both the existence of X- inefficiency in the innovation processes, and that inadequate development of innovation in SMEs is related to it. Finally we provide some characterizations of the inefficiency.
In the literature on the measurement of the innovation, certain authors (Chiesa et al.,1996;
Dodgson and Hinze, 2000; Hansen, 2001) propose some audit tools based on observable indi-cators to enable decision makers to collect data on innovation. Relating to the same issue, the Organization for Economic Cooperation and Development (OECD) has elaborated some guidelines for the collection of data on innovation in the Oslo Manual (OECD, 2005), which is widely used in the Community Innovation Surveys (CIS2). This manual covers all the
ap-propriate information on activities, and the actual outcomes of the innovation process. It also clearly distinguishes inputs from outputs in the process. The construction of our survey sup-port was based on the principles in this manual (Gaussens,2009) from which we have selected a collection of evaluation criteria.
Moreover, the innovation process is a multidimensional and complex event with multi-inputs (activities) and multi-outputs (Hansen,2001;Guan et al.,2006). It involves a range of activities, involving financial, material and immaterial resources. Here we focus more on the analysis of the activities coordinated by the entrepreneur than on the use of economic resources. Indeed, in line with Amit and Schoemaker(1993), the capacity for innovation enables a business to make us of its resources in the activities that make up the innovation process: design, organizational learning, and activities related to knowledge and creativity.
Otherwise we consider two outputs from the innovation process: innovation intensity and total factor productivity (TFP). Innovation intensity takes into account the different types of innovation3 that can be achieved in a business. It measures the scope of innovation. The
1
The IDEIS project (https://www.unicaen.fr/mrsh/projetideis/) focuses on innovation capacity of SMEs. It is part of the Government-Region Project Contract (2007-2013) and benefits the European Re-gional Development Fund. The IDEIS survey (2009-2010) includes a representative sample (random, stratified) of SMEs in Normandy, France.
2
cf. http://epp.eurostat.ec.europa.eu/portal/page/portal/microdata/cis.
3
TFP measures how far this particular business makes use of its innovative activities. This suggests that a priori these two indicators each have the same importance in the objective function for the decision maker. In the other words, the innovations made in the business are: (a) through the innovation achievements of the business; (b) the monetary translation of significant improvements that have been introduced in a particular domain of the business4.
Furthermore as outlined in Forsman(2011), this approach is ideal for SMEs since the inno-vation process is more a collective design process through all the activities of the business than a well-defined process based on dedicated resources, such as formal R&D, and deployed as part of a strategy. Therefore we deal with the X-efficiency or X-inefficiency of an organization due toLeibenstein (1979).
X-inefficiency regroups non-allocative inefficiencies. X-inefficiency theory is concerned with the under-utilization of resources - (...) what was involved by and large were the activities inside business (...) - (Leibenstein, 1979). For example labor, capital and information may not be fully used, or may be ineffectively used, or rules and procedures used in the business may turn out to be inadequate in the current context. Then, given the main characteristics of an innovation process (uncertainty, interactivity, cognition), it is easy to understand why this process is characterized by X-inefficiencies - (...) the conclusion that without introducing an X-inefficiency factor into his equations, the innovation process and the rate of innovation could not be explained (...) - (Leibenstein, 1979). In the context of the innovation process, X-inefficiency causes a non-optimal use of innovation capacity. The enterprise can then suffer a loss of productivity or insufficiency of innovation.
Here we investigate the sources of under-utilization of innovation capacity. There are two principal contributions made in this paper: (1) the specification of some aspects of X-inefficiency in innovation processes such, as the problems of technical inefficiency and congestion; (2) mea-suring the respective magnitude of each phenomenon, and also global X-inefficiency.
X-inefficiency can be evaluated using parametric or nonparametric methods. The parametric approaches require satisfactory specification of the functional form and the distribution of random production. Moreover, in multi-input and multi-output systems all output dimensions have to be aggregated. In such conditions it is difficult to establish the parameters of the technology. Guan et al. (2006),Leibenstein and Maital(1992) have, respectively, proposed the use of data envelopment analysis (DEA) to analyze the efficiency of innovation harmonizing processes, and the X-efficiency of an organization. In this paper we employ the DEA method to evaluate the components of X-efficiency of innovation processes. Since there is also a lack of information on the nature of technology innovation, we use the DEA model under variable returns to scale (VRS) to estimate the empirical technology and, the enhanced Russell graph efficiency measure for an assessment of the magnitude of X-inefficiency.
The evolution of outputs depends on market structures which determine the innovation strategy of the business. For example, a business can adopt a niche strategy and achieve a breakthrough innovation in one area; but then we can observe a rather low level of innovation intensity, coupled with relatively strong TFP. By contrast, a business in a highly competitive environment may be forced to make minor innovations in many areas just to survive, or to maintain its TFP. In this situation, we can observe a high level of innovation intensity. That means innovation intensity and TFP are uncontrollable variables. Comparing the DMU with a radial projection is not then really appropriate, especially if this projection is a convex
4
combination of efficient units, but not a real DMU. Therefore we use the multiple projections DEA model to identify all possible efficient peers of the DMU under evaluation. Then we choose an appropriate projection among them with respect to an appropriate distance (e.g. cf.
Yang et al., 2009, about the shortest distance model in the MOLP-DEA). Besides, in some cases authors such as Lins et al. (2004) and Hosseinzadeh Lotfi et al. (2009) have suggested the use of multiobjective linear programming in a DEA (MOLP-DEA) model to identifying all efficient DMUs.
This paper is organized as follows. In section (2) we provide a model of the innovation process as an interactive process between exploitation and exploration. We also describe both the concept and the aspect of the X-(in)efficiency in the innovation processes. In section (3), we propose both a measurement model of innovation and an evaluation model based on the data envelopment approach of the X-(in)efficiency. In section (4), we conduct an empirical analysis of innovation processes in SMEs of the Normandy region of France with data from the IDEIS project survey. We also identify the sources of inefficiency by partitioning X-inefficiency. Finally, we propose in section (5) some description and characterization of X-inefficiency by combining two techniques of exploratory analysis, recursive partitioning and multiple correspondence analysis.
2. X-Efficiency in the innovation process
We model the innovation process from works on the exploration/exploitation trade-off in organizational learning (March, 1991; Nooteboom, 2001; He and Wong, 2004; Holmqvist,
2004; Harryson, 2008), and also from design theory (Simon, 1969; Sch¨on, 1984; Kline and Rosenberg,1986;Hatchuel and Weil,2009;Le Masson and Weil,2010). The innovation process is considered here as a process of innovative design characterized by interactions5 between
value-oriented or problemsolving/solutionfocused activities (or exploitation6), and explorer
oriented activities7 (for further details see Appendix A). We consider design activities oriented
to the definition of value, and organizational learning oriented to the collective capacity to realize value. Knowledge activities and creative activities are exploratory to the extent that they allow the value-oriented activities to explore potential value and orient themselves towards innovation. We assume that, from the efficiency of innovation in SMEs, the key question is how to better integrate exploration and exploitation8. Indeed, radical incrementalism or intensive
innovation is well adapted to this type of enterprises in the sense that this innovation model is based on the co-evolution of values and knowledge (Le Masson et al., 2010; Forsman, 2011).
The X-efficiency of an innovation process is thus based on the contribution of explorer ori-ented activities to innovation activities, and on the innovative content of the value oriori-ented activities or exploitation. Also, this X-efficiency depends more on interactions between the activities than on a simple balance between them, with the necessary and sufficient innovation capacities level equal. The X-efficiency means here the existence and the optimal use of relevant rules, standards or procedures of in the interactions between individuals and different business
5
Interact in a process in an enterprise means to act by addressing customers or users.
6
According toMarch(1991), the efficient use of existing knowledge.
7
The development of new knowledge (March,1991).
8
activities in the organization9 within which the process of collective design is developed10 This process generates a co-construction of collective activity based on a continued expansion of questions from value oriented activities and possible solutions deriving from exploratory activi-ties according toSimon(1986)11. More precisely, we define the innovation process as a network
of activities, centered on the entrepreneur function. The entrepreneur knows the products, the technologies and the markets in which his business is evolving. He is best able to model, or-ganize and stimulate tailored interactions between exploration and value creation (Harryson,
2008; Gobbo Jr. and Olsson, 2010). The answer to the problem of the adjustment between exploration and exploitation lies in either minimizing innovation capacities, risking little or no innovation output (natural tendency displayed by existing organization (Adler et al., 2009)), or as in the entrepreneurial response, driving the innovation dynamics of enterprise (Tushman and O’Reilly, 1997). Within this last framework, we see the entrepreneurial function as a management system based on designing and organization learning from schemes used to link exploration and exploitation. Designing schemes are intended to the definition of the value for the enterprise. These are fundamentally based on interactions between the designing actors and the customers or external users. The quality of these interactions is a critical factor in deter-mining the relevance of questions defining directions to be explored (in which areas is research needed, and what solutions must be found ?); and also the relevance of screening or selection for proposed ideas and solutions. For example, the poor quality of man/machine interfaces is due to the lack of interactions between designers and ergonomists, which is itself explicable by the separation between designing and using.
Learning mechanisms are applied jointly in a complementary manner12 to establish the
value. Their effectiveness is based on relevant patterns of strengthened interactions between drivers and implementers in the innovation process changing rules and procedures through an exploratory approach. Strategic deployment, feedback concerning experience, knowledge capitalization test/error experimentation, these are all practices related to organizational
9
The possibility of interactions between individuals requires that they relate to each other, which is based on communication, coordination and cooperation rules and media, such as the possibility of meeting and having unexpected conversations, on contracts and agreements, a shared language and a common knowledge.
10
Given that designing refers to prescribing (knowing what must be done and how, checking the implementation), the concept of collective designing relates to low prescription and reciprocal prescription(Hatchuel et al.,2002) in a context of interactive rationality (Ponssard and Tanguy,1993).
11
Simon’s key contribution has been to highlight the interaction between exploration and problem-solving. When problems are ill-defined, as is the case in innovative design, both problems and solutions arise. It is therefore a type of problem-solving that is resolved by drawing up so-called cognitive strategyfocused-solution
that leads to specify objectives and original constraints. This approach has been formalized in the framework of theC-Ktheory developed byHatchuel and Weil(2009).
12
First, the quality of collective designing depends on the quality of interactions between actors in the process seeking to reach agreement on what needs to be done. The quality of interactions itself depends on the smooth conduct of the interpretative work by reciprocal discussion based on rules and standards of interactions (Sch¨on,
learning (March,1991)13. Thus cooperation between Renault and General Motors (GM)14over the design of the Trafic van initially encountered difficulties because the representatives of each firm adhered too closely to the standards of their own company. Once this was discovered a corporate decision was made to develop principles specific to the process of co-operation, deviating from those of Renault and GM.
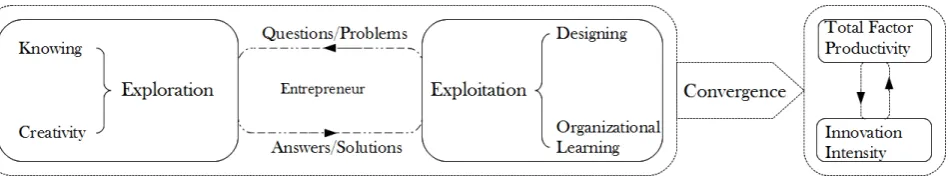
Finally, if we measure innovation as the outcome of the innovation process using innovation intensity and the total factor productivity, the innovation process can be represented as in Figure (1).
Figure 1: Innovation process as collective design process (cf.Appendix Afor details).
From the point of view of efficiency, we generally consider that it is difficult to balance exploration and exploitation, in that some of the knowledge, learning and proposed solutions will ultimately not be recovered or used (Le Masson et al., 2010).
The excess of exploratory activity can be explained by the filtering and selection in the pro-cess of convergence towards the achievement of value. We are assuming here that the adjust-ment problems between exploration and exploitation are based not only on defects in knowledge capitalization and ultimately in their re-use, but more broadly on failures of interaction which may result in under-utilization of both exploration and exploitation. Thus separating designing from using will produce both excess in design and under-utilization of user’s knowledge, in rela-tion to the value that could have been produced if appropriate interfaces had been introduced. Additionally, an overly prescriptive process, or an excessively hierarchical structure, prevents actors closely involved in the process to assume responsibility for adapting and providing reli-able feedback. This results in the under-utilization of implementer’s knowledge and experience, and as a corollary, an excess of rules, procedures, incentives mechanisms and control.
We are assuming here that the failures of interaction which produce under-utilization of both exploration and exploitation explain the way that many businesses operate with a considerable degree of slack and are X-inefficient, according to Leibenstein (1968, 1969, 1979). In turn, this implies the existence of entrepreneurial opportunities (Leibenstein, 1968). The failures of interaction between actors and/or professionals in the innovation process (including actors external to the enterprise: customers, users, suppliers and others usual or unusual sources of knowledge15) result in both a lack of use of knowledge and experience from these actors,
and their lack of motivation16 Indeed, interactions have not occurred naturally, they must be
13
Provided these practices are reliable, since that depends on relevant rules and procedures of interactions between drivers and implementers in the innovation process. For example, room for error and low hierarchical pressure promote upward relevant feedback (Pfeffer and Sutton, 2006). Strategic execution depends upon a well-conceived strategy and its effective implementation through explanation and discussion.
14
Example fromMorel(2012, p.159).
15
For example, the entrepreneur Gustave Effel was an exceptional organizer of collective innovative designing activities, involving unusual actors such as artists, ministers or provincial governors (Le Masson et al.,2010).
16
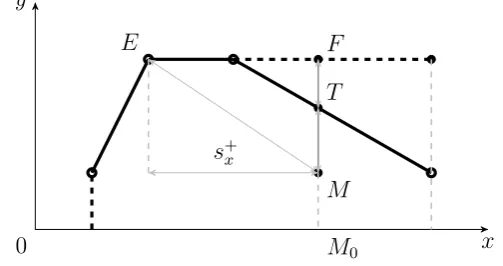
[image:7.595.65.540.184.274.2]X-Figure 2:
Graphical illustration of the X-Inefficiency. The empirical frontier is delimited by the thick full line.
y
0 x
E F
M T
M0 s+
x
well thought have to be adequately conceived and properly and properly organized by the entrepreneur, whose role. Obviously that its role of contributing to lies in creating a corporate culture and a set of practices which allow the construction of conducive to a collective process of innovation (Pfeffer and Sutton,2006). Entrepreneurial failure is the prime explanation of X-inefficiency of the innovation process in the enterprise: ”...the essential aspects of the requisite entrepreneurial activities are to fill lacunae in the production function, in the organizational structure, in the incentive-reward system, or in any other part of the structure of the firm or the economy necessary to promote changes.” (Leibenstein, 1969, p.612).
Thus inappropriate interaction causes technical inefficiency. The technical inefficiency of the innovation process is centered on output, since the aim is to gain the best return with optimal innovation capacity from the process activities. Technical inefficiency here means: the relatively defective implementation of relevant patterns of interaction in the collective design process which prevent the achievement of the optimal pace of individual activities (for example in the case of the inefficient cooperation between Renault and GM, see above). This can hinder achievement of the optimum level of productivity or innovation. In that case, the entrepreneur needs to improve interaction techniques, for example by improving the information system to speed up the circulation of information, and improve the sharing of knowledge, maintaining the innovation capacity of the business and eliminating this form of X-inefficiency (cf. Figure (2)).
Technical inefficiency is measured by the illustrative distance η =M0T /M0M between the actual output of the DMU under evaluation (at the point M in Figure (2)) and the observable DMU achieving the maximum technically feasible output with the same capacity for innovation (at the point T in Figure (2)).
Congestion is a more severe form of X-inefficiency than technical X-inefficiency (Cooper et al., 2001; Brockett et al., 2004). It is a special phenomenon of the production process whereby larger amounts of some inputs cause lower levels of some outputs (F¨are and Svensson,
[image:8.595.283.535.63.196.2]1980). It is the lack of combinations and technical drivers for the available inputs that results in the excess, or under-utilization, of inputs. In practice this is why, in contrast to technical efficiency, X-efficiency is not easily attainable (Lins et al.,2004). In our case, it comes from the non-implementation of relevant patterns of interactions in certain areas of the collective design of the business. The lack of interaction leads to less innovation relative to the intensity of the innovation activities. Conversely, less innovation activity in a framework based on relevant patterns of interactions could lead to more innovation output and productivity. Indeed, the absence of interaction both increases the convergence phase towards the value, but does not optimize it17. Hence, within the same enterprise it is possible to find significant activity with
regard to knowing and creativity, but relatively lower innovative design and more strongly routinized organization.
Mathematically, the congestion phenomenon describes the non increasing relationship be-tween the maximum technically feasible in some outputs and inputs (F¨are and Svensson,1980). Beside, Zhu (2000) asserts that an input x is congested if the relative slack s+
x > 0 (cf.
Fig-ure (2)). According to this point of view, the slack between the actual innovation capacity of the DMU under evaluation (at the point M in Figure (2)) and that of the postulated efficient DMU (at the point E in Figure (2)) can be used to measuring the relative degree of congestion. Furthermore, the input excess can cause shortfall of productivity or decelerates the devel-opment of some innovation types. According to Tone and Sahoo(2004) andKao (2010), these losses in outputs are due to the congestion effect. Vis-a-vis to the definition given byF¨are and Svensson (1980), this last point of view on the congestion seems right. This form of loss is can be measured byβ =M0F/M0T (cf. Figure (2)).
In the F¨are’s literature (F¨are et al.,1985, chap.4),ηis the Farrell output measure of technical (in)efficiency, whileβis described as the measure of loss of output due to lack of output dispos-ability. In the same literature the measureφ =M0F/M0M =M0F/M0T ×M0T /M0M =β×η
is described as the weak output measure of technical efficiency. Kao (2010) well summarized all these points in his paper. This φ can be also obtained by the DEA-CCR model (Charnes et al.,1978). But here, if the congestion does not occur, we regardη as the shortfall of output due to the technical inefficiency. Else, if congestion occurs, η and β are regarded as the loss of output due to the congestion effect.
After deleting of β, another type of loss of output can occur ass−
y. Here, we define theβ as
the common loss on the whole of outputs (common effect) due to the congestion in the whole of activities, while thes−
y as the additional specific loss in each output if relative specific inputs
are congested. Here, the MOLP-DEA model directly provides the extreme efficient projections and removes this type of slack (Lins et al., 2004) andβ is regarded as the loss of the output y
due to the congestion in the whole of activities.
Finally, X-efficiency can be evaluated by the illustrative distance iotaιbetween the point M under evaluation and the efficient projection point E (cf. Figure (2)), proposed by Leibenstein and Maital (1992). In the next section, we will see some technical problems in the use of iota. We then use instead the Russell graphical distanceρ, which we describe in the section (3.2), in its place.
17
3. Measurement and Evaluation Models
3.1. Measurement of the innovation
Innovation intensity and innovation capacity are latent variables because they are not di-rectly measurable (Hansen, 2001; Guan et al., 2006). Nevertheless, they can be measured by elementary categorical indicator variables of observed activities of the process and of observed achieved innovation types in the enterprise (Appendix A). These variables are categorized into five groups from of each an aggregate indicator is constructed. The first four aggregate in-dicators represent the innovation capacity. To evaluate the innovation capacity or innovation intensity in practice, we model each activity or each element of each innovation type by a random variable.
Now let us consider various tuples of indicator variables (inAppendix A, there are 9 tuples except TFP). Here, a tuple xi = (xi1, xi2,· · ·, xipi)
18 defines a category i of p
i activities or an
innovation typexikfork = 1,· · · , pi(seeGrupp and Maital,2001, p.9 for the same formulation).
Clearly, each tuple is a discrete random vector. Then for k = 1,· · · , pi and for a DMUj 19, let
us pose:
xik,j =
(
1 ifxik is observed at DMUj
0 else (1)
If the indicator variable xik is ordered with l levels, it is decomposed into l new indicator
variables. Then thel new variables are treated in the same way as in the formulation (1) taking into account the order of levels (cf. Banker and Morey,1986). We aggregate the indicators xik,j
for the DMUj as follows:
xij = pi
X
k=1
xik,j (2)
If xij = (xi1,j, xi2,j,· · · , xipi,j) are activities, we consider the variable xij as the intensity of
activities of the DMUj in the category i. But we use the normalized intensity index:
xij =
1
pi pi
X
k=1
xik,j (3)
since it easily allows comparison of the intensity of activities of the same category of various DMUs in the same scale. Then xij ranges from 0 to 1. Hence, a DMU has a full innovation
capacity whenever all intensities of its activities are equals to 1, i.e. if there are all activities in its process.
In contrast, the innovation intensity alone can group various innovation types (cf.Appendix A). For this variable, we take an interest in its entirety (cf. section (2)). Then, we modify the formulation (3) into (4) to aggregate all innovation types as follows:
yj =
1
T
T
X
j=1
[1
pi pi
X
k=1
yik,j] (4)
whereT the number of innovation types and,pi the number of indicator variables in each
inno-18
We usexwhen we mean input andy for output.
19
vation type i. Likely, innovation intensity ranges from 0 to 1. In conjunction with section (1), a DMUj is innovative wheneveryj >0.
Obviously, the formulations (3) and (4) respectively provide a percentage of observed activ-ities and a weighted percentage of observed innovation types. Then their use can be abusive because for example two DMUs can have the same innovation capacity according the formu-lation (3) but with different activities. In this case, the comparison could be wrong. Then to prevent this problem, one can introduce the use of a similarity index before any evaluation to grouping the similar DMUs on the activities (e.g. see Deza and Deza, 2006, for the choice of similarity index).
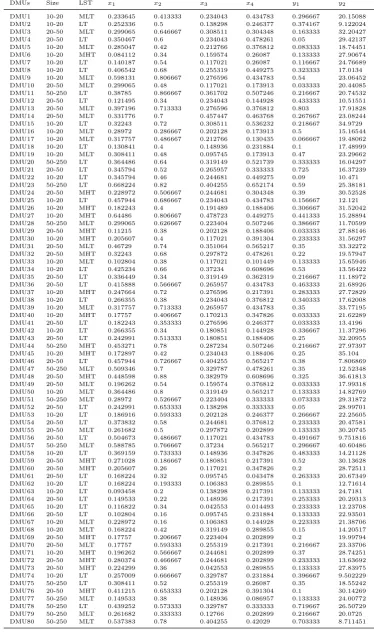
Finally, we use the total factor productivity (TFP) as second output indicator of the inno-vation process. It is obtained using an index calculated from the financial data of individual enterprises. Data are available in Table (B.6)
3.2. Evaluation of the X-efficiency
Suppose there are n DMUs, each usingm various inputs to produces various outputs. Let
x = (x1,· · · , xm) ∈ Rn+×m the inputs data matrix, y = (y1,· · · , ys) ∈ Rn+×s the outputs data
matrix. Here, these data are obtained by the way outlined in section (3.1). Let us recall that in the context of innovation process, we compare the actual amount of TFP and innovation intensity of the DMU under evaluation with that maximally realizable among existing DMUs with similar activities. As mentioned in section (1), we use the DEA model to evaluate this difference. In their approach, i.e. the input-oriented model, Leibenstein and Maital (1992) suggested the use of the weighted euclidean iota ι to take into account all aspects of the X-inefficiency.
Here, we generalize this index taking into account both inputs and outputs dimensions at the graphical distanceρ of Russell, enhanced by Pastor et al.(1999). For a DMU0, we present
its Russell graph efficiency measure under VRS version:
ρ= min 1 m m X i=1 θi 1 s s X r=1 φr
s.t.
n
X
j=1
λj.yrj ≥φr.yrj0; r= 1,· · · , s
n
X
j=1
λj.xij ≤θi.xij0; i= 1,· · · , m
n
X
j=1
λj = 1
φr ≥1, θi ≤1, λj ≥0; r= 1,· · · , s;i= 1,· · · , m;j = 1,· · · , n
(5)
where θi and φr are the efficiency components respectively in inputs and in outputs, λj the
coefficients of convex combination of the efficient peers units for the DMU0 under evaluation.
The MOLP-DEA approach suggests a set of efficient projections among them we can choose the nearest with respect to the distance defined by the objectives of the DMU under evalu-ation (Lins et al., 2004). Then, we use the MOLP-DEA to obtain θi and φr and, ρ results
therefrom. Through this model, we also evaluate the components of the X-inefficiency such as technical inefficiency and congestion (congestion effect and the degree of congestion). These elements determine the potential internal sources of X-inefficiency for each DMU. The MOLP-DEA model, defined in program (6), derives from the BCC output oriented model (Banker et al., 1984; Lins et al., 2004) as follows:
max (φ1,· · · , φs)
s.t.
n
X
j=1
λj.yrj ≥φr.yrj0; r= 1,· · ·, s
n
X
j=1
λj.xij ≤xij0; i= 1,· · · , m
n
X
j=1
λj = 1
φr ≥1, λj ≥0; r= 1,· · ·, s;j = 1,· · · , n
(6)
where (φ1,· · · , φs) are the weak output measures of technical efficiency. The program (6) can
be solved by various methods to find all non dominated solutions (φ1,· · · , φs) with the optimal
value of (λ1,· · · , λn). For example Zeleny (1974) has provided a complete dissertation with
some computational techniques for solving a such program. Let us note that MOLP-DEA and variant classical models, such as radial, additive or slack based models, provide the same efficient frontier but not the same efficient projection for each inefficient DMU (Hosseinzadeh Lotfi et al.,
2009).
Here like the classical models, the MOLP-DEA is computed in two stages. First it is to perform (φ, λ) = (φ1,· · · , φs, λ1,· · ·, λn). Secondly one evaluates the slack variabless−r (loss of
output r) and s+i (excess of input i) with new ˜λj by maximizing the second objective function
(Ps
r=1s
−
r +
Pm
i=1s+i ) by using the optimal value φ
∗
r obtained from the first stage as follows:
max (Ps
r=1s
−
r +
Pm
i=1s+i )
s.t.
n
X
j=1
˜
λj.yrj −s−r =φ
∗
r.yrj0; r= 1,· · ·, s
n
X
j=1
˜
λj.xij +s+i =xij0; i= 1,· · · , m
n
X
j=1
˜
λj = 1
s+i ,λ˜j ≥0; i= 1,· · · , m;j = 1,· · · , n
(7)
For a DMU0 under evaluation, the possible efficient projections are determined by the
coordi-nates:
ˆ
xij0 =xij0 −s
+
i ; i= 1,· · · , m
ˆ
yrj0 =φr.yrj0 +s −
r; r= 1,· · ·, s
(8)
LetEf f(j0) be the set of its possible efficient projections from the MOLP-DEA for the DMU0.
are two vectors of weights µ = (µ1,· · · , µm) and ν = (ν1,· · · , νs) respectively assigned to the
activities and the results. Let δµ,ν be a distance defined according to µ and ν (e.g. see Deza
and Deza, 2006, for the choice of distance). Then, we define the objective efficient projection or the most preferred solution (MPS, cf. Yang et al., 2009) for the DMU0 by:
DM U∗
0 = arg min
DM U∈Ef f(j0)
δµ,ν(DM U0, DM U) (9)
And then we define previous θi and φr in the program (5) as follows:
θi =
x∗
ij0
xij0
; i= 1,· · · , m
φr =
y∗
rj0
yrj0
; r= 1,· · ·, s
(10)
Clearly the DMU under evaluation is X-efficient wheneverρ= 1, i.e. θi =φr = 1 or equivalently
φr = 1 and s+i = 0; else it is X-inefficient. Each (1−1/φr) globally measures the shortfall in
each output and each (1−θi) measures the possible contraction in each input. Practically, we
may regard (1−θi) as the sufficient level of activities to avoid the obstruction of others activities
of the process (principle of parsimonious). Now we decompose each φr in order to determine
whether the losses are due to a simple technical inefficiency or/and a congestion effect.
In section (2), we have clarified that X-inefficiency can appear as technical form, congestion forms or both. Here the congestion effect causes the loss of output at (1−1/βr), while the
technical inefficiency causes the loss of output at (1−1/ηr) (cf. section (2)). Tone and Sahoo
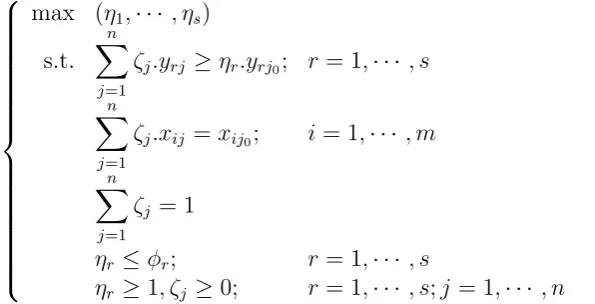
(2004) have developed a linear program model to obtain a radialη. But their model only detects the weak form of the congestion effect as mentioned Sueyoshi and Sekitani (2009). These last authors have enhanced and extended the Tone-Sahoo model in the multiple optimal projection cases in order to detect the strong form of the congestion effect. Here, we use this last model to compute the multiple ηr, formulated in program (11) as follows:
max (η1,· · · , ηs)
s.t.
n
X
j=1
ζj.yrj ≥ηr.yrj0; r= 1,· · · , s
n
X
j=1
ζj.xij =xij0; i= 1,· · · , m
n
X
j=1
ζj = 1
ηr ≤φr; r= 1,· · · , s
ηr ≥1, ζj ≥0; r= 1,· · · , s;j = 1,· · · , n
(11)
Here φr are provided from the formulation (10). When the DMU is in the congested area (cf.
Figure (2)), clearly we have ηr ≤φr for all r= 1,· · ·, s. As seen in section (2), we decompose
the weak output measure of technical efficiency φr by separating the technical inefficiency
ηr from congestion effect βr by the following relation φr = βr ×ηr (Tone and Sahoo, 2004;
[image:13.595.153.451.470.622.2]the shortfall in outputs due to the failure of interaction between activities. The index βr (or
1−1/βr) is the shortfall in outputs due to the absence of interaction between activities useless,
following the fruitless increase of inputs (F¨are and Svensson, 1980). For a group J of DMUs, this useless increase of activities, defined as the measure of the congestion rate or of the degree of congestion (Zhu,2000), can be measured as follows:
τi(J) =
X
J
s+i (J)
X
J
xi(J)
(12)
where s+
i (J) are the slacks in input i provided in program (6) for this group J. This quantity
enables us to appreciate the rate of under-utilization of innovation capacity in this category of activities.
4. Empirical analysis
Most of the data come from a representative sample of 80 innovative enterprises from the 803 SMEs in the manufacturing sector of the region of Normandy in France. These enterprises are divided following three stratum variables: (a) the size divided into three categories as less than 20 employees (10-20), from 20 to 50 employees (20-50), more than 50 employees (50-250); (b) the level of sector technology (LST) divided into three categories as lower technology (LT), Medium lower technology (MLT), medium high technology (MHT) (cf. Table (4)).
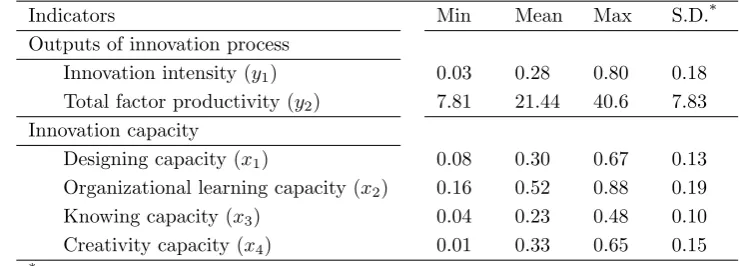
[image:14.595.169.539.469.602.2]The data are gathered through interviews with the entrepreneurs using a set of questions (Gaussens,2009) relating to the strategies and processes of the enterprise. The questions deal with the innovation strategy and innovation process that the entrepreneur followed from 2006 to 2008. In Table (2), we present the empirical distribution of the innovation capacity and the outcomes of innovation processes.
Table 2:
Descriptive statistics on the indicators.
Indicators Min Mean Max S.D.*
Outputs of innovation process
Innovation intensity (y1) 0.03 0.28 0.80 0.18
Total factor productivity (y2) 7.81 21.44 40.6 7.83
Innovation capacity
Designing capacity (x1) 0.08 0.30 0.67 0.13
Organizational learning capacity (x2) 0.16 0.52 0.88 0.19
Knowing capacity (x3) 0.04 0.23 0.48 0.10
Creativity capacity (x4) 0.01 0.33 0.65 0.15 *
Standard deviation.
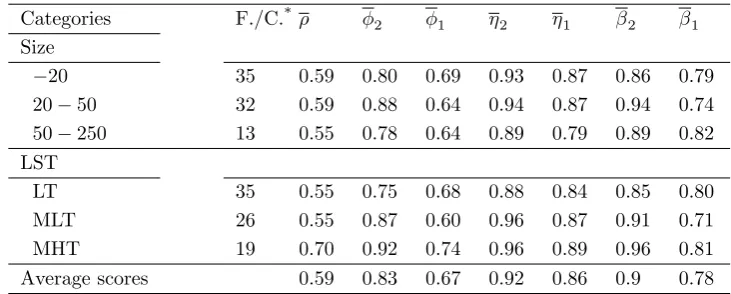
The empirical results are summarized in Table (4). Firstly, our estimations show the relative importance of X-inefficiency in the innovation processes of SMEs. About 71.25% of innovation processes are X-inefficient. In addition:
(b) In average, the X-inefficiency causes both about 13% of loss of productivity and 33% of loss of innovation intensity. In particular, the only congestion causes about 22% of loss of innovation intensity.
(c) Inefficiency in the innovation process appears most frequently as a congestion problem (significance level with respect to the Wilcoxon signed rank test for η1 > β1: 0.0510). In addition we observe non-zero rate of congestion in almost inefficient processes in at least one activity group. In particular, we find that 89.39% of inefficient processes have non-zero rates of congestion simultaneously in exploitation and exploration activities (respectively 20.04% and 20.19% following the formulation (12)). Creativity capacity and organizational learning capacity are particularly under-used and under-exploited: the congestion rate is significantly higher in these activities (respectively 25.49% and 27.58% against 6.55% in designing and 12.6% in knowing following the formulation (12)).
Secondly, this study enabled us to characterize the inefficiency in respect to innovation intensity and productivity:
(a) The average level of innovation output is lower in inefficient SMEs. Efficient innovation processes significantly generate instead higher productivity (significance level with respect to the Mann-Whitney test: 0.0267). However in innovation intensity, the difference in level is not significant (significance level with respect to the Mann-Whitney test: 0.4522).
(b) On average, inefficiency is significantly characterized more by a lack of innovation intensity than by a lack of productivity (cf. Table (4)):
• φ2 > φ1, (p.value= 0.0005)
• η2 > η1, (p.value= 0.0808)
[image:15.595.173.539.469.616.2]• β2 > β1, (p.value= 0.0005)
Table 4:
Average score results. Categories F./C.
*
ρ φ2 φ1 η2 η1 β2 β1
Size
−20 35 0.59 0.80 0.69 0.93 0.87 0.86 0.79 20−50 32 0.59 0.88 0.64 0.94 0.87 0.94 0.74 50−250 13 0.55 0.78 0.64 0.89 0.79 0.89 0.82 LST
LT 35 0.55 0.75 0.68 0.88 0.84 0.85 0.80 MLT 26 0.55 0.87 0.60 0.96 0.87 0.91 0.71 MHT 19 0.70 0.92 0.74 0.96 0.89 0.96 0.81 Average scores 0.59 0.83 0.67 0.92 0.86 0.9 0.78
*
Number of firms per category.
5. Characterization of X-inefficiency
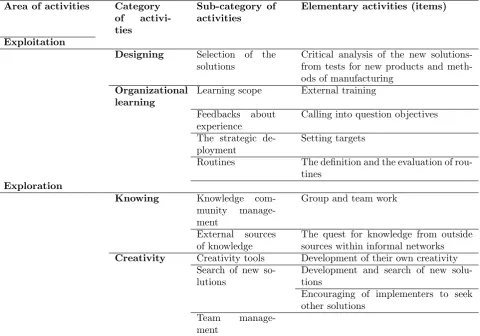
The first approach is to identify the congestion factor in the activities. The latter allows to reveal the nature of the association of activities generating the congestion to be highlighted. The exploratory analysis furthers our understanding of the congestion phenomenon, which has been quantified previously. The Table (B.6) describes the congested activities (cf. Appendix B).
This outcome suggests that the X-inefficiency of innovation processes in the enterprises is well characterized by the lack of integration in the exploration activities of the designing and learning process. They reveal interaction failures between on one hand the exploration activities of the implementers and the knowledge of external actors, and on the other hand, exploitation activities in the enterprise. It results in an under-exploitation of knowledge and experience of both implementers and external actors, which translates into less productive strategic de-ployment, feedback about experience, knowledge capitalization, selection of new solutions and external training. Indeed, the interaction failures between drivers and implementers or external actors in the process result in the lack of reliable feedback which weakens both the relevance of goals20 and the fact that they could be called into question - and the relevance of assessment of
rules, standards, procedures or routines. Conversely, the interaction’s failures between design-ing and usdesign-ing leads both to highly confused strategic intent - in terms of opportunity to create value - and to difficulties to in selecting the new solutions. This does not enable the actors in the innovation process both to either develop reciprocal knowledge or mutual understanding and to nor motivate themselves to explore in relevant areas.
6. Conclusion
This paper makes two contributions. Firstly we developed the concept of X-efficiency from the works of Leibenstein (1968, 1969, 1979) and adapted it to our proposed model of the innovation process. We have specified each component of X-inefficiency and their appropriate measure.
Secondly, we suggested the use of the combination of some efficiency measurement models such as both the multiobjective DEA and the Russell graph efficiency measure, to evaluate the global X-inefficiency of innovation process. The Russell graph approach enabled difficulties related to the index based on the proximity introduced by Leibenstein and Maital(1992) to be overcome. Here, the DEA model has made a good contribution to highlighting the difficulties that the majority of entrepreneurs have in managing their innovation processes and identifying the internal sources of X-inefficiency.
From an X-inefficiency analysis based on interaction failure between exploitation and ex-ploration, we show that the X-inefficiency of the innovation processes mainly assumes the congestion form as the fundamental source of under-utilization of innovation capacity. In par-ticular, this involves organizational learning and creativity. This result is discussed as the non-implementation by the entrepreneur of efficient rules or standards of interaction in certain areas of the collective design of the business.
Beyond a simple approach that explains productivity directly by innovation intensity, our approach suggests that innovation process efficiency may account for greater productivity, and that higher innovation intensity could explain higher efficiency through a learning effect. Fi-nally, higher productivity could explain higher innovation intensity through a self-selection
20
effect. Further work will need to develop these lines of research and to achieve a more realistic approach to process innovation in SMEs.
Acknowledgements
This work forms part of the Government-Region Project Contract (2007-2013) and benefits the European Regional Development Fund. Thanks are due to Pr. Walter Briec (CAEPEM, University of Perpignan Via Domitia) and Pr. Mohamed Didi-Biha (LMNO, University of Caen Basse Normandie) for their valuable comments and suggestions of this article. Thanks also are due to the IDEIS Project team and the staff of the Maison de la Recherche en Sciences Humaines (MRSH, University of Caen Basse Normandie) for their logistical support.
Appendix A. Description of indicators
Designing activities
• Design methods (12 items)
• Designing scope (11 items)
• Market needs identification (7 items)
• Products and methods description (20 items)
• Change and areas of exploration (11 items)
• Selection of solutions (28 items)
• Risk management (5 items)
• Project management (4 items)
• Human resources management (1 item)
Organizational learning activities
• Learning scope (9 items)
• Feedbacks about experiments (3 items)
• Experimentations with new situations (5 items)
• Strategic deployment (2 items)
• Routines (6 items)
• Working group on problem solving methods (1 item)
Knowing activities
• Knowing scope (7 items)
• External sources of knowledge (36 items)
• Risk management (1 item)
• Knowledge community management (13 items)
• Funding research (1 item)
• Human resources management (4 items)
Creativity activities
• Creativity tools (7 items)
• Search for new solutions (9 items)
• Team management (5 items)
Innovation types (innovation intensity)
• Product innovation achieved (2 items)
• Process innovation achieved (4 items)
• Marketing innovation achieved (5 items)
• Organization innovation achieved (5 items)
• Other indicators of innovation intensity (6 items)
Total factor productivity TFP (see Grupp and Maital, 2001, p.136 for the model used)
T F P =V A/(Lα.K1−α)
• V A: overall value added
• L: number of employees
• K: capital
Appendix B. Data and Results
Table B.6:
Data (cf. section (3.1))
DMUs Size LST x1 x2 x3 x4 y1 y2
Table B.8:
Results of evaluation by MOLP-DEA (cf. section (3.2))
DMUs ρ φ2 φ1 η2 η1 β2 β1 s+1 s +
2 s
+
3 s
+
4 s−2 s−1
Table B.9:
Characterizations of the X-inefficiency by the congested activities
Area of activities Category of activi-ties
Sub-category of activities
Elementary activities (items)
Exploitation
Designing Selection of the solutions
Critical analysis of the new solutions-from tests for new products and meth-ods of manufacturing
Organizational learning
Learning scope External training
Feedbacks about experience
Calling into question objectives
The strategic de-ployment
Setting targets
Routines The definition and the evaluation of rou-tines
Exploration
Knowing Knowledge com-munity manage-ment
Group and team work
External sources of knowledge
The quest for knowledge from outside sources within informal networks
Creativity Creativity tools Development of their own creativity Search of new
so-lutions
Development and search of new solu-tions
Encouraging of implementers to seek other solutions
Team manage-ment
Cf.Appendix Afor the categories and the sub-categories.
References
Adler, P. S., Benner, M., Brunner, D. J., MacDuffie, J. P., Osono, E., Staats, B. R., Takeuchi, H., Tushman, M. L., and Winter, S. G. (2009). Perspectives on the productivity dilemma. Journal of Operations Management, 27(2):99–113.
Amit, R. and Schoemaker, P. J. (1993). Strategic assets and organizational rent. Strategic Management Journal, 14(1):3346.
Banker, R. D., Charnes, A., and Cooper, W. W. (1984). Some Models for Estimating Technical and Scale Inefficiencies in Data Envelopment Analysis. Management Science, 30(9):1078– 1092.
Banker, R. D. and Morey, R. (1986). Efficiency analysis for exogenously fixed inputs and outputs. Operations Research, 34(4):513521.
Charnes, A., Cooper, W. W., and Rhodes, E. (1978). Measuring the efficiency of decision making units. European Journal of Operational Research, 2(6):429–444.
Chesbrough, H. and Rosenbloom, R. S. (2002). The role of the business model in capturing value from innovation: evidence from Xerox Corporation’s technology spin-off companies. Industrial and Corporate Change, 11(3):529–555.
Chiesa, V., Coughlan, P., and Voss, C. A. (1996). Development of a Technical Innovation Audit. Journal of Product Innovation Management, 13(2):105–136.
Cohen, W. M. (1995). Empirical studies of innovative activity. In Stoneman, P., editor, Hand-book of the Economics of Innovation and Technological Change, volume 182, pages 182–264. Blackwell Publishers Ltd.
Cooper, W., Gu, B., and Li, S. (2001). Comparisons and evaluations of alternative approaches to the treatment of congestion in DEA. European Journal of Operational Research, 132(1):62 – 74.
Deza, M. and Deza, E. (2006). Dictionary of Distances. Elsevier Science.
Dodgson, M. and Hinze, S. (2000). Indicators used to measure the innovation process: defects and possible remedies. Research Evaluation, 8(2):101–114.
F¨are, R., Grosskopf, S., and Lovell, C. (1985). The Measurements of Efficiency of Production. Studies in Productivity Analysis. Springer.
F¨are, R. and Lovell, C. K. (1978). Measuring the technical efficiency of production. Journal of Economic Theory, 19(1):150–162.
F¨are, R. and Svensson, L. (1980). Congestion of production factors. Econometrica, 48(7):1745– 1753.
Forsman, H. (2011). Innovation capacity and innovation development in small enterprises. A comparison between the manufacturing and service sectors. Research Policy, 40(5):739–750.
Gaussens, O. (2009). Innovation Capacity of SMEs: Business Models and Innovation Patterns. University of Caen Basse Normandie, France. Survey Support, French edition.
Gobbo Jr., J. A. and Olsson, A. (2010). The transformation between exploration and exploita-tion applied to inventors of packaging innovaexploita-tions. Technovation, 30(56):322 – 331.
Grupp, H. and Maital, S. (2001). Managing new product development and innovation. Edward Elgar, first edition.
Guan, J., Yam, R. C., Mok, C. K., and Ma, N. (2006). A study of the relationship between competitiveness and technological innovation capability based on DEA models. European Journal of Operational Research, 170(3):971–986.
Hansen, J. (2001). Technology innovation indicators. In Feldman, M. P. and Link, A. N., editors,Innovation Policy in the Knowledge-Based Economy, pages 73–103. Springer.
Hatchuel, A., Le Masson, P., and Weil, B. (2002). De la gestion des connaissances aux organi-sations orient´ees conception. Revue internationale des sciences sociales, 1(171):29–42.
Hatchuel, A. and Weil, B. (2009). C-K design theory: an advanced formulation. Research in Engineering Design, 19:181–192.
He, Z.-L. and Wong, P.-K. (2004). Exploration vs. Exploitation: An Empirical Test of the Ambidexterity Hypothesis. Organization Science, 15(4):481–494.
Holmqvist, M. (2004). Experiential Learning Processes of Exploitation and Exploration within and between Organizations: An Empirical Study of Product Development. Organization Science, 15(1):70–81.
Hosseinzadeh Lotfi, F., Noora, A., Jahanshahloo, G., Jablonsky, J., Mozaffari, M., and Gerami, J. (2009). An MOLP based procedure for finding efficient units in DEA models. Central European Journal of Operations Research, 17:1–11.
Izenman, A. J. (2008). Modern Multivariate Statistical Techniques: Regression, Classification, and Manifold Learning. Springer Texts in Statistics. Springer.
Kao, C. (2010). Congestion measurement and elimination under the framework of data envel-opment analysis. International Journal of Production Economics, 123(2):257–265.
Kline, S. J. and Rosenberg, N. (1986). An overview on innovation. In Landau, R. and Rosenberg, N., editors, The Positive Sum Strategy: Harnessing Technology for Economic Growth, pages 275–306. National Academy of Sciences.
Le Masson, P. and Weil, B. (2010). La conception innovante comme mode d’extension et de r´eg´en´eration de la conception r´egl´ee: les exp´eriences oubli´ees aux origines des Bureaux d’´etudes. Entreprises et histoire, 1(58):51–73.
Le Masson, P., Weil, B., and Hatchuel, A. (2010). Strategic Management of Innovation and Design. Cambridge University Press.
Leibenstein, H. (1968). Entrepreneurship and Development. The American Economic Review, 58(2):72–83.
Leibenstein, H. (1969). Organizational or Frictional Equilibria, X-Efficiency, and the Rate of Innovation. The Quarterly Journal of Economics, 83(4):pp. 600–623.
Leibenstein, H. (1979). X-Efficiency: From Concept to Theory. Challenge, 22(4):13–22.
Leibenstein, H. and Maital, S. (1992). Empirical Estimation and Partitioning of X-Inefficiency: A Data Envelopment Approach. The American Economic Review, 82(2):428–433.
Lins, M. P. E., Angulo-Meza, L., and Silva, A. C. M. (2004). A Multi-Objective Approach to Determine Alternative Targets in Data Envelopment Analysis.The Journal of the Operational Research Society, 55(10):pp. 1090–1101.
March, J. G. (1991). Exploration and Exploitation in Organizational Learning. Organization Science, 2(1):71–87.
Morel, C. (2012). Les d´ecisions absurdes: Tome 2, Comment les ´eviter, volume 2. Editions Gallimard.
Nooteboom, B. (2001). Learning and Innovation in Organizations and Economies. Oxford University Press, third edition.
OECD, editor (2005). OSLO Manual : Guidelines for Collecting and Interpreting Innovation Data. OECD Publishing, third edition.
Pastor, J., Ruiz, J., and Sirvent, I. (1999). An enhanced DEA Russell graph efficiency measure. European Journal of Operational Research, 115(3):596 – 607.
Pfeffer, J. and Sutton, R. (2006). Hard Facts, Dangerous Half-Truths, and Total Nonsense: Profiting from Evidence-based Management. Harvard Business Press.
Ponssard, J.-P. and Tanguy, H. (1993). Planning in firms as an interactive process. Theory and Decision, 34:139–159.
Rothwell, R. and Dodgson, M. (2004). Innovation and size of firm. In Rothwell, R. and Dodgson, M., editors, The handbook of industrial innovation, pages 310–324. Edward Elgar.
Sch¨on, D. A. (1984). Problems, frames and perspectives on designing. Design Studies, 5(3):132– 136.
Simon, H. A. (1969). The Sciences of the Artificial. MIT Press, 3 edition.
Simon, H. A., editor (1986). Decision Making and Problem Solving. National Academy Press.
Sueyoshi, T. and Sekitani, K. (2009). DEA congestion and returns to scale under an occurrence of multiple optimal projections. European Journal of Operational Research, 194(2):592 – 607.
Tone, K. and Sahoo, B. K. (2004). Degree of scale economies and congestion: A unified DEA approach. European Journal of Operational Research, 158(3):755–772.
Tushman, M. L. and O’Reilly, C. A. (1997). Winning Through Innovation: A Practical Guide to Leading Organizational Change and Renewal. Harvard Business School Pr.
Tushman, M. L. and O’Reilly, C. L. (1996). Ambidextrous organizations: Managing evolution-ary and revolutionevolution-ary change. California Management Review, 8(29):8–29.
Yang, J.-B., Wong, B. Y., Xu, D.-L., and Stewart, T. J. (2009). Integrating DEA-oriented per-formance assessment and target setting using interactive MOLP methods. European Journal of Operational Research, 195(1):205 – 222.
Zeleny, M. (1974). Linear multiobjective programming. Lecture notes in economics and mathe-matical systems. Springer-Verlag.