IJPSR (2019), Volume 10, Issue 7 (Research Article)
Received on 12 October 2018; received in revised form, 03 January 2019; accepted, 03 January 2019; published 01 July 2019
SIMULTANEOUS ESTIMATION OF ATORVASTATIN AND CLOPIDOGREL BY SIMULTANEOUS EQUATION METHOD IN CAPSULE DOSAGE FORM
T. S. Vishwas *, B. M. Gurupadayya, R. Maruthi and Rupshee Jain
Department of Pharmaceutical Chemistry, JSS College of Pharmacy, JSS Academy of Higher Education and Research, Mysuru - 570015, Karnataka, India.
ABSTRACT: The current work is intended towards the development of a simple, rapid and precise UV-Visible spectrophotometric method for the simultaneous estimation of Atorvastatin (ATR) and Clopidogrel (CP) present in the marketed formulation using UV simultaneous equation. Methanol was used as a solvent and the absorbance of the drug was measured at the absorbance maxima (λmax) of Atorvastatin & Clopidogrel, UV 246 nm & 202 nm respectively. Calibration curve plotted in concentration range 5-25 μg/mL exhibited an excellent linear relationship for both Atorvastatin and Clopidogrel. The method was found to comply all the validation parameters as per the ICH guideline, such as accuracy (mean recovery = 99.97%), precision, and linearity (r2 = 0.9934). The method showed good reproducibility and recovery with % RSD in the favorable range indicating the sensitivity of the method towards analyte. This method can be effectively employed for the day to day analysis of both drugs in the capsule dosage form.
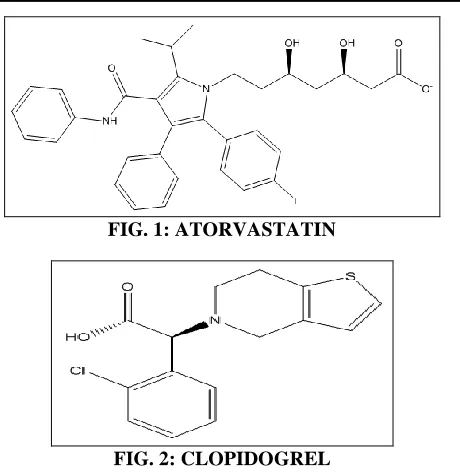
INTRODUCTION: Atorvastatin Fig. 1 is a derivative of pyrrole and heptanoic acid and is an Inhibitor Hydroxymethylglutaryl-CoA Reductase. Hence is used as Antihyperlipidemic Agent to reduce serum levels of LDL-Cholesterol; Apolipoprotein B; and Triglycerides to prevent Cardiovascular diseases in patients with multiple risk factors by increasing the serum levels of HDL-Cholesterol 1-3. Clopidogrel Fig. 2 is a platelet aggregation inhibitor which is used in the patients with the risk of stroke and myocardial infarction in patients suffering from atherosclerosis. Clopidogrel has been associated with rare instances of distinctive, clinically apparent acute liver injury 2, 4.
QUICK RESPONSE CODE
DOI:
10.13040/IJPSR.0975-8232.10(7).3305-10
The article can be accessed online on
www.ijpsr.com
[image:1.612.328.558.440.676.2]DOI link: http://dx.doi.org/10.13040/IJPSR.0975-8232.10(7).3305-10
[image:1.612.49.298.640.726.2]FIG. 1: ATORVASTATIN
FIG. 2: CLOPIDOGREL
The literature review showed there are some HPLC methods 5-10, UV and spectrophotometric methods
11-13
, HPTLC14 method and electrophoresis method
15
for the estimation of ATR and CP.
Keywords: Atorvastatin, Clopidogrel, Simultaneous equation method, ICH
Guidelines Correspondence to Author: Abdullah Hasan Jabbar M. Pharm,
Department of Pharmaceutical Chemistry, JSS College of Pharmacy, JSS Academy of Higher Education and Research, Mysuru - 570015, Karnataka, India.
The combination of atorvastatin and clopidogrel is given for the treatment and management of primary hypercholesterolemia, combined hyperlipidemia,
heterozygous or homozygous familial
hypercholesterolemia. Atorvastatin + Clopidogrel is also prescribed to reduce the atherosclerotic events in patients with a history of recent MI or true peripheral arterial disease or stroke 1-4.
OBJECTIVE: The current work objective is to develop a novel-selective and validated spectrophotometric determination of Atorvastatin and Clopidogrel using methanol as a solvent in the pharmaceutical dosage form.
MATERIALS AND METHOD:
Instrumentation: The instrument used to measure the absorbance of the working solutions was a Shimadzu UV-Visible spectrophotometer of model UV 1700 with UV probe software. A Shimadzu AW120 Digital analytical balance and Equitron ultra sonicator were used in the study.
Method Development:
Selection of Solvent: Different solvents were used to test the solubility of ATR and CP. Both the drugs were soluble in methanol but partially soluble in a solvent like water and ethanol. So, methanol was selected as the solvent and diluent for this work.
Determination of Absorption Maxima:
Standard Solution of Atorvastatin and Clopidogrel: 100 mg of Atorvastatin and Clopidogrel was precisely weighed and transferred into two clean and dry 100 ml volumetric flask, methanol was added to produce 100 ml of stock solution to get a concentration of 1000 μg/mL. 5 mL of the stock was transferred into 100 mL volumetric flask, and the volume was made up to 100 mL to get a sub-stock of 50 μg/mL.
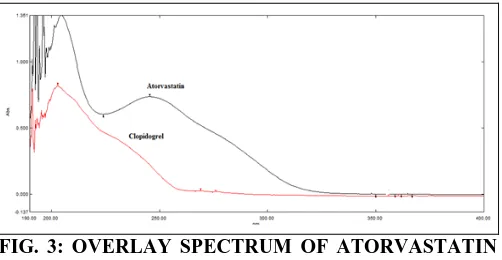
FIG. 3: OVERLAY SPECTRUM OF ATORVASTATIN AND CLOPIDOGREL
Determination: For determination of ƛmax of both
the drugs working solutions were prepared by pipetting out 1 mL sub-stock into two 10mL volumetric flasks and scanned in spectrum mode in the UV range of 200 nm to 400 nm. Both ATR and CP showed the maximum absorbance at 246 nm and 202 nm respectively as shown in Fig. 3.
Preparation of Calibration Curve:
Working Standard Solutions: The sub-stock solutions of both ATR and CP of volume 1, 2, 3, 4 & 5 mL was further pipetted out to separate 10mL volumetric flask and diluted to 10 mL to get the concentrations of 5, 10, 15, 20 and 25 μg/mL respectively.
Calibration Curve of ATR and CP: The wavelength selected to measure the absorbance of both working standard was 246 nm and 202 nm. Methanol was used as the blank. A later calibration curve was plotted by taking respective absorbance
v/s concentration (µg/ml) & the regression equation was found out.
Simultaneous Equation Method: If a sample contains two absorbing drugs, each of which absorbs at the λmax of the other, it may be possible
to determine both drugs simultaneously using multicomponent analysis UV Spectrophotometric ‘Simultaneous Equation Method.
Two simultaneous equations (in two variables Cx and Cy) were formed using these Absorptivity coefficient values. Concentrations in the sample were obtained by using the following equations
CX =A2ay1−A1ay2 / ax1ay2−ax2ay1……(1)
Cy =A1ax1−A2ax1 / ax1ay2−ax2ay1…….(2)
Where, A1 and A2 are absorbance’s of the mixture at 246 nm and 202 nm respectively, ax1 and ax2 are absorptivities of Atorvastatin at 2 wavelengths respectively and ay1 and ay2 are absorptivity of Clopidogrel at 2 wavelengths respectively. Cx and Cy are concentrations of Atorvastatin and Clopidogrel respectively.
[image:2.612.49.300.614.744.2]the powder equivalent to 100 mg of ATR was transferred to a 100 mL volumetric flask and filtered through Whatmann filter paper. Required concentration of 5 µg/ml of both the drugs was made by making necessary dilutions with methanol.
Validation of Method: The current method was validated according to the parameters of ICH guidelines like linearity, accuracy, intraday and interday precision, LOD, LOQ and ruggedness 15,
16
.
Range and Linearity: The standard solution of 5 different concentration of ATR and CP ranging between 5-25 µg/ml was prepared to study the linearity of both the drugs. Linearity was evaluated regarding slope and regression analysis.
Precision: Precision is defined as the closeness of the readings obtained by multiple measurements of the same sample under prescribed conditions. Intraday and interday precision are considered for the precision studies.
Intraday Precision: The absorbance of the sample solutions of ATR and CP at the concentrations of 5, 15 and 25 µg/mL was measured three times on the same day and % RSD was found out.
Interday Precision: The absorbance of the sample solutions of ATR and CP at the concentrations of 5, 15 and 25 µg/mL was measured on three alternative days and % RSD was found out.
Accuracy: Accuracy is the closeness of the measured value to the actual value. The accuracy of the method was determined by carrying out the recovery studies. The recovery studies were carried out by spiking the previously analyzed sample solution of the formulation with the standard drug solution.
Limit of Detection (LOD): According to ICH guidelines LOD can be calculated by the following equation.
LOD = 3.3 × (N/S)
Limit of Quantification (LOQ): According to ICH guidelines LOQ can be calculated by the following equation.
LOQ = 10 × (N/S)
Where S is the slope of the calibration curve and N is the standard deviation of peak areas.
Ruggedness: Ruggedness is the capacity of an analytical method to give satisfactory results by small, deliberate variations in method parameters.
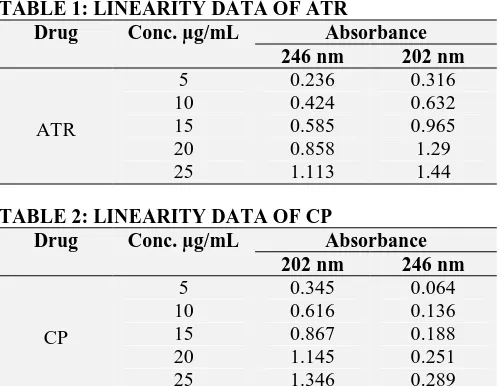
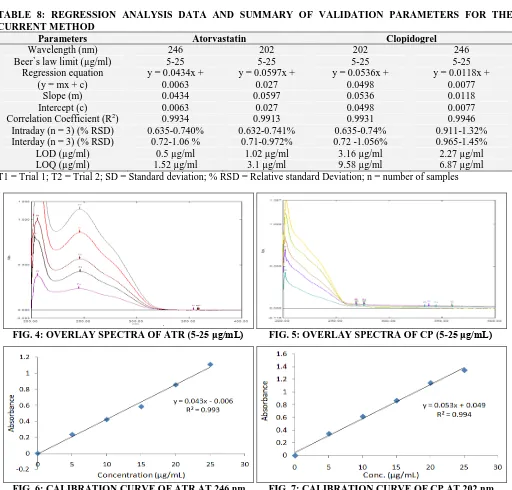
[image:3.612.315.565.331.524.2]RESULTS AND DISCUSSION: The solutions of ATR and CP in a concentration range of 5 µg/ml was scanned in a range of 400-200 nm to determine the wavelength for the estimation. The maximum absorbance of ATR and CP was obtained at 246 nm and 202 nm respectively. It is shown in Fig. 3 Linearity and Range: The linearity of both ATR and CP was found to be in the range of 5-25 µg/ml. The data for linearity ATR and CP is shown in Table 1 and 2 respectively. The overlay spectra and calibration curves of ATR and CP is shown in Fig. 4, 5, 6 and 7 respectively.
TABLE 1: LINEARITY DATA OF ATR
Drug Conc. µg/mL Absorbance
246 nm 202 nm
ATR
5 0.236 0.316
10 0.424 0.632
15 0.585 0.965
20 0.858 1.29
25 1.113 1.44
TABLE 2: LINEARITY DATA OF CP
Drug Conc. µg/mL Absorbance
202 nm 246 nm
CP
5 0.345 0.064
10 0.616 0.136
15 0.867 0.188
20 1.145 0.251
25 1.346 0.289
Precision:
Intraday Precision: The intraday precision of ATR and CP in terms of % RSD was found to be 0.635-0.740% and 0.632-0.741% for ATR at 246 and 202 nm and 0.635-0.74% and 0.911-1.32% for CP at 202 nm and 246 nm respectively.
Interday Precision: The intraday precision of ATR and CP in terms of % RSD was found to be 0.72-1.06% and 0.71-0.972% for ATR at 246 and 202 nm 0.72 -1.056% and 0.965-1.45% for CP at 202 and 246 nm respectively.
CP at 202 nm was found to be 1.02 µg/ml and 3.16 µg/ml respectively as depicted in Table 8.
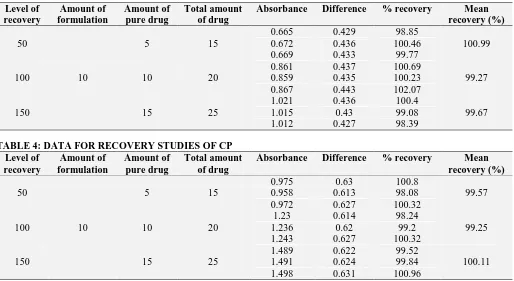
Accuracy: Recovery studies evaluated the ability of the method to give accurate results after spiking the marketed formulation at 50%, 100%, and 150%
[image:4.612.52.566.153.434.2]with the standard drug solution. The % recovery of ATR and CP was found to be in the range of 99.27-100.29% and 99.25-100.11%. The recovery studies data of ATR and CP is shown in Table 3 and 4 respectively.
TABLE 3: DATA FOR RECOVERY STUDIES OF ATR Level of
recovery
Amount of formulation
Amount of pure drug
Total amount of drug
Absorbance Difference % recovery Mean
recovery (%) 50
10
5 15
0.665 0.429 98.85
100.99 0.672 0.436 100.46
0.669 0.433 99.77
100 10 20
0.861 0.437 100.69
99.27 0.859 0.435 100.23
0.867 0.443 102.07
150 15 25
1.021 0.436 100.4
99.67 1.015 0.43 99.08
1.012 0.427 98.39
TABLE 4: DATA FOR RECOVERY STUDIES OF CP Level of
recovery
Amount of formulation
Amount of pure drug
Total amount of drug
Absorbance Difference % recovery Mean
recovery (%) 50
10
5 15
0.975 0.63 100.8
99.57 0.958 0.613 98.08
0.972 0.627 100.32
100 10 20
1.23 0.614 98.24
99.25
1.236 0.62 99.2
1.243 0.627 100.32
150 15 25
1.489 0.622 99.52
100.11 1.491 0.624 99.84
1.498 0.631 100.96
Ruggedness: Ruggedness studies were carried out by changing the analyst and by changing the instrument for both the drugs by scanning each
[image:4.612.48.563.496.743.2]concentration three times at both the wavelengths and later the % RSD was found out. Ruggedness studies data is shown in Table 5 and 6.
TABLE 5: RUGGEDNESS STUDIES OF ATR AT 246 nm
Drug Wavelength Conc. (µg/mL) T1 T2 Mean SD % RSD
By changing the analyst
0 0 0 0 0 0
5 0.232 0.235 0.2335 0.002121 0.9084884
10 0.415 0.419 0.417 0.002828 0.6782799
15 0.573 0.565 0.569 0.005657 0.9941747
20 0.847 0.853 0.85 0.004243 0.4991342
25 1.107 1.119 1.113 0.008485 0.7623793
ATR 246 nm By changing the instrument
0 0 0 0 0 0
5 0.23 0.232 0.231 0.001414 0.6122137
5 0.416 0.412 0.414 0.002828 0.683195
15 0.571 0.575 0.573 0.002828 0.4936173
20 0.846 0.853 0.798 0.00495 0.6202691
25 1.11 1.102 1.106 0.005657 0.5114696
TABLE 6: RUGGEDNESS STUDIES OF CP AT 202 nm
Drug Wavelength Conc. (µg/mL) T1 T2 Mean SD % RSD
By changing the analyst
5 0.065 0.066 0.0655 0.000707 1.0795523
10 0.134 0.136 0.135 0.001414 1.0475656
15 0.186 0.183 0.1845 0.002121 1.1497671
20 0.249 0.253 0.251 0.002828 1.1268634
25 0.291 0.287 0.289 0.002828 0.9786945
CP 202 nm By changing the instrument
0 0 0 0 0 0
5 0.061 0.062 0.0615 0.000707 1.1497671
5 0.137 0.135 0.136 0.001414 1.0398629
15 0.187 0.19 0.1885 0.002121 1.1253689
20 0.251 0.258 0.798 0.00495 0.6202691
[image:5.612.48.564.56.253.2]25 0.295 0.291 0.293 0.002828 0.9653335
TABLE 7: ANALYSIS OF MARKETED FORMULATION
Tablet Drug Label claim (mg) Amount found % Label claim
Clopitorva 10 Atorvastatin 10 9.68 96.8
Clopidogrel 75 73.32 97.76
TABLE 8: REGRESSION ANALYSIS DATA AND SUMMARY OF VALIDATION PARAMETERS FOR THE CURRENT METHOD
Parameters Atorvastatin Clopidogrel
Wavelength (nm) 246 202 202 246
Beer`s law limit (µg/ml) 5-25 5-25 5-25 5-25
Regression equation (y = mx + c)
y = 0.0434x + 0.0063
y = 0.0597x + 0.027
y = 0.0536x + 0.0498
y = 0.0118x + 0.0077
Slope (m) 0.0434 0.0597 0.0536 0.0118
Intercept (c) 0.0063 0.027 0.0498 0.0077
Correlation Coefficient (R2) 0.9934 0.9913 0.9931 0.9946 Intraday (n = 3) (% RSD) 0.635-0.740% 0.632-0.741% 0.635-0.74% 0.911-1.32% Interday (n = 3) (% RSD) 0.72-1.06 % 0.71-0.972% 0.72 -1.056% 0.965-1.45% LOD (µg/ml) 0.5 µg/ml 1.02 µg/ml 3.16 µg/ml 2.27 µg/ml LOQ (µg/ml) 1.52 µg/ml 3.1 µg/ml 9.58 µg/ml 6.87 µg/ml T1 = Trial 1; T2 = Trial 2; SD = Standard deviation; % RSD = Relative standard Deviation; n = number of samples
FIG. 4: OVERLAY SPECTRA OF ATR (5-25 μg/mL) FIG. 5: OVERLAY SPECTRA OF CP (5-25 μg/mL)
[image:5.612.51.563.258.748.2]CONCLUSION: A Novel, simple, sensitive and economic UV spectrophotometric method has been developed for the routine analysis of Atorvastatin and Clopidogrel in the capsule dosage form. This method is suitable for the simultaneous analysis of ATR and CP in the multi-component formulation without the interference of one another. This method is recommended for the routine quality control analysis of the marketed formulation.
ACKNOWLEDGEMENT: The authors express their sincere regards to Micro Labs, Bengaluru, India, for providing the gift samples of Atorvastatin and Clopidogrel, Authors also extend their regards to the Principal, JSS College of Pharmacy, JSS Academy of Higher Education and Research, Mysuru for providing the facilities to carry out the present work.
CONFLICT OF INTEREST: The authors declare no conflict of interest for Current work.
REFERENCES:
1. Indian Pharmacopoeia, Vol. II, New Delhi: the controller of publications, Govt. of India 1996: 347
2. Goodman LS: Goodman and Gilman's the pharmacological basis of therapeutics. New York: McGraw-Hill 1996.
3. British Pharmacopoeia. Vol. 2 HMSO Publication centre, London 1993: 55.
4. US Pharmacopoeia, 23rd edition us Pharmacopeial convention, Rockville MD 1995: 77.
5. Nagavi BJ and Gurupadayya BA: Simultaneous estimation of clopidogrel and atorvastatin in human plasma using bio-analytical RP-Ultra fast liquid chromatographic method. International Journal of Current Pharmaceutical Research 2015; 7(1): 30-5.
6. Londhe SV, Deshmukh RS, Mulgund SV and Jain KS: Development and validation of a reversed-phase HPLC method for simultaneous determination of aspirin, atorvastatin calcium and clopidogrel bisulphate in capsules. Indian Journal of Pharmaceutical Sciences 2011; 73(1): 23.
7. Panda SS: Ion-pairing RP-HPLC method for simultaneous determination of aspirin and clopidogrel bisulphate in tablet and capsule dosage form. Int J Pharm Tech Res 2010; 2: 269-73.
8. An K, Ayyappan T, Raman VR, Vetrichelvan T, Sankar AS and Nagavalli D: RP-HPLC analysis of aspirin and clopidogrel bisulphate in combination. Indian Journal of Pharmaceutical Sciences 2007; 69(4): 597.
9. Patel RB, Shankar MB, Patel MR and Bhatt KK: Simultaneous estimation of acetylsalicylic acid and clopidogrel bisulfate in pure powder and tablet formulations by high-performance column liquid chromatography and high-performance thin-layer chromatography. Journal of AOAC International 2008; 91(4): 750-5.
10. Peer CJ, Spencer SD, VanDenBerg DA, Pacanowski MA, Horenstein RB and Figg WD: A sensitive and rapid ultra HPLC–MS/MS method for the simultaneous detection of clopidogrel and its derivatized active thiol metabolite in human plasma. Journal of Chromatography B 2012; 880: 132-9.
11. Darwish HW, Hassan SA, Salem MY and El-Zeiny BA: Three different spectrophotometric methods manipulating ratio spectra for determination of binary mixture of Amlodipine and Atorvastatin. Spectrochimica Acta Part A: Molecular and Biomolecular Spectroscopy 2011; 83(1): 140-8.
12. Kunturkar KL and Jain HK: Development and validation of UV spectrophotometric method for determination of s(-) metoprolol succinate and clopidogrel bisulphate in bulk and tablet dosage form. International Journal of Pharmacy and Pharmaceutical Sciences 2013; 5(3): 593-8.
13. Game MD, Gabhane KB and Sakarkar DM: Quantitative analysis of clopidogrel bisulphate and aspirin by first derivative spectrophotometric method in tablets. Indian Journal of Pharmaceutical Sciences 2010; 72(6): 825. 14. Londhe SV, Mulgund SV, Deshmukh RS and Jain KS:
Simultaneous HPTLC analysis of aspirin, atorvastatin calcium and clopidogrel bisulphate in the bulk drug and capsules. Acta Chromatographica 2010; 22(2): 297-05. 15. AlShehri MM: A validated capillary electrophoresis
method for simultaneous determination of ezetimibe and atorvastatin in pharmaceutical formulations. Saudi Pharmaceutical Journal 2012; 20(2): 143-8.
16. ICH, Q1A (R2) Stability testing of new drug substances and products in International Conference on Harmonization, Geneva Switzerland 2003.
17. ICH, Q2B Validation of Analytical Procedures: Methodology. International Conference on Harmonization, Geneva, Switzerland 1996.
All © 2013 are reserved by International Journal of Pharmaceutical Sciences and Research. This Journal licensed under a Creative Commons Attribution-NonCommercial-ShareAlike 3.0 Unported License.
This article can be downloaded to Android OS based mobile. Scan QR Code using Code/Bar Scanner from your mobile. (Scanners are available on Google Play store)
How to cite this article: