Longo, Matthew R. and Morcom, R. (2016) No correlation between distorted
body representations underlying tactile distance perception and position
sense. Frontiers in Human Neuroscience 10 , pp. 593-601. ISSN
1662-5161.
Downloaded from:
Usage Guidelines:
Please refer to usage guidelines at or alternatively
RUNNING HEAD: Distortions in Touch and Position Sense
No Correlation between Distorted Body Representations Underlying Tactile Distance
Perception and Position Sense
Matthew R. Longo and Rosa Morcom
Department of Psychological Sciences, Birkbeck, University of London
In Press, Frontiers in Human Neuroscience
Address correspondence to:
Matthew R. Longo
Department of Psychological Sciences
Birkbeck, University of London
Malet Street
London WC1E 7HX
United Kingdom
Abstract
Both tactile distance perception and position sense are believed to require that
immediate afferent signals be referenced to a stored representation of body size and
shape (the body model). For both of these abilities, recent studies have reported that the
stored body representations involved are highly distorted, at least in the case of the
hand, with the hand dorsum represented as wider and squatter than it actually is. Here,
we investigated whether individual differences in the magnitude of these distortions are
shared between tactile distance perception and position sense, as would be predicted
by the hypothesis that a single distorted body model underlies both tasks. We used
established tasks to measure distortions of the represented shape of the hand dorsum.
Consistent with previous results, in both cases there were clear biases to overestimate
distances oriented along the medio-lateral axis of the hand compared to the
proximo-distal axis. Moreover, within each task there were clear split-half correlations,
demonstrating that both tasks show consistent individual differences. Critically,
however, there was no correlation between the magnitudes of distortion in the two
tasks. This casts doubt on the proposal that a common body model underlies both
Introduction
Several forms of perception require that immediate sensory signals be combined
with stored representations of body size and shape. This need is most acute in
somatosensation, for which the primary receptor surface – the skin – is physically
co-extensive with the body itself. We recently proposed a model of somatoperceptual
information processing which postulated a common representation of the metric
properties of the body (the body model) underlying perceptual abilities such as tactile
distance perception and position sense (Longo, Azañón, & Haggard, 2010). In the case of
touch, several recent studies have shown that illusions and similar interventions which
alter the perceived size of body parts produce corresponding changes in the perceived
size objects touching those parts, including effects induced by visual magnification
(Taylor-Clarke, Jacobsen, & Haggard, 2004), proprioceptive illusions (de Vignemont,
Ehrsson, & Haggard, 2005), cutaneous anesthesia (Berryman, Yau, & Hsiao, 2006), the
rubber hand illusion (Haggard & Jundi, 2009; Bruno & Bertamini, 2010), action sounds
(Tajadura-Jiménez et al., 2012; Tajadura-Jiménez, Tsakiris, Marquardt, &
Bianchi-Berthouze, 2015), and tool use (Canzoneri et al., 2013; Miller, Longo, & Saygin, 2014).
Together, such results support the interpretation the perception of tactile distance
involves immediate tactile signals being referenced to higher-order models of the size
and shape of the body.
Other studies have investigated the body representations underlying both tactile
distance perception and position sense at baseline, in the absence of any manipulation
of perceived bodily form. For example, Weber (1834/1996) in his classic studies on
touch found that as he moved the two points of a compass across his skin, it felt like the
distance between the two points increased as he moved them from a region or
(e.g., the palm). Subsequent studies have replicated this general pattern, showing that
perceived tactile distances appear to be systematically related to the sensitivity of
different skin surfaces (e.g., Goudge, 1918; Marks et al., 1982; Cholewiak, 1999;
Taylor-Clarke et al., 2004; Anema, Wolswijk, Ruis, & Dijkerman, 2008; Miller, Longo, & Saygin,
2016). Similarly, large anisotropies of perceived tactile distance have been reported on
the limbs, with stimuli oriented across the width of limbs being perceived as
substantially farther apart than stimuli oriented along the length of the limbs
(Canzoneri et al., 2013; Green, 1982; Le Cornu Knight, Longo, & Bremner, 2014; Longo,
Ghosh, & Yahya, 2015; Longo & Haggard, 2011; Longo & Sadibolova, 2013; Miller,
Longo, & Saygin, 2014, 2016). For example, in the study of Longo and Haggard (2011),
we presented participants sequentially with two pairs of touches on each trial, one pair
oriented along the proximo-distal axis of their hand and the other oriented with the
medio-lateral axis. Across trials, the ratio of the distances in the medio-lateral and
proximo-distal orientations was manipulated according to the method of constant
stimuli. Participants were asked to make two-alternative forced-choice (2AFC)
judgments of which of the two stimuli had a larger distance between the two touches.
We then estimated the point-of-subjective-equality (PSE) for each participant
In the case of position sense, recent studies have provided evidence for similar
distortions. Longo and Haggard (2010) developed a method to isolate and measure the
stored body representation which is integrated with immediate afferent signals. In this
task, participants sit with their hand underneath an occluding board and are asked to
judge the perceived location of the tips and knuckles of each finger. By comparing the
relative locations of judgments of each landmark, an implicit perceptual map of the
hand can be constructed and compared to the actual form of the hand. Studies using this
width and underestimation of finger length (e.g., Longo & Haggard, 2010, 2012a, 2012b;
Longo, 2014, 2015; Lopez, Schreyer, Preuss, & Mast, 2012; Ferrè, Vagnoni, & Haggard,
2013; Mattioni & Longo, 2014; Saulton, Dodds, Bülthoff, & de la Rosa, 2014; Saulton,
Longo, Wong, Bülthoff, & de la Rosa, 2016; Coelho, Zaninelli, & Gonzalez, in press).
Thus, large and highly stereotyped distortions have been reported for both
tactile distance perception and position sense. What is the relation between body
representations underlying these two abilities? In the model of somatoperceptual
information processing proposed by Longo and colleagues (2010), a common body
model feeds into both of these perceptual processes. Evidence consistent with the
proposal that a common body model underlies both tactile distance perception and
position sense comes from findings of similar patterns of distortions for both forms of
perception. For example, as discussed above, there are clear biases to overestimate the
width of the hand compared to its length, both in tactile distance perception (e.g., Green,
1982; Longo & Haggard, 2011) and in position sense (e.g., Longo & Haggard, 2010).
Further, distortions are substantially larger on the hairy skin of the hand dorsum than
on the glabrous skin of the palm, both for tactile distance perception (Le Cornu Knight
et al., 2014; Longo, Ghosh, et al., 2015; Longo & Haggard, 2011) and position sense
(Longo & Haggard, 2012a).
The present study investigated whether a common body model underlies tactile
distance perception and position sense by looking at whether individual differences in
the magnitude of distortions are shared between these abilities. In previous research,
strong correlations have been found between the magnitude of distortion on the two
hands and across similar conditions for both tactile size perception (Longo, Ghosh, et al.,
2015) and position sense (Longo & Haggard, 2010, 2012a; Longo, 2014; Mattioni &
perceptual abilities. Here we investigated whether these individual differences are
shared across abilities by measuring both in the same people. We measured anisotropy
of tactile distance perception on the dorsum of the left hand using a two-alternative
forced-choice (2AFC) method similar to that we have used previously (Longo, Ghosh, et
al., 2015; Longo & Haggard, 2011). Because the method described above for producing
proprioceptive maps underlying position sense focuses on the fingers, we used a
revised procedure we recently reported (Longo, Mancini, & Haggard, 2015) which
allows mapping the hand dorsum. Specifically, instead of giving participants verbal
instructions about which landmark to localize, a point on the hand is touched and
participants are asked to localize the touch in external space. This allows proprioceptive
maps to be constructed even for regions of skin without lexically-labeled landmarks.
Indeed, we found that these maps were stretched along the medio-lateral hand axis
(Longo, Mancini, et al., 2015). If a common body model underlies both tactile distance
perception and position sense, we expected a correlation across participants in the
magnitude of the distortions found for each task.
Methods
Participants
Twenty-five members of the Birkbeck community (18 females; mean age: 30.5
years, SD: 8.8 years) participated after giving informed consent. All participants were
right-handed as assessed by the Edinburgh Inventory (Oldfield, 1971) (M: 82.5, range:
36.8 – 100). Five additional participants with an R2 lower than 0.50 on at least one of
the two blocks of the tactile distance task were excluded from analyses. The relatively
high exclusion rate is largely driven by the fact that participants needed to have good fit
to the complete set of data from each participant, only two participants would have
been excluded.
All procedures were approved by the Department of Psychological Sciences
Research Ethics Committee at Birkbeck, University of London. The study was conducted
in accordance with the principles of the Declaration of Helsinki.
Tactile Distance Task
Procedures for the tactile distance task were similar to our previous studies
using this paradigm (Longo, Ghosh, et al., 2015; Longo & Haggard, 2011; Longo &
Sadibolova, 2013). Stimuli were pairs of wooden posts mounted in foamboard,
separated by 2, 3, or 4 cm. The posts tapered to a blunt point (approximately 1 mm in
diameter). On each trial, participants were touched twice on the dorsal surface of their
left hand, once with the posts oriented across the medio-lateral hand axis (across
orientation), and once with the posts oriented along the proximo-distal hand axis (along
orientation). Participants made untimed two-alternative forced-choice (2AFC)
judgments of which of the two distances felt physically larger. Stimuli were applied
manually by an experimenter, approximately in the centre of the hand dorsum. Stimuli
lasted approximately one second with an approximately one second inter-stimulus
interval.
There were two blocks of 72 trials each. In each block, all nine combinations of
across and along stimuli were presented eight times each, in random sequence. The
order of the along and across stimuli was counterbalanced across trials. The two blocks
were separated by a short break. Participants were blindfolded throughout the
The percentage of trials in which the ‘‘across’’ stimulus was judged as larger was
analyzed as a function of the ratio of the length of the across and along stimuli, plotted
logarithmically to produce a symmetrical distribution around a ratio of 1 (i.e., the
point-of-actual-equality). Best-fitting cumulative Gaussian functions were fit to data from
individual participants using maximum-likelihood estimation with the Palamedes
toolbox (Prins & Kingdom, 2009) for MATLAB (Mathworks, Natick, MA).
For each participant, the point-of-subjective-equality (PSE) was quantified as the
mean of the best-fitting Gaussian. As mentioned above, data for five participants was
excluded because the R2 of the best-fitting Gaussian fit separately to Blocks 1 and 2 was
below 0.50 in at least one block. For the remaining participants, there was good fit for
the data with mean R2 of 0.930 overall, 0.878 for curves fit to Block 1, and 0.873 for
curves fit to Block 2.
Proprioceptive Maps
Procedures were similar to those in our recent paper (Longo, Mancini, et al.,
2015). Participants sat with their left hand resting palm down on a table. The hand
rested flat on the table, with fingers completely straight. An occluding board (40 × 40
cm) was placed over the hand, resting on four pillars (6 cm high). A camera (Logitech
Webcam Pro 9000 HD) suspended on a tripod above the occluding board (27 cm high)
captured photographs (1600 × 1200 pixels) controlled by a custom MATLAB script.
To identify the points of stimulation, a 4x4 grid of points was marked with a pen
on the back of the participant’s hand using a plastic template (see the left panel of
Figure 1). The four rows of points ran along the medio-lateral hand axis, while the four
columns ran along the proximo-distal axis. On each trial, the experimenter lifted the
their hand), and touched one of the points with a von Frey hair (255 milliNewtons) for
approximately one second. The participant’s task was to place the tip of a long baton
(35 cm length, 2 mm diameter) on the occluder directly above the location where the
touch had occurred. They were instructed to be precise in their judgements and avoid
ballistic pointing or strategies such as tracing the outline of the hand. To ensure that
they judged each landmark individually, participants moved the baton to the edge of the
board before the start of each trial. When the participants indicated their response, a
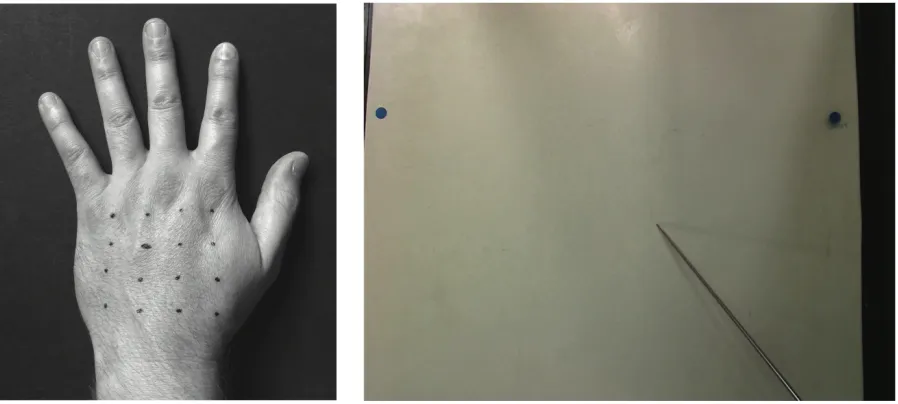
[image:10.595.74.523.296.498.2]photograph was taken and saved for offline coding (see right panel of Figure 1).
Figure 1: Setup of the proprioceptive mapping task. Left panel: A 4x4 grid of locations was marked with pen on the back of the participant’s hand. Right panel: On each trial, one of these locations was touched and participants used a long baton to judge the perceived location at which the touch had occurred by pointing to the corresponding location on an occluding board covering their hand. Locations of responses were captured by an overhead camera.
There were four blocks of 48 trials each. Each block included three mini-blocks of
one repetition of each of the 16 stimulus locations in random order. At the beginning
and the end of each block a photograph of the participant’s hand was taken to measure
the true locations of the applied stimuli and to check that the hand hadn’t moved during
the course of the block. A 10 cm ruler appeared in the photographs of the participant’s
For offline data coding, the x-y pixel coordinates of each landmark were coded
using a custom MATLAB script using Cogent Graphics (developed by John Romaya,
Wellcome Department of Imaging Neuroscience, University College London). Mean
coordinates were then calculated for each location in each experimental block. The set
of mean coordinates in each block comprises two maps, one reflecting the actual shape
of the stimulated locations, the other reflecting represented shape. Distances between
mean pixel coordinates of pairs of locations differing in the medio-lateral and
proximo-distal orientations were calculated and converted into cm. As shown in Figure 3, three
types of distances were calculated in each orientation: small distances, between
adjacent locations; mid distances, between locations separated by a single other
location; and large distances, separated by two other locations. There were 12 small, 8
mid, and 4 large distances in each orientation.
To assess overall stretch of maps, we stretched an idealized square grid reflecting
the locations of the 16 points by different amounts to find the stretch that maximized
the similarity with each participant’s perceptual map, as well as with the actual
configuration of points on their hand. Stretches were defined by the multiplication of
the x-coordinate (reflecting location in the medio-lateral hand axis) by a stretch
parameter. Thus, a stretch of 1 indicated a perfectly square grid, stretch of less than 1
indicated a tall thin grid, and stretch of more than 1 indicated a squat fat grid. Values
between 0.33 and 3 were tested by exhaustive search with a resolution of 0.0005 units
in natural logarithm space (i.e., 4,415 steps).
Results
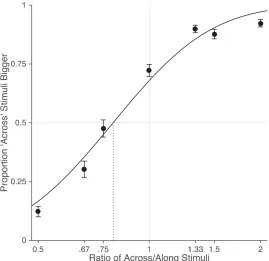
Results from the tactile distance judgment task are shown in Figure 2.
Psychometric functions were fit to the data from each participant and the point of
subjective equality (PSE) was calculated as the ratio between the across and along
stimuli where the curve crossed 50% (i.e., the ratio for which the participant was
equally likely to judge the across or the along stimulus as bigger).There was a clear bias
to perceive distances across the width of the hand as bigger than those along the length
of the hand (M: 0.782), t(24) = -9.79, p < 0.0001, d = 1.96. This clearly replicates the
anisotropy reported previously (Canzoneri et al., 2013; Green, 1982; Le Cornu Knight et
al., 2014; Longo, Ghosh, et al., 2015; Longo & Haggard, 2011; Longo & Sadibolova, 2013;
[image:12.595.163.432.355.616.2]Miller et al., 2014).
Figure 2: Results from the tactile distance judgment task. As in previous studies, there was a clear bias for stimuli oriented across the width of the hand dorsum to be perceived as larger than stimuli oriented along the length of the hand. The dotted vertical line indicates the point-of-subjective equality (i.e., the stimulus ratio at which participants were equally likely to judge the across or the along stimulus as bigger). Error bars are one standard error.
To quantify distortions in the internal configuration of the representation of the
hand, we calculated the distance between judgments of pairs of locations differing in
location along the medio-lateral hand axis (across the hand) or the proximo-distal axis
(along the hand), as shown in the left panel of Figure 3. Distances across the hand were
calculated for pairs of landmarks within each row of locations, and distances along the
hand were calculated for pairs of landmarks within each column. Three sizes of distance
were calculated: small distances, separated by a single step; mid distances, separated by
two steps; and large distances, separated by two steps. There were, thus, 12 small, 8
[image:13.595.94.523.325.561.2]mid, and 4 large distances in each orientation.
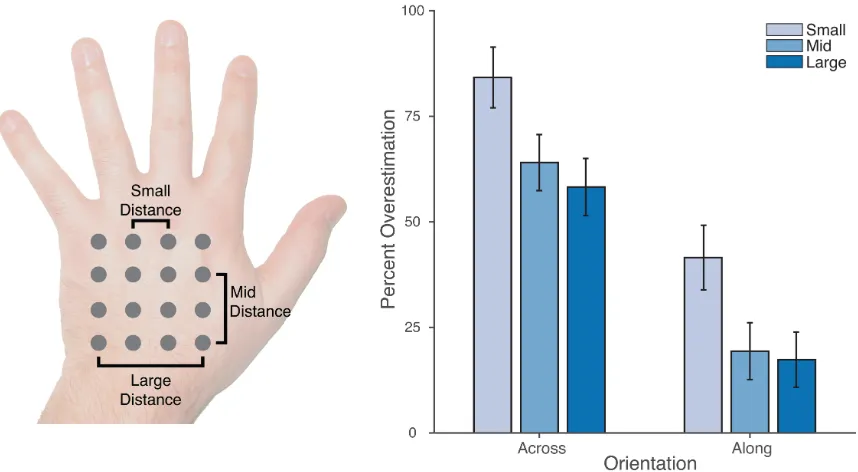
Figure 3: Left panel: Schematic depiction of the location of the 16 stimulus locations in the proprioceptive map task. Three types of distance were calculated in both the across and along orientations, reflecting one step between locations (small distance), two steps (mid distance), or three steps (large distance). Right panel: Overestimation of distances in the two orientations as a percentage of actual distance. While absolute overestimation was apparent in both orientations, it was substantially larger in the across than in the along orientation. Error bars are one standard error.
The right panel of Figure 3 shows overestimation as a percentage of actual
distance for across and along distances of the three different sizes. One-sample t-tests
amount of overestimation to 0. Significant overestimation was found for all distances,
both across the hand: small (M = 84.2%, t(24) = 11.71, p < 0.0001, d = 2.41), mid (M =
64.0%, t(24) = 9.65, p < 0.0001, d = 2.01), large (M = 58.2%, t(24) = 8.59, p < 0.0001, d =
1.78); and along the hand: small (M = 41.5%), t(24) = 5.41, p < 0.0001, d = 1.12; mid (M
= 19.4%), t(24) = 2.88, p < 0.02, d = 0.60; large (M = 17.3%), t(24) = 2.65, p < 0.02, d =
0.55. Critically, however, the magnitude of overestimation was significantly larger in the
across than in the along orientation in all cases: small, t(24) = 6.26, p < 0.0001, dz = 1.31;
mid, t(24) = 7.40, p < 0.0001, dz= 1.54; large, t(24) = 7.73, p < 0.0001, dz= 1.61.
A 2x3 repeated-measures analysis of variance (ANOVA) was conducted with
orientation (across vs. along) and size (small, medium, large) as factors. There was a
clear main effect of orientation, F(1, 24) = 63.71, p < 0.0001, ηp2 = 0.73, with distances
across the width of the hand overestimated relative to those along the length of the
hand. There was also a main effect of size, F(1.21, 29.09) = 34.77, p < 0.0001, ηp2 = 0.59,
with overestimation decreasing monotonically with size. There was no interaction,
F(1.62, 38.80) = 0.439, n.s., ηp2 = 0.02.
The analyses reported so far calculate separate measures of overestimation for
each dimension. To calculate a single measure of distortion of maps as a whole, we
conducted an additional analysis using a method called Procrustes alignment
(Bookstein, 1991; Rholf & Slice, 1990). Procrustes alignment superimposes
configurations of homologous landmarks by translating, scaling, and rotating them so as
to minimize the distance between pairs of landmarks. We used this in two ways. First,
we used Generalized Procrustes Analysis (Gower, 1975) to mutually superimpose maps
from all participants to construct grand-averages of both perceptual maps and actual
hand shape. These maps are shown in the left panel of Figure 4 and allow a visualization
Second, we used the Procrustes distance, the sum-of-squares of the residual
distances between pairs of homologous landmarks, as a measure of the dissimilarity
between two maps. This allowed us to estimate the overall stretch of perceptual maps
in the medio-lateral axis by finding the stretch applied to an idealized rectangular grid
that minimized the dissimilarity with each map. We multiplied the x-coordinates of a
4x4 rectangular grid by a stretch parameter to generate grids of varying levels of
stretch. When the stretch parameter was equal to 1, the grid was perfectly square.
When it was greater than 1, the grid was stretched in the medio-lateral axis. When it
was less than 1, the grid was stretched in the proximo-distal axis. For each participant,
we determined the value of the stretch parameter that minimized the dissimilarity in
shape (i.e., that minimized the Procrustes distance) between the stretched grid and the
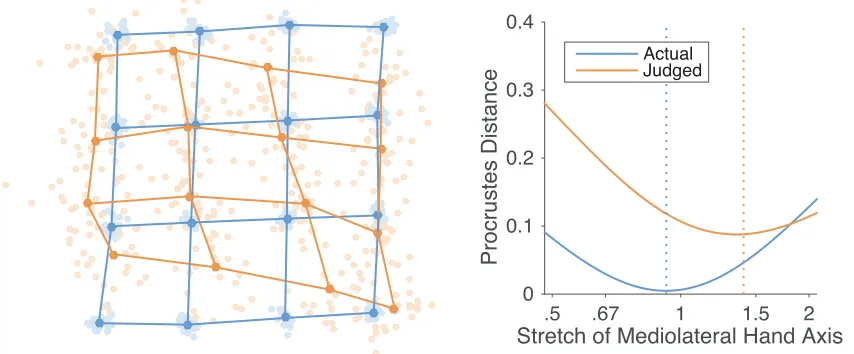
participant’s perceptual map. The right panel of Figure 4 shows the mean values of the
Procrustes distance for values of the stretch parameter. The best-fitting stretch
parameters were significantly greater than 1 (M: 1.40), t(24) = 6.96, p < 0.0001, d =
[image:15.595.75.502.499.676.2]1.39.
Figure 4: Left panel: Generalized Procrustes alignment of the actual configuration of points on the hand (blue dots and lines) and perceptual maps (orange dots and lines). The light dots are data from individual participants, while the dark dots represent the average shape. Right panel: mean Procrustes distance between actual and perceptual maps and idealized grids stretched by different amounts. A stretch of 1 indicates a square grid; stretches greater than 1 indicate stretch in the medio-lateral axis, while stretches less than 1 indicate stretch in the proximo-distal axis.
Stretch of Mediolateral Hand Axis.5 .67 1 1.5 2
Procrustes Distance
0 0.1 0.2 0.3 0.4
Correlations between Tasks
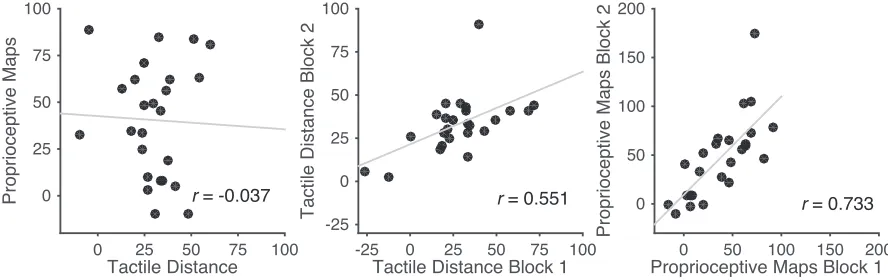
The left panel of Figure 5 shows a scatterplot of distortions in the two tasks, in
both cases quantified as the percentage overestimation of the medio-lateral hand axis
relative to the proximo-distal axis. There was no apparent relationship whatsoever,
with a highly non-significant correlation, r(23) = -0.037, p = 0.861.
To ensure that this lack of correlation does not reflect an absence of meaningful
individual differences in these measures or a lack of statistical power, we investigated
the split-half correlations between the two blocks of each task. A scatterplot showing
the relation between performance on the two blocks of the tactile distance judgment
task is shown in the centre panel of Figure 5, and a corresponding scatterplot for the
proprioceptive localisation task in the right panel of Figure 5. As is clear in the Figure,
clear split-half correlations were apparent in both the tactile distance, r(23) = 0.551, p <
[image:16.595.74.518.468.608.2]0.005, and proprioceptive localisation, r(23) = 0.733, p < 0.0001, tasks.
Figure 5: Scatterplots showing the relation between the two tasks (left panel), and between the first and second halves of each of the two tasks individually (centre and right panels). Units are percent overestimation of the medio-lateral relative to the proximo-distal hand axis. There was no correlation between the magnitude of the distortion in the two tasks. Critically, however, within each task, clear split-half correlations were apparent.
Discussion Tactile Distance
0 25 50 75 100
Proprioceptive Maps 0 25 50 75 100
r = -0.037
Tactile Distance Block 1
-25 0 25 50 75 100
Tactile Distance Block 2 -25 0 25 50 75 100
r = 0.551
Proprioceptive Maps Block 10 50 100 150 200
Proprioceptive Maps Block 2
0 50 100 150 200
These results replicated the distortions that have previously been reported on
the hand dorsum for both tactile distance perception (e.g., Green, 1982; Longo &
Haggard, 2011) and position sense (Longo & Haggard, 2010, 2012a). Moreover, also
consistent with previous results, there were clear individual differences in the
magnitude of these distortions, as measured by split-half correlations. Critically,
however, there was no evidence that individual differences were shared between tactile
distance perception and position sense, with no apparent correlation between
distortions in the two cases. These results cast doubt on the suggestion that both
abilities rely on a common representation of the body’s metric properties (i.e., body
model), as we suggested previously (Longo et al., 2010), in which case common
individual differences should be apparent in both cases.
What causes individual differences in these tasks? To this point, we have
assumed that the split-half correlations we find reflect differences between people in
the extent to which the representation of the hand’s metric properties (i.e., the body
model) is distorted. It is certainly possible, however, that these correlations might
instead reflect differences between people in the way they approach the task or the
amount of effort they exert. Given that the tasks we used are superficially very different,
person-to-person differences in how the tasks are approached might affect the tasks in
different ways. Thus, it is possible that the overall similar distortions in the two tasks
seen at the level of the overall mean reflect the influence of a common body model on
both tasks, but that the split-half correlations reflect idiosyncratic differences in how
participants approach each task. The present results cannot exclude this interpretation.
However, in a recent study (Longo, Ghosh, et al., 2015) we found that while there were
clear correlations in the magnitude of distortions of tactile distance perception across
of each hand. Given that the task was exactly the same for both skin surfaces, the lack of
correlation between the palm and dorsum is difficult to interpret in terms of how
participants approached the task.
What do the present results tell us about the relation between distortions in
tactile distance perception and position sense? In both cases, the nature of the
distortions appears to parallel lower-level aspects of somatosensory organization. For
example, the overestimation of hand width relative to length mirrors findings of greater
tactile spatial acuity in the medio-lateral than in the proximo-distal axis of the limbs
(e.g., Weber, 1834/1996; Cody, Garside, Lloyd, & Poliakoff, 2008) and the fact that
receptive fields of neurons in the spinal cord and cortex representing the limbs tend to
be oval-shaped, with the long axis running along the proximo-distal limb axis (e.g.,
Powell & Mountcastle, 1959; Brooks, Rudomin, & Slayman, 1961; Brown, Fuchs, &
Tapper, 1975; Alloway, Rosenthal, & Burton, 1989). Distortions in both tactile distance
perception and position sense, however, are much smaller than would be predicted on
the basis of receptive field size alone (Taylor-Clarke et al., 2004; Longo, in press),
suggesting that low-level distortions are at least partly corrected before affecting tactile
distance perception and position sense. Thus, one possibility is that body
representations underlying tactile distance perception and position sense are
completely distinct, but both are shaped by lower-level somatosensory maps, and
inherit their distortions. This could account for the fact that both perceptual abilities
show qualitatively similar patterns of distortion, which are nevertheless not correlated
across people. Another possibility is that both tactile distance perception and position
sense rely on a common body model, but that the specific demands of each type of
judgment alter responses, resulting in different patterns of individual difference in the
The procedure for mapping implicit body representations developed by Longo
and Haggard (2010) relies on the body part being mapped having numerous distinct
landmarks with verbally-specifiable names. This worked in the case of the hands, which
have many such lexically-coded landmarks, at least on the fingers. Together with a
recent study (Longo, Mancini, et al., 2015), the present results show that this paradigm
can be extended to regions of the body which do not have such landmarks. In both of
these studies, perceptual maps analogous to those obtained by Longo and Haggard
(2010) were obtained for the hand dorsum, which (unlike the fingers) lacks many
distinct landmarks. Critically, these maps showed overestimation of hand width relative
to length, analogous to the underestimation of finger length and overestimation of hand
width described by Longo and Haggard (2010). This demonstrates that the distortions
seen in previous studies cannot be an artifact of the use of verbal categories for cueing
responses. That implicit perceptual maps can be obtained in the absence of distinct
References
Alloway, K. D., Rosenthal, P., & Burton, H. (1989). Quantitative measurements of
receptive field changes during antagonism of GABAergic transmission in primary
somatosensory cortex of cats. Experimental Brain Research, 78, 514–532.
Anema, H. A., Wolswijk, V. W., Ruis, C., & Dijkerman, H. C. (2008). Grasping Weber’s
illusion: The effect of receptor density differences on grasping and matching.
Cognitive Neuropsychology, 25, 951-967
Berryman, L. J., & Yau, J. M., & Hsaio, S. S. (2006). Representation of object size in the
somatosensory system. Journal of Neurophysiology, 96, 27-39.
Bookstein, F. L. (1991). Morphometric tools for landmark data: Geometry and biology.
Cambridge: Cambridge University Press.
Brooks, V. B., Rudomin, P., & Slayman, C. L. (1961). Peripheral receptive fields of
neurons in the cat’s cerebral cortex. Journal of Neurophysiology, 24, 302-325
Brown, P. B., Fuchs, J. L., & Tapper, D. N. (1975). Parametric studies of dorsal horn
neurons responding to tactile stimulation. Journal of Neurophysiology, 38, 19–25.
Bruno, N., & Bertamini, M. (2010). Haptic perception after a change in hand size.
Neuropsychologia, 48, 1853-1856.
Canzoneri, E., Ubaldi, S., Rastelli, V., Finisguerra, A., Bassolino, M., & Serino, A. (2013).
Tool-use reshapes the boundaries of body and peripersonal space representations.
Experimental Brain Research, 228, 25–42.
Cholewiak, R. W. (1999). The perception of tactile distance: Influences of body site,
space, and time. Perception, 28, 851-875.
Cody, F. W., Garside, R. A., Lloyd, D., & Poliakoff, E. (2008). Tactile spatial acuity varies
with site and axis in the human upper limb. Neuroscience Letters, 433, 103-108.
perception. Psychological Research.
de Vignemont, F., Ehrsson, H. H., & Haggard, P. (2005). Bodily illusions modulate tactile
perception. Current Biology, 15, 1286-1290.
Ferrè, E. R., Vagnoni, E., & Haggard, P. (2013). Vestibular contributions to bodily
awareness. Neuropsychologia, 51, 1445–1452.
Goudge, M. E. (1918). A qualitative and quantitative study of Weber’s illusion. American
Journal of Psychology, 29, 81-119.
Gower, J. C. (1975). Generalized procrustes analysis. Psychometrika, 40, 33–51.
Green, B. G. (1982). The perception of distance and location for dual tactile pressures.
Perception and Psychophysics, 31, 315–323.
Haggard, P., & Jundi, S. (2009). Rubber hand illusions and size-weight illusions:
Self-representation modulates Self-representation of external objects. Perception, 38,
1796-1803.
Le Cornu Knight, F., Longo, M. R., & Bremner, A. J. (2014). Categorical perception of
tactile distance. Cognition, 131, 254–262.
Longo, M. R. (2014). The effects of immediate vision on implicit hand maps.
Experimental Brain Research, 232, 1241–1247.
Longo, M. R. (2015). Posture modulates implicit hand maps. Consciousness and
Cognition, 36, 96–102.
Longo, M. R. (in press). Distorted body representations in healthy cognition. Quarterly
Journal of Experimental Psychology.
Longo, M. R., Azañón, E., & Haggard, P. (2010). More than skin deep: Body
representation beyond primary somatosensory cortex. Neuropsychologia, 48, 655–
668.
size perception. Perception, 44, 1251–1262.
Longo, M. R., & Haggard, P. (2010). An implicit body representation underlying human
position sense. Proceedings of the National Academy of Sciences of the United States
of America, 107, 11727–11732.
Longo, M. R., & Haggard, P. (2011). Weber’s illusion and body shape: Anisotropy of
tactile size perception on the hand. Journal of Experimental Psychology. Human
Perception and Performance, 37, 720–726.
Longo, M. R., & Haggard, P. (2012a). A 2.5-D representation of the human hand. Journal
of Experimental Psychology: Human Perception and Performance, 38, 9–13.
Longo, M. R., & Haggard, P. (2012b). Implicit body representations and the conscious
body image. Acta Psychologica, 141, 164–168.
Longo, M. R., Mancini, F., & Haggard, P. (2015). Implicit body representations and tactile
spatial remapping. Acta Psychologica, 160, 77–87.
Longo, M. R., & Sadibolova, R. (2013). Seeing the body distorts tactile size perception.
Cognition, 126, 475–481.
Lopez, C., Schreyer, H.-M., Preuss, N., & Mast, F. W. (2012). Vestibular stimulation
modifies the body schema. Neuropsychologia, 50, 1830–1837.
Marks, L. E., Girvin, J. P., Quest, D. O., Antunes, J. L., Ning, P., O’Keefe, M. D., et al (1982).
Electrocutaneous stimulation II. The estimation of distance between two points.
Perception and Psychophysics, 32, 529–536.
Mattioni, S., & Longo, M. R. (2014). The effects of verbal cueing on implicit hand maps.
Acta Psychologica, 153, 60–65.
Miller, L. E., Longo, M. R., & Saygin, A. P. (2014). Tool morphology constrains the effects
of tool use on body representations. Journal of Experimental Psychology: Human
Miller, L. E., Longo, M. R., & Saygin, A. P. (2016). Mental body representations retain
homuncular shape distortions: Evidence from Weber's illusion. Consciousness and
Cognition, 40, 17-25.
Oldfield, R. C. (1971). The assessment and analysis of handedness: The Edinburgh
inventory. Neuropsychologia, 9, 97–113.
Powell, T. P. S., & Mountcastle, V. B. (1959). Some aspects of the functional organization
of the cortex of the postcentral gyrus of the monkey: A correlation of findings
obtained in a single unit analysis with cytoarchitecture. Bulletin of the Johns
Hopkins Hospital, 105, 133-162.
Prins, N., & Kingdom, F. A. A. (2009). Palamedes: Matlab routines for analyzing
psychophysical data. http://www.palamedestoolbox.org.
Rholf, F. J., & Slice, D. E. (1990). Extensions of the Procrustes method for the optimal
superimposition of landmarks. Systematic Zoology, 39, 40–59.
Saulton, A., Dodds, T. J., Bülthoff, H. H., & de la Rosa, S. (2014). Objects exhibit body
model like shape distortions. Experimental Brain Research, 233, 1471–1479.
Saulton, A., Longo, M. R., Wong, H. Y., Bülthoff, H. H., & de la Rosa, S. (2016). The role of
visual similarity and memory in body model distortions. Acta Psychologica, 164,
103–111.
Tajadura-Jiménez, A., Väljamäe, A., Toshima, I., Kimura, T., Tsakiris, M., & Kitagawa, N.
(2012). Action sounds recalibrate perceived tactile distance. Current Biology, 22,
R516-R517.
Tajadura-Jiménez, A., Tsakiris, M., Marquardt, T., & Bianchi-Berthouze, N. (2015). Action
sounds update the mental representation of arm dimension: Contributions of
kinaesthesia and agency. Frontiers in Psychology, 6, 689.
Object contancy in human touch. Nature Neuroscience, 7, 219-220.
Weber, E. H. (1996). De subtilitate tactus (H. E. Ross, Trans.). In H. E. Ross & D. J. Murray
(Eds.), E. H. Weber on the Tactile Senses, 2nd Ed. (pp. 21-128). Hove, UK: Erlbaum.
Acknowledgments
This research was supported by European Research Council Grant