Research paper
Effect of heating rate on gas emissions and properties of
fi
red clay bricks
and
fi
red clay bricks incorporated with cigarette butts
Aeslina Abdul Kadir
a,⁎
, Abbas Mohajerani
b,1 aDepartment of Environmental and Water Resources, Faculty of Civil and Environmental Engineering, Universiti Tun Hussein Onn Malaysia (UTHM), 86400 Parit Raja, Batu Pahat, Johor Darul Takzim, Malaysia
b
School of Civil, Environmental and Chemical Engineering, RMIT University, Melbourne, Australia
a b s t r a c t
a r t i c l e i n f o
Article history: Received 17 June 2013
Received in revised form 1 December 2014 Accepted 2 December 2014
Available online 13 December 2014
Keywords: Gas emission Heating rate Fired clay brick Cigarette butt
Physical and mechanical properties
In general, thefiring process of clay bricks generates a range of gas emissions into the atmosphere. At high concentrations, these volatile emissions can be a serious source of environmental pollutions. The main purpose of this study was to evaluate the effect of different heating rates on gas emissions and properties during thefiring of clay bricks and clay bricks incorporated with cigarette butts (CBs). In this investigation, four different heating rates were used: 0.7 °C min−1, 2 °C min−1, 5 °C min−1and 10 °C min−1. The samples werefired in solid form
from room temperature to 1050 °C. During thefiring cycles, carbon monoxide, carbon dioxide, nitrogen oxides, hydrogen cyanide and chlorine emissions were measured at different heating rates. All bricks were also tested for their physical and mechanical properties including dry density, compressive strength, tensile strength, water absorption and initial rate of absorption. Results show that gas emissions were reduced significantly with higher heating rates (10 °C min) followed by 5 °C min−1and 2 °C min−1for both types of brick samples.
Higher heating rates also decrease the compressive strength and tensile strength value but demonstrate an insignificant effect on the water absorption properties respectively. In conclusion, a higher heating rate is preferable in terms of decreasing gas emissions and it is also able to produce adequate physical and mechanical properties especially for the CB brick.
© 2014 Elsevier B.V. All rights reserved.
1. Introduction
Brick is one of the most accommodating masonry units due to its properties. Thefiring process of clay bricks generates a range of gas emissions into the atmosphere. These gases include water vapour (H2O), oxygen (O2), carbon monoxide (CO), carbon dioxide (CO2), sul-phur dioxide (SO2), ammonia (NH3), chlorine (Cl2) andfluorine (F). At high concentrations, these volatile emissions can be serious sources of environmental pollutions (Morgan, 1993). Therefore, innovation in thefiring process is essential to prevent the environmental impact of the brick manufacturing process.
Many studies have been carried out to investigate the evolved gas fromfired clay bricks. Attempts have been made to investigate the vol-umes of gases released at different temperatures and their correlations with the clay properties; see for example the studies byParsons et al. (1997),Santos et al. (2003)andToledo et al. (2004). In particular,
Dunham et al. (2001)andRasmussen et al. (2012)investigated shorter firing times in the manufacturing of clay bricks whileDondi et al. (1999)
compared the influences of fastfiring and traditionalfiring on physical and mechanical properties of clay bricks. Gonzalez et al. (2002),
Cusido et al. (2003),Gonzalez et al. (2006),Gonzalez et al. (2011)
andShen et al. (2013)emphasised the reduction of gas emissions, specifically offluorine, chlorine and sulphur, by controlling thefiring temperature and mineral contents of the clay during the manufacturing process. Nevertheless, previous research provided very limited discus-sion on the effect of different heating rates, particularly on the gas emis-sions and on physical–mechanical properties of manufacturedfired clay bricks. In this study, two types of brick samples were used: the clay bricks and clay bricks incorporated with cigarette butts (CBs). Recycling cigarette butts as an inert component into clay bricks can be a practical solution to one of the important pollution problems in the world (Abdul Kadir and Mohajerani, 2010, 2011; Abdul Kadir et al., 2010). The main purpose of this study is to evaluate the effect of different heating rates on gas emissions duringfiring as well as the properties of clay bricks and bricks incorporated with CB. In this investigation, the gas emissions are presented as Estimated Total Emission (ETE). The ETE is the estimated total gas emission from thefired brick samples during the heating period.
⁎ Corresponding author. Tel.: +60 126689802; fax: +60 74536070.
E-mail addresses:[email protected](A. Abdul Kadir),[email protected]
(A. Mohajerani).
1
Tel.: +61 399253082; fax: +61 396390138.
http://dx.doi.org/10.1016/j.clay.2014.12.005
0169-1317/© 2014 Elsevier B.V. All rights reserved.
Contents lists available atScienceDirect
Applied Clay Science
2. Materials and methods
In this study, in order to investigate the evolved gas released under conditions analogous to the actual clay brickfiring process, clay brick and CB brick samples are prepared in extruded forms. The chemical composition of the raw clay samples was determined using an X-ray fluorescence analyser (XRF) and the major crystalline phases of silt and clay fraction of the brick soil were examined using a Bruker X-ray diffractometer (XRD).
The preparation of the manufacturingfired clay brick and CB brick samples was explained in detail in previous studies (Abdul Kadir and Mohajerani, 2010, 2011; Abdul Kadir et al., 2010). In this investigation, clay brick andfired clay brick samples with 5% of CB content were prepared. The brick samples were manufactured in three different sizes: cube (100 mm × 100 mm × 100 mm), brick (225 mm × 110 mm × 75 mm) and beam (300 mm × 100 mm × 50 mm), in compliance with the minimum requirements for testing under the relevant
Australian/New Zealand Standards (AS/NZS 4456.1, 2003). The mixes were made using a Hobart mechanical mixer with a 10 l capacity for 5 min. In order to achieve uniform distribution of CBs, they were initial-ly mixed with dry soil in the mixer and then water was gradualinitial-ly added to the mix. Potable water was used for the optimum moisture content in order to make high dry density brick samples. Before compaction, the test mould was sprayed with oil to prevent any effect of the mould inner wall on the sample. The samples were compacted manually by pressing and kneading the mixes in the respective moulds using predetermined masses corresponding to the maximum dry density. The brick samples were dried in an oven at 105 °C for 24 h prior to heating experiments.
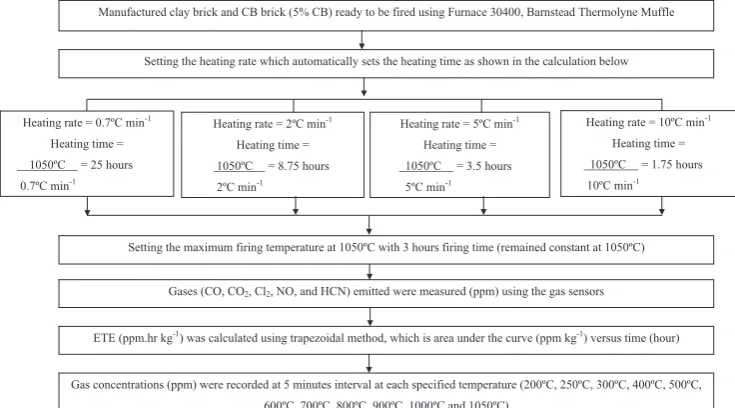
Four different heating rates were used: 0.7 °C min−1, 2 °C min−1, 5 °C min−1and 10 °C min−1. The samples werefired in solid forms from room temperature to 1050 °C. The procedure developed is shown in the followingflow diagram (Fig. 1). The gas detector (Industrial Scientific iBrid Multi-Gas sensors) used in this study was equipped withfive gas sensors for carbon monoxide (CO), carbon dioxide (CO2), chlorine (Cl2), nitrogen oxide (NO) and hydrogen cyanide (HCN). These gases are the expected main gases emitted fromfired clay bricks. The iBrid Multi-Gas sensors are temperature-compensated using an on board temperature sensor that enables accurate readings across the full tem-perature range of the instrument. Furthermore, an internal gas-permeablefilter is provided to limit the amount of dust and contami-nants that may enter the internal sensor chamber and affect the sensor
readings. The instrument also alerts the user audibly and visually if over-range values are detected. Over-range values are those values out-side the normal operating ranges of the sensors. Moreover, the iBrid instrument utilises optical media interfaces for infrared data transmis-sion (IrDA) at a speed of 115,200 bytes/s and can save up to three months of data collected at 1 minute intervals forfive sensors simulta-neously. The detection limit range for CO is from 0 ppm to 1500 ppm, CO2is from 0% to 5% by volume, Cl2is from 0 ppm to 50 ppm, NO is from 0 ppm to 1000 ppm and HCN is from 0 ppm to 30 ppm. The prin-cipal means used to determine CO, Cl2, NO and HCN is by using an elec-trochemical sensor while for CO2an infrared sensor is used.
2.1. Estimated Total Emission (ETE)
In this investigation, the effects of different heating rates on Estimated Total Emission (ETE) were determined. The ETE from thefired brick sam-ples during the heating period was approximated by calculating the total area under the curve from the‘Gas emissions per unit mass of brick’
(ppm kg−1) versus the
‘Heating time (hour)’. These values could be obtained by employing the trapezoidal method, in ppm·hr·kg−1. The ETE values obtained are indicative of the total gas emissions under the conditions applicable to this study. Example calculations to determine ETE are shown in Eq.(1)based on data provided inTable 1. The mass of thefired CB brick used is 2.72 kg.
ETE¼2:72kg1 ½ 0þ12ppm2
4:75hrþ 12þ28ppm2
1:20hr
þ 128þ1500ppm2
1:18hrþ 1500þ429ppm 2
2:39hr
þ429þ122ppm2 2:38hrþ122þ220ppm2:38hr
þ 20þ12ppm2
2:39hrþ 12þ28ppm:
2:36hr
þ 8þ8ppm2
2:39hrþ 7þ7ppm2
2:38hr
þ 7þ7ppm2
1:2hr ¼1583:80ppmhr=kg:
ð1Þ
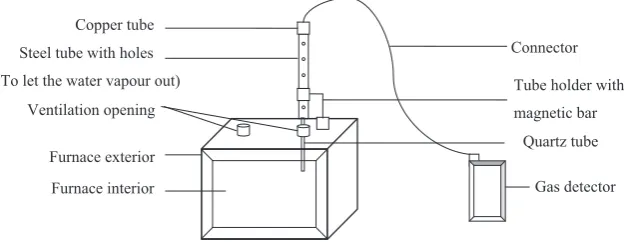
A gas measurement set-up was developed at this stage to measure ETE, as shown inFig. 2. Emissions from the brick samples were measured
Setting the heating rate which automatically sets the heating time as shown in the calculation below Manufactured clay brick and CB brick (5% CB) ready to be fired using Furnace 30400, Barnstead Thermolyne Muffle
ETE (ppm.hr kg-1) was calculated using trapezoidal method, which is area under the curve (ppm kg-1) versus time (hour)
Gases (CO, CO2, Cl2, NO, and HCN) emitted were measured (ppm) using the gas sensors
Gas concentrations (ppm) were recorded at 5 minutes interval at each specified temperature (200ºC, 250ºC, 300ºC, 400ºC, 500ºC,
600ºC, 700ºC, 800ºC, 900ºC, 1000ºC and 1050ºC)
Setting the maximum firing temperature at 1050ºC with 3 hours firing time (remained constant at 1050ºC) Heating rate = 0.7ºC min-1
Heating time =
1050ºC = 25 hours
0.7ºC min-1
Heating rate = 2ºC min-1
Heating time =
1050ºC = 8.75 hours
2ºC min-1
Heating rate = 5ºC min-1
Heating time =
1050ºC = 3.5 hours
5ºC min-1
Heating rate = 10ºC min-1
Heating time =
1050ºC = 1.75 hours
[image:2.595.109.477.514.718.2]10ºC min-1
directly from the furnace (Furnace 30400, Barnstead Thermolyne Muffle) using a connector from the gas detector. The connector transfers gasflow from the furnace to the gas detector once the gas detector pump is switched on. A quartz tube with resistance to high temperature was inserted into the furnace through the ventilation opening. The quartz tube was connected to the copper tube held by the magnetic tube holder. A 20 mm perforated copper tube was equipped to release the trapped water vapour to prevent the gas detector from clogging and also to prolong the distance to ensure that the desired temperature would be achieved before the gases were extracted by the gas detector pump with an absorption rate of 2.41 cm3s−1. The gas detector sensors are very sensitive and only resistant to temperatures from−20 °C up to 50 °C. The gas emissions were detected by the sensors and recorded in ppm unit at specific times by the gas detectors. Gas measurements were recorded at 5 minute intervals at the following specific tempera-tures: 200 °C, 250 °C, 300 °C, 400 °C, 500 °C, 600 °C, 700 °C, 800 °C, 900 °C, 1000 °C and 1050 °C. Measurements were not conducted at low temperatures (0 °C to 200 °C) to allow all the water vapour inside the brick samples to be released, which corresponded to the expulsion of adsorbed water and hydroxyl groups from the clay mineral. The emissions from the empty furnace with different heating rates were measured and subtracted from the gas measurements as control proce-dure. This procedure was followed by the clay brick and CB bricks and each sample was duplicated. The values reported in this paper are the average values from the experimental work.
2.2. Physical and mechanical properties
Physical and mechanical laboratory tests (dry density, compressive strength, tensile strength, water absorption and initial rate of absorp-tion) in accordance with the relevant standards (AS/NZS 4456.0, 2003) were also carried out to determine the performance of clay bricks and CB bricksfired at different heating rates (0.7 °C min−1, 2 °C min−1, 5 °C min−1and 10 °C min−1).
2.2.1. Dry density
The dry density of the clay brick and CB bricks was measured in accor-dance with AS/NZ 4456.8 (2003). As stipulated by the standards, samples were manufactured with dimensions of 225 mm × 110 mm × 75 mm. The mean values were recorded to the nearest 0.5 mm. The samples were dried at 110 °C ± 8 °C at intervals not less than 4 h to constant weight (weight change not greater than 0.1%). The consecutive weight was taken as the weight of the sample after the sample cooled to room tem-perature from oven temtem-perature.
2.2.2. Compressive strength
The preparations of the clay brick and CB brick for compressive strength testing were carried out in accordance with AS/NZ 4456.4 (2003). Cubes for each mixture were manufactured for this test. The dimension of the cube was 100 mm × 100 mm × 100 mm which complied with the minimal allowable dimension for the compressive strength test according toAS/NZS 4456.1 (2003). The compressive strength test was carried out using a MTS Universal Testing Machine (III.CLB.14. Alfred J. Amsler & Co) with a capacity of 1000 kN. The testing machine was computer-controlled by the MTS Test-Star controller and software with the testing specifications and configuration data acquisi-tion system.
2.2.3. Tensile strength
The tensile strength test measures the extremefibre tensile stress at the face of a masonry unit in bending. The preparation of the clay brick and the CB bricks for the test was adopted fromAS/NZS 4456.15 (2003)
and a Tinius & Olsen Testing Machine (101025) was used.
2.2.4. Water absorption
Preparation of the clay brick and the CB brick samples for water absorption testing was conducted in accordance withAS/NZS 4456.14 (2003). The brick samples (225 mm × 110 mm × 75 mm) were pre-pared and dried at 110 °C ± 8 °C in the drying oven and weighed at in-tervals of not less than 4 h to constant weight (change in the mass not greater than 0.1%). The weights were measured after the sample was cooled to room temperature. The 24-hour cold water immersion test and the 5-hour boiling test procedures were followed in compliance with the aforementioned standards.
2.2.5. Initial rate of absorption
[image:3.595.42.292.77.206.2]Initial rate of absorption (IRA) was analysed in accordance with AS/NZ 4456.17 (2003) for both the clay and the CB bricks. The IRA is im-portant for laying and durability of the brick. Three samples each with a size of 225 mm × 110 mm × 75 mm were dried to constant mass in a ventilated drying oven at 110 °C ± 8 °C and weighed after cooling to room temperature. The weights were determined to an accuracy of 0.001 g. A water bath tank was prepared that contained two bars made from corrosion-resistant materials. Two bars (each not more than 6 mm wide) were placed in the tank to support the bed face of the test samples, which were placed in parallel to each other and 3 mm beneath Table 1
Case example for CO emissions for 5% of CB brickfired at 0.7 °C/min.
Temperature (°C)
CO (ppm)
Time (h)
Cumulative heating time (h)
200 12 4.75 4.75
250 128 1.20 5.95
300 1500 1.18 7.13
400 429 2.39 9.52
500 122 2.38 11.90
600 20 2.38 14.28
700 12 2.39 16.67
800 8 2.36 19.03
900 8 2.39 21.42
1000 8 2.38 23.80
1050 8 1.20 25.00
Ventilation opening
Furnace interior Copper tube
Steel tube with holes
(To let the water vapour out) Tube holder with
magnetic bar
Furnace exterior
Connector
Gas detector Quartz tube
[image:3.595.147.461.605.726.2]the water surface. The water level in the tank was maintained at 3 ± 1 mm above the bars. The sample was placed on the bars for a period of 60 ± 1 s, measured from the time the specimens were in contact with the water. Upon removal from the water tank, the sample was wiped dry immediately and then reweighed within a minute.
3. Results
This section reports the results of the following: (1) composition of clay samples (2) different heating rates on the ETE offive gases (CO, CO2, Cl2,HCN and NO) measured and (3) the physical and mechan-ical properties of the clay brick samples and the CB brick samples. All results reported are means of the three values and the graphs obtained are valid only within the testing conditions of this study.
3.1. The composition of clay soil
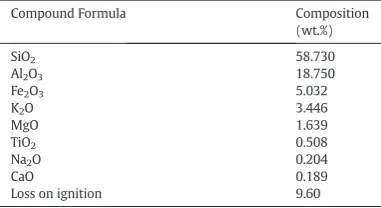
[image:4.595.64.255.77.181.2]The XRF results obtained for the test samples are presented in
Table 2. The test results show that silica (SiO2) was the most abundant in the samples followed by alumina (Al2O3). Appreciable amounts of hematite (Fe2O3= 5.032) and potash (K2O = 3.446) were also present with traces (less than 1%) of total TiO2, MgO, MnO, CaO, Na2O and P2O5 for each of the oxides. The presence of Fe2O3, K2O, MgO, CaO and Na2O in the clay minerals was also advantageous to the preparation of thefired bricks because these materials could act asfluxes, which reduced the temperature needed for the formation of glassy material in the brick body, besides lowering the melting point of the clay (Liew et al., 2004). A loss on ignition (LOI) test was also performed on the clay soil. During the test, carbon dioxide (CO2) was possibly released from the sample, making it less acidic. As shown inTable 2, the LOI of the clay soil was approximately 9.60%, indicating low organic content in the soil sample. Meanwhile, the XRD pattern obtained on theb75μm fraction for this soil would indicate that thefine particles of the soil contained quartz as the leading crystalline phase with the presence of muscovite, kaolinite, clinochlore, mikasaite, and albite. The clay content (b2μm) in the brick soil was approximately 3%.
The clayfiring generates a mixture of gaseous compounds which are released into the atmosphere. The volatile gases commonly emitted are H2O, O2, CO, CO2, SO2, and NH3,and in certain cases F and Cl2, which are environmentally unsafe emissions and may cause serious deterioration
of furnace linings. Therefore, identifying the soil components that re-lease gases, such as organic matter, clay minerals, carbonates, sulphides, and sulphates, as well as determining the amount of released gases is essential for a detailed evaluation of the environmental impact of this industrial activity. The above is for clay bricks. For CB bricks, gases are generated as a result of clay composition as well as from the cellulose acetate, paper and the tobacco remnant in the CBfilter.
3.2. Estimated Total Emission (ETE) of clay brick samples
For each heating rate (0.7 °C min−1, 2 °C min−1, 5 °C min−1 and 10 °C min−1), the ETEs of each gas emitted (CO, CO
2, Cl2,HCN and NO) from the clay bricks were calculated using the trapezoidal method. The results are presented inTable 3. The results show that the ETE values for the clay brick samples decreased significantly as the heating rates increased from 0.7 °C min−1to 10 °C min−1for CO and NO. For CO2and HCN gases, lower ETE values were demon-strated at 0.7 °C min−1and 10 °C min−1respectively. Although the Cl2ETE values seemed tofluctuate at different heating rates, the low-est ETE value is still recorded at 10 °C min−1.
The ETE values that followed the decreasing trend were compared and it was observed that the ETE for CO decreased from 270.03 ppm·hr kg−1 to 79.29 ppm·hr kg−1 (71% less). As for NO, the ETE decreased from 72.09 ppm·hr kg−1 to 21.51 ppm·hr kg−1 (70% less) when the heating rate was increased from 0.7 °C min−1to 10 °C min−1(Table 3). In the case of CO
2and HCN, eventhough a de-creasing trend was observed starting from 2 °C min−1to 10 °C min−1, the lowest ETE was obtained at 2 °C min−1and 10 °C min−1with 89.30 ppm·hr kg−1, 90.25 ppm·hr kg−1, 3.33 ppm·hr kg−1and 4.83 ppm·hr kg−1respectively. The same reduction trend was ob-served in Cl2but the lowest gas concentration was 0.46 ppm·hr kg−1 at 10 °C min−1.
The results for clay bricks show that the lower ETE values obtained at fast heating rates (5 °C min−1and 10 °C min−1) could be due to the high concentration of water vapour which was maintained within the pore system and thus inhibited the organic content oxidation. Moreover, ac-cording toSantos et al. (2003)andToledo et al. (2004), CO2emissions are due to the oxidation of organic content, while CO evolution is due to incomplete oxidation of organic content. This condition explains the significantly decreasing values of these gases at fast heating rates.
[image:4.595.34.553.670.744.2]In contrast, at slow heating rates particularly at 2 °C min−1 accessi-bility to oxygen was expected to improve due to the low level of water vapour within the pore system. Under this condition, oxidation of organic content was able to occur completely because of the free water vapour pore system, thus producing higher gas emissions. In bricks, the pore system is important because it affects the gas emissions that occur during dehydration, oxidation, dehydroxylation, decomposi-tion and the formadecomposi-tion of new phases and vitrification that generally im-prove the product's mechanical strength, durability and other properties. A slow heating rate is preferable to prevent the texture from being disrupted by the evolution of water vapour (Murad and Wagner, 1998; Parsons et al., 1997; Santos et al., 2003; Toledo et al., 2004). However, it leads to higher gas emissions.
Table 3
ETEs calculated for clay bricks.
Heating rates (°C min−1
)
Heating time (h)
Firing time (h)
Mixture identification (%)
Estimated Total Emission (ETE) (ppm hr kg−1
)
CO CO2 Cl2 HCN NO
0.7 25 3 CB (0.0) 270.03 89.30 5.46 3.33 72.09
2 8.8 3 CB (0.0) 120.84 162.01 12.74 18.75 46.14
5 3.5 3 CB (0.0) 143.25 140.29 1.13 11.21 20.35
10 1.8 3 CB (0.0) 79.29 90.25 0.46 4.83 21.51
Table 2
Chemical composition of soil used in makingfired bricks.
Compound Formula Composition (wt.%)
SiO2 58.730
Al2O3 18.750
Fe2O3 5.032
K2O 3.446
MgO 1.639
TiO2 0.508
Na2O 0.204
CaO 0.189
3.3. Estimated Total Emission (ETE) of CB brick samples
The ETEs of CO, CO2, Cl2,HCN and NO determined from CB bricks are presented inTable 4. Similar reduction patterns at different heating rates were observed for most of the gases determined from CB brick samples during the experiment. Most of the gases obtained the lowest ETE at 10 °C min−1except for HCN at 0.7 °C min−1.
The ETE of CO decreased from 1583.80 ppm·hr kg−1to 303.66 ppm·hr kg−1(a reduction of 81%) at 0.7 °C min−1compared with 10 °C min−1. Meanwhile, Cl
2dropped from 5.15 ppm·hr kg−1to 0.38 ppm·hr kg−1at 0.7 °C min−1compared with 10 °C min−1. As for CO2, NO and HCN, lower ETE concentrations were obtained at 0.7 °C min. Then, the values dropped steadily at 2 °C min−1 com-pared with the values at 10 °C min−1. The ETE values reduced by 46% (from 3261.90 ppm·hr kg−1to 1751.90 ppm·hr kg−1), 76% (from 157.79 ppm·hr kg−1to 38.31 ppm·hr kg−1) and 66% (from 34.03 ppm·hr kg−1to 11.52 ppm·hr kg−1) correspondingly.
For CB brick samples, the ETE values were significantly higher for CB brick samples compared with clay brick samples whenfired at the same heating rates, especially for CO and CO2at 0.7 °C min−1and 2 °C min−1 respectively. However, the emissions for CB bricks dropped significantly at higher heating rates.
This condition is due to the additional organic content provided by the incorporation of CBs. The existence of CBs at slow heating rates also helps to improve the condition of the pore system in the brick. This reduces the water vapour level, thus increasing accessibility to oxygen. In this case, the oxidation of the organic content was almost completed, thus resulting in higher gas emissions. On the other hand, the gas concentrations released were significantly lower at higher heating rates (5 °C min−1and 10 °C min−1). As shown inTable 4, although some of the peak values of the gas emissions were quite high (due to the shorter time period of using high heating rates) the gas emissions were significantly lower over time.
3.4. Physical and mechanical properties of clay brick samples
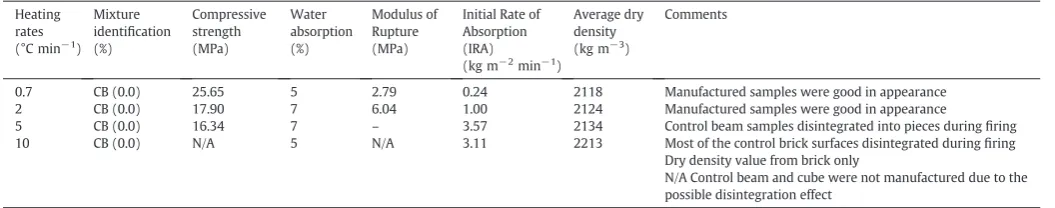
The effects of different heating rates on the physical and mechanical properties are presented inTable 5. Firing clay bricks at high heating rates (5 °C min−1and 10 °C min−1) reduced the measured values gradually but not significantly for compressive strength and water
absorption. The compressive strength values reduced from 25.65 MPa at 0.7 °C min−1to 17.90 MPa at 2 °C min−1, but as the heating rate in-creased to 5 °C min−1the strength slightly decreased to 16.34 MPa. The results indicate no significant changes between the applied heating rates. Furthermore, the results show that higher heating rates have in-significant effects on water absorption properties. The values increased from 5% at 0.7 °C min−1to 7% at 2 °C min−1and remained at 5 °C min−1 then reduced to 5% at 10 °C min−1. For tensile strength, the values in-creased from 2.79 MPa to 6.04 MPa as the heating rate inin-creased from 0.7 °C min−1to 2 °C min−1. However, this condition might be due to the different mixing times conducted on the brick samples for tensile strength.
On the other hand, higher heating rates appear to increase the initial rate of absorption values. Lower results were obtained at 0.7 °C min−1 with 0.24 kg m−2min−1but then increased to 1.00 kg m−2min−1at 2 °C min−1, followed by 3.57 kg m−2min−1and 3.11 kg m−2min−1 at 5 °C min−1and 10 °C min−1respectively. The same situation was ob-served for the dry density as the measured values gradually increased with higher heating rates. Dry density increased from 2118 kg m−3to 2213 kg m−3at 0.7 °C min−1and 10 °C min−1accordingly. High heating rates reduced the porosity and increased the density of the clay brick samples.
The obtained results indicate that careful selection of heating rates for thefiring process can still produce equivalent physical and mechanical properties of clay bricks. Furthermore, this study found that different heating rates affect the properties of clay brick although not critically. The advantages of using higher heating rates are shorterfiring duration, greater energy efficiency and lower gas emissions.
[image:5.595.43.565.77.152.2]Nonetheless, slow heating rates produced a better product in terms of appearance (Fig. 3). Clay bricks can only survive up to about 2 °C min−1to produce a good quality brick. At 5 °C min−1, good results for compressive strength, dry density and water absorption properties were obtained. However, only the brick and cube samples survived with minor disintegration effects and visible cracks as the beam samples disintegrated into pieces during thefiring process. Up to 10 °C min−1, even the brick samples hardly survived with most of the surface disintegrating during thefiring process. This situation is due to the sudden release of trapped gas or the expansion of trapped water in brick samples that have poor pore systems.
Table 5
Physical and mechanical properties of clay brick samplesfired at different heating rates.
Heating rates (°C min−1
) Mixture identification (%)
Compressive strength (MPa)
Water absorption (%)
Modulus of Rupture (MPa)
Initial Rate of Absorption (IRA) (kg m−2
min−1
)
Average dry density (kg m−3
)
Comments
0.7 CB (0.0) 25.65 5 2.79 0.24 2118 Manufactured samples were good in appearance 2 CB (0.0) 17.90 7 6.04 1.00 2124 Manufactured samples were good in appearance
5 CB (0.0) 16.34 7 – 3.57 2134 Control beam samples disintegrated into pieces duringfiring 10 CB (0.0) N/A 5 N/A 3.11 2213 Most of the control brick surfaces disintegrated duringfiring
Dry density value from brick only
N/A Control beam and cube were not manufactured due to the possible disintegration effect
–All manufactured samples were good in appearance except for samplesfired at 10 °C min−1
[image:5.595.41.569.631.735.2]when small parts of the brick surface disintegrated during thefiring process.
Table 4
ETEs calculated for CB bricks.
Heating rates (°C min−1
)
Heating time (h)
Firing time (h)
Mixture identification (%)
Estimated Total Emission (ETE) (ppm hr kg−1
)
CO CO2 Cl2 HCN NO
0.7 25 3 CB (5.0) 1583.80 2463.90 5.15 8.32 108.62
2 8.8 3 CB (5.0) 1227.00 3261.90 2.09 34.03 157.79
5 3.5 3 CB (5.0) 670.42 2410.80 1.28 14.83 90.98
3.5. Physical and mechanical properties of CB brick samples
The results for CB bricks by weight are summarised inTable 6. The strength values decreased from 14.25 MPa at 0.7 °C min−1to 10.05 MPa at 2 °C min−1. There was no significant difference between the compressive strength of bricksfired at 2 °C min−1and 5 °C min−1, which were 10.05 MPa and 9.40 MPa respectively. However, the strength reduced to 5.03 MPa with 10 °C min−1firing rate. Tensile strength values slightly decreased from 4.61 MPa at 0.7 °C min−1to 4.43 MPa and later dropped to 4.30 MPa, followed by 3.08 MPa at 2 °C min−1, 5 °C min−1 and 10 °C min−1respectively.
On the other hand, water absorption and initial rate of absorption in-dicate the same increasing trend whenfiring at high heating rates. The results increased from 11% to 14% for water absorption, while the initial rate of absorption values increased from 1.45 kg m−2 min−1 to 3.97 kg m−2min−1at 0.7 °C min−1and 10 °C min−1respectively. These results show that the porosity of the CB bricks increased with higher heating rates. This effect is different compared to clay bricks due to the addition of CBs. This was also established by the decreased value of dry density from 1901 kg m−3to 1853 kg m−3followed by 1736 kg m−3and 1680 kg m−3as higher heating rates were carried out at 0.7 °C min−1, 2 °C min−1, 5 °C min−1 and 10 °C min−1 respectively.
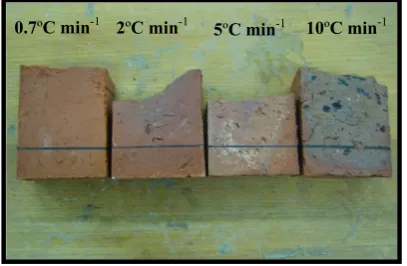
The incorporation of CBs in clay bricks to produce CB bricks also en-abled the manufactured samples to befired and survive high heating rates at up to about 10 °C min−1without facing any major disintegra-tion effect or cracks, as occurred with the clay brick samples. However, in terms of appearance, the manufactured brick samples with heating rates of 0.7 °C min−1and 2 °C min−1were slightly better compared to 5 °C min−1and 10 °C min−1in relation to the surface of the samples (Fig. 4).Fig. 5shows the cross-sections of manufactured samples at heating rates of 0.7 °C min−1, 2 °C min−1, 5 °C min−1and 10 °C min−1. At higher heating rates, black coring was observed due to
incomplete combustion of the organic content provided by the incorpo-rated CBs in the clay brick. The black coring effect was greater as the heating rate increased, especially at 10 °C min−1.Fig. 6clearly shows that at 10 °C min−1, even the bottom part of the manufactured samples was affected andfilled with dark spots.
4. Discussion
The results presented in this paper provide useful information in relation to clay bricks and bricks incorporating cigarette butts (CBs). In particular, it identifies the effect of four different heating rates (0.7 °C min−1, 2 °C min−1, 5 °C min−1and 10 °C min−1) on the bricks' estimated total gas emissions (ETEs), and physical and mechan-ical properties of the bricks.
The clay bricks were observed to have the lowest ETE results at different heating rates. By using one way ANOVA analysis, the results show that CO and Cl2were significantly reduced with pb0.05 at 10 °C min−1, NO at 5 °C min−1, CO
2and HCN at 0.7 °C min−1 corre-spondingly. Therefore, it is hard to choose one heating rate that could reduce all emissions whilefiring the control brick. Conversely, for CB brick, one way ANOVA analysis revealed that most of the ETE emissions significantly obtained the lowest values at 10 °C min−1for CO, CO2, Cl2, NO except for HCN at 0.7 °C min−1with pb0.05 respec-tively compared to other heating rates. Nevertheless, at 0.7 °C min−1 and 2 °C min−1respectively, significantly higher emissions of CO and CO2were observed for CB bricks due to the organic content and porous characteristic compared to the clay bricks. The oxidizing environment in clay brick and CB brick is not analogous as pore sys-tems are better in the CB brick. The improvement of the pore system enables a more complete oxidation process, thus resulting in the re-lease of higher gas emissions. However, significantly lower emis-sions can be achieved with higher heating rates (5 °C min−1and 10 °C min−1). Furthermore, many types offilters are available to re-duce gas emissions. Thesefilters include primary (focusing on the raw materials and process) and secondary (focusing on the gases re-leased)filters. Others include fabricfilters and wet scrubbers. One particularly commonly usedfilter is limestone (Monfort et al., 2008).
2
º
C min
-15
º
C min
-110
º
C min
-1 [image:6.595.62.259.54.205.2]0.7
º
C min
-1Fig. 4.Bricks with 5% CBsfired at 0.7 °C min−1
, 2 °C min−1
, 5 °C min−1
and 10 °C min−1
heating rates.
Table 6
Physical and mechanical properties of CB brick samplesfired at different heating rates.
Heating rates (°C min−1)
Mixture identification (%)
Compressive strength (MPa)
Water absorption (%)
Modulus of rupture (MPa)
Initial rate of absorption (IRA) (kg m−2
min−1
) Average dry density (kg m−3)
Comments
0.7 CB (5.0) 14.25 11 4.61 1.45 1901 Manufactured samples were good in appearance 2 CB (5.0) 10.05 10 4.43 1.32 1853 Some black coring was observed at the cross-sections of the
manufactured samples
5 CB (5.0) 9.40 15 4.30 3.99 1736 A medium degree of black coring was observed at the cross-section of the manufactured samples
10 CB (5.0) 5.03 14 3.08 3.97 1680 A large degree of black coring was observed at the cross-section of the manufactured samples and black spots were noticed at the bottom
2
º
C min
-15
º
C min
-110
º
C min
-1 [image:6.595.327.528.57.170.2]0.7
º
C min
-1Fig. 3.Clay bricksfired at 0.7 °C min−1
2 °C min−1
, 5 °C min−1
and 10 °C min−1
[image:6.595.32.567.639.744.2]The comparison between clay bricks and CB bricks also highlighted that different heating rates used during thefiring process showed minimal effects on the physical and mechanical properties of the tested samples. Results for clay brick samples reduced gradually but not significantly for strength and water absorption between heating rates of 2 °C min−1and 5 °C min−1. The initial rate of absorption and dry den-sity increased slightly as the heating rates increased. Findings from the CB brick samples indicated no significant difference between com-pressive strength and tensile strength measurements for bricksfired at 0.7 °C min−1, 2 °C min−1and 5 °C min−1. Meanwhile, slightly in-creased values for water absorption were observed when the heating rate was increased from 2 °C min−1to 10 °C min−1. Dry density values decreased steadily with the increase of heating rates. In terms of appear-ance,firing at 0.7 °C min−1and 2 °C min−1resulted in a better end product compared to 5 °C min−1and 10 °C min−1for both types of
fired brick samples. At 5 °C min−1, good results were obtained for dry density, compressive strength and water absorption properties as the properties are still comply with the standards, however the beam samples disintegrated and the tensile strength value was not obtain-ed for the clay brick samples. For CB bricks, because of the incorpo-ration of CBs into the clay bricks, the CB bricks werefired from about 5 °C min−1to 10 °C min−1without any major disadvantage, except for the black coring effect inside the brick due to incomplete combustion of the organic content. High heating rates are beneficial in brick manufacture in terms of energy and time consumption asfiring bricks at 5 °C min−1and 10 °C min−1could reduce the heating time by up to 21 h and 23 h respectively, compared with 0.7 °C min−1with lower emissions and significantly reduce energy consumption. There-fore, the heating rate is recommended to be increased as it could de-crease energy consumption and environmental pollution from gas emissions. This is also supported by the experimental work conducted
as the result showed that different heating rates have minimal effects on the properties of CB bricks.
Attempts were also made to solve major drawbacks offiring at high heating rates due to the disintegration effects by incorporating 3% of steelfibre into the clay brick and CB brick samples. The addition of steelfibre worked for the clay bricks as the manufactured samples enduredfiring at 5 °C min−1and produced better appearance with similar properties. Further research is strongly recommended, as the incorporation of small amounts of steelfibre could lead to the usage of higher heating rates in brick manufacturing which could significantly reduce emissions, time and energy consumption. For CB bricks, the addition of steelfibre did not significantly improve the properties or the appearance of the manufactured samples.
5. Conclusion
The research carried out in this study has established that higher heating rates could lead to significant reduction of gas emissions as most of the clay brick and CB bricks showed the lowest ETE values at 10 °C min−1eventhough few gases shown different results specifically for clay brick samples. Thus, selecting one specific heating rate for clay brick samples to reduce all the gas emissions duringfiring is difficult. On the other hand, in terms of physical and mechanical properties, clay brick demonstrated acceptable properties up to 2 °C min−1while CB brick is more resistant to high heating rates as it established accept-able properties up to 10 °C min−1. As for the appearance, lower heating rates produced a better end product compared with high heating rates for both types offired brick samples. However, building bricks and engi-neering bricks that is highly in demand focus more on the properties compared to facing brick which require a specific surface appearance and are normally used for aesthetic purposes. In conclusion, CB bricks and high heating rates should be considered as an option or an alterna-tive in the brick industry to minimise the manufacturing cost and time. The changes do not critically affect the properties offired clay bricks and they significantly reduce environmental pollution, thus offering the potential for greater energy efficiency. The focus of future work is to solve major drawbacks of the manufactured bricks caused by the disin-tegration effects whenfiring at high heating rates.
Acknowledgement
The results presented in this paper are part of an ongoing research on Recycling Cigarette Butts. The authors would like to thank Butt-out Australia and Boral Bricks Pty Ltd for supplying the cigarette butts and soil, respectively, for this study.
References
Abdul Kadir, A., Mohajerani, A.A., 2010.Possible utilization of cigarette butts in light-weightfired clay bricks. Int. J. Environ. Sci. Eng. 2 (3).
Abdul Kadir, A., Mohajerani, A.A., 2011.Recycling cigarette butts in light-weightfired clay bricks. Proc. Inst. Civ. Eng. (UK) 164 (5), 210–229.
Abdul Kadir, A., Mohajerani, A.A., Roddick, F., Buckeridge, J., 2010.Density, strength, thermal conductivity and leachate characteristics of light-weightfired clay bricks incorporating cigarette butts. Int. J. Environ. Sci. Eng. 2 (4), 1035–1040.
Australian/New Zealand Standards, 2003.AS/NZS 4456.0:2003. Part 0: general introduction and list of methods.
Australian/New Zealand Standards, 2003.AS/NZS 4456.1:2003. Method 1: sampling for test.
Australian/New Zealand Standards, 2003.AS/NZS 4456.14:2003. Method 14: determining water absorption properties.
Australian/New Zealand Standards, 2003.AS/NZS 4456.15:2003. Method 15: determining lateral modulus of rupture.
Australian/New Zealand Standards, 2003.AS/NZS 4456.17:2003. Method 17: determining initial rate of absorption (suction).
Australian/New Zealand Standards, 2003.AS/NZS 4456.4:2003. Method 4: determining compressive strength of masonry units.
Australian/New Zealand Standards, 2003.AS/NZS 4456.8:2003. Method 8: determining moisture content and dry density and ambient density.
2
º
C min
-15
º
C min
-110
º
C min
-1 [image:7.595.68.269.54.192.2]0.7
º
C min
-1Fig. 6.Bottom views of beams with 5% CBsfired at 0.7 °C min−1
, 2 °C min−1
, 5 °C min−1
and 10 °C min−1
heating rates.
2
º
C min
-15
º
C min
-110
º
C min
-1 [image:7.595.67.271.584.717.2]0.7
º
C min
-1Fig. 5.Cross-sections of beams with 5% CBsfired at 0.7 °C min−1
, 2 °C min−1
, 5 °C min−1
Cusido, J.A., Cremades, L.V., Gonzalez, M., 2003.Gaseous emissions from ceramics manufactured with urban sewage sludge duringfiring processes. Waste Manag. 273–280.
Dondi, M., Marsigli, M., Venturi, I., 1999.Microstructure and mechanical properties of clay bricks: comparison between fastfiring and traditionalfiring. Br. Ceram. Trans. 98 (1), 12–18.
Dunham, A.C., McKnight, A.S., Warren, I., 2001.Mineral assemblages formed in Oxford Clayfired under different time-temperature conditions with reference to brick manufacture. Proc. Yorks. Geol. Soc. 53 (3), 221–230.
Gonzalez, I., Aparicio, P., Galan, E., Fabbri, B., 2002.A proposal for reducing F and Cl emission in the brick industry using new formulations. Appl. Clay Sci. 22, 1–7.
Gonzalez, I., Galan, E., Miras, A., 2006.Flourine, chlorine and sulphur emissions from the Andalusian ceramic industry (Spain)—proposal for their reduction and estimation of threshold emission values. Appl. Clay Sci. 32, 153–171.
Gonzalez, I., Galan, E., Miras, A., Vazquez, M.A., 2011.CO2emissions derived from raw ma-terials used in brick factories. Applications to Andalusia (Southern Spain). Appl. Clay Sci. 52, 193–198.
Liew, A.G., Idris, A., Samad, A.A., Calvin, Wong, H.K., Jaafar, M.S., Aminuddin, M.B., 2004.
Incorporation of sewage sludge in clay brick and its characterization. Waste Manag. Res. 22, 226–233.
Monfort, E., Garcia-Ten, J., Celades, I., Gazulla, M.F., Gomar, S., 2008.Evolution offluorine emissions during fastfiring of ceramic tile. Appl. Clay Sci. 38, 250–258.
Morgan, D.J., 1993.Thermal analysis including evolved gas analysis of clay raw materials. Appl. Clay Sci. 8, 81–89.
Murad, E., Wagner, U., 1998.Clays and clay minerals: thefiring process. Hyperfine Interact. 117, 337–356.
Parsons, J., Inglethorpe, S.D.J., Morgan, D.J., Dunham, A.C., 1997.Evolved gas analysis (EGA) of brick clays. J. Therm. Anal. 48, 49–62.
Rasmussen, K.L., De La Fuente, G.A., Bond, A.D., Matheesen, K.K., Vera, S.D., 2012.Pottery
firing temperatures: a new method for determining thefiring temperature of ceramics and burnt clay. 39, 1705–1716.
Santos, D.R., Toledo, R., Faria Jr., R.T., Carrio, J.G., Da Silva, M.G., Auler, L.T., 2003.Evolved gas analysis of clay materials. Rev. Sci. Instrum. 74 (1), 663–666.
Shen, G., Xue, M., Wei, S., Chen, Y., Wang, B., Wang, R., 2013.Influence of fuel mass load, oxygen supply and burning rate on emission factor and size distribution of carbona-ceous particulate matter from indoor corn straw burning. J. Environ. Sci. 25 (3), 511–519.