Analytical method development and validation of lumefantrine in its bulk
dosage form by using RP-HPLC method as per ICH guidelines
Somsubhra Ghosh*, V. Shirisha and David Banji
Nalanda College of Pharmacy, Nalgonda, Andhra Pradesh, India
_____________________________________________________________________________________________
ABSTRACT
An accurate, precise, rapid & economical RP-HPLC method has been developed for the estimation of Lumefantrine as per ICH guideline in pharmaceutical dosage form using ultra violet (UV) detector. Elution was carried out using a mobile phase consisting of Acetonitrile & Methanol (90:10) and flow rate was set on 1.6 ml/min at 235 nm, retention time for Lumefantrine was found to be 1.770 min. The method was found to be linear in the concentration range of 100-500 µg/ml, in the linearity study regression equation was found to be y = 97.17x - 3.660 & correlation coefficient was found to be 0.999. This method was Rugged and Robust in different testing criteria, LOD and LOQ was found to be 10.0 µg / ml & 30.5 µg / ml respectively. Accuracy study was done in 3 different concentration level 50, 100, 150% & % recovery of the method was found to be 100.2%, 100.9%, 100.2% respectively in 3 different levels & mean recovery was 100.4%, so method was accurate. Results of all validation parameter was within the limit as per ICH guideline. So this method can be used for the determination of Bulk Drug as well as Tablet Dosage form easily and the method was precise, economical, and accurate to perform in future.
Key words: mobile phase, Rugged, Robust, Accuracy, Validation
_____________________________________________________________________________________________
INTRODUCTION
Lumefantrine is a Anti-Malarial Drug, molecular formula C30H32Cl3NO , IUPAC name 2-Dibutylamino-1-[2,7-dichloro-9-(4-chlorobenzylidene)-9H-fluoren-4-yl]-ethanol[1]. Mechanism action of drug Involves an interaction with ferrous ions, in the acidic parasite food vacuole, which results in the generation of cytotoxic radical species, mechanism of action of peroxide anti malarials involves interaction of the peroxide-containing drug with heme, a hemoglobin degradation byproduct, derived from proteolysis of hemoglobin, This interaction is believed to result in the formation of a range of potentially toxic oxygen and carbon-centered radicals[2].
Figure: 1. Shows structure of Lumefantrine
EXPERIMENTAL SECTION
Standard drugs
Lumefantrine was procured from the HETERO Pharma.
Chemicals and reagents
Methanol (FINER chemical LTD), Acetonitrile (Rankem chemicals), Purified water ((Rankem chemicals).
Instruments
HPLC (Analytical technologies), UV (Elico SL-196), Detector (UV detector, Analytical technologies), Column (Hypersil ODS C18, (150 *4.6 mm , 5µ), Software (Analchrome, Clarity), Sonicator (Analytical technologies).
Determination of absorption maxima by UV/Vis Spectrophotometry
Accurately weigh 100 mg of drug in to 100 ml volumetric flask. To this add 90 ml and 10 ml of diluents (acetonitrile 90: 10 methanol) and sonicate it and further make up the volume with diluent. From this take 1 ml and make up to 10ml. The solutions were scanned in the range of 200-400 nm in 1cm cell against blank
Figure: 2. Shows UV spectrum of Lumefantrine
Preparation of mobile phase
Accurately measured 90 ml of acetonitrile, 10 ml of methanol HPLC grade was degassed in an ultrasonic water bath for 10 minutes and then filtered through 0.45 µ nylon filter under vacuum filtration.
Diluent
Mobile phase is used as diluent
Standard preparation
Column temperature - 35̊c
Injection volume - 10 µl Run time - 5 min
Method validation
The following parameters were considered for the analytical method validation of Lumefantrine in bulk form.
System Suitability
Chromatograph the standard preparations (6 replicate injections) and peak area responses for the analyte peak was measured and the system suitability parameters are evaluated.
Accuracy
For accuracy determination, three different concentrations were prepared separately 50%, 100% and 150% for the analyte and chromatograms are recorded for the same.
Precision
The standard solution was injected for six times and the area was measured for all six injections in HPLC. The %RSD for the area of six replicate injections was found to be within the specified limits.
Robustness
As part of the Robustness, deliberate change in the temperature and flow rate Variation was made to evaluate the impact on the method.
Linearity and range
Linearity of the analytical method for assay by injecting the linearity solutions prepared in the range of 100µg to 500 µg (33.3% to 166.6%) of test concentration, into the chromatograph, covering minimum 6 different concentrations.
Ruggedness
Establish the ruggedness of the analytical method by using the assay of 6 different sample preparations of same batch by a different analyst using a different HPLC System.
RESULTS AND DISCUSSION
Standard preparation
Figure: 4. Shows sample chromatogram of Lumefantrine
Validation Accuracy
[image:4.595.72.528.71.215.2]Average recoveries of Lumefantrine are 100.2%, 101.2%, 100.4%, at 50%, 100% & 150% concentrations level respectively. The percentage recoveries of the drug is within the limits 99-102%. So the method is Accurate, accuracy data for Lumefantrine are presented in
Table: 1 .Shows Accuracy results of Lumefantrine
Concentration level Amount added (mg) Amount found(mg) %recovery Average % recovery
50% 25 mg 25 mg 25 mg 25.5 mg 25.4 mg 24.3 mg 102% 101.6% 97.2% 100.2% 100% 50 mg 50 mg 50 mg 50.5 mg 50.45 mg 50.40 mg 101% 100.9% 100.8% 100.9% 150% 75 mg 75 mg 75 mg
[image:4.595.120.479.320.456.2]75.5 mg 75.40 mg 74.65 mg 100.6% 100.5% 99.53% 100.2%
Table: 2 .Shows %Recovery of Lumefantrine
Amount added (mg) Amount found(mg) Average % recovery
50 mg 50.2 mg 100.4%
Precision
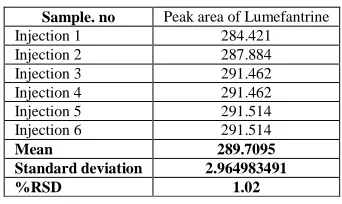
[image:4.595.212.383.531.633.2]Precision are summarized in Table No: 3, respectively. The %RSD values for Precession was less than 2.0%, which indicates that the proposed method is precise.
Table 3 .Shows precision results of Lumefantrine
Sample. no Peak area of Lumefantrine
Injection 1 284.421
Injection 2 287.884
Injection 3 291.462
Injection 4 291.462
Injection 5 291.514
Injection 6 291.514
Mean 289.7095
Standard deviation 2.964983491
%RSD 1.02
.
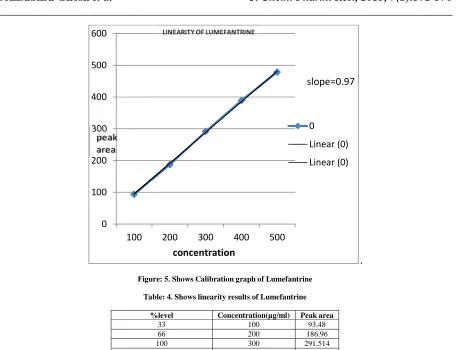
[image:5.595.73.534.81.431.2]Figure: 5. Shows Calibration graph of Lumefantrine
Table: 4. Shows linearity results of Lumefantrine
%level Concentration(µg/ml) Peak area
33 100 93.48
66 200 186.96
100 300 291.514
133 400 389.15
166 500 478.28
Y Intercept 96.18
Correlation co-efficient (r2) 0.999
Slope 0.9
Linearity range 100-500
Robustness Minor deliberate changes in different experimental parameters such as flow rate (±0.2ml) and temperature (±5̊ c) did not significantly affect the retention time & peak area of Lumefantrine indicating that the proposed method is robust which is mentioned in Table – 4 & 5
[image:5.595.156.455.86.346.2]
Table: 5. Shows robustness results of Lumefantrine (change in flow rate)
S.NO flow rate Peak area of Lumefantrine Average SD %RSD
1 1.4ml/min 79.921 78.910 79.4155 0.7 0.88
2 1.6ml/min 291.514 289.512 290.513 1.41 0.48
3 1.8ml/min 389.150 387.45 388.3 1.20 0.30
Table: 6. Shows robustness results of Lumefantrine (change in temperature)
S.NO Temperature Peak area of Lumefantrine Average SD %RSD
1 30 ̊c 291.462 285.452. 288.457 1.41 0.48
2 35 ̊c 287.884 285.882 286.883 1.415 0.49
3 40 ̊c 284.421 282.420 283.420 1.414 O.498
Ruggedness
The method is rugged by different analyst, different time intervals and the method did not significantly affect the recoveries, peak area and retention time of all the above drugs indicating that the proposed method is rugged which is mentioned in Table – 6.
0 100 200 300
100 200 300 400 500
0
Linear (0)
Linear (0)
[image:5.595.185.411.388.486.2]Table 7. Shows Ruggedness results of Lumefantrine
Name Peak area of Lumefantrine
Ruggedness-(Day-1) 295.230
Ruggedness-(Day-2) 297.238
Ruggedness-(Day-3) 297.238
Ruggedness-(Day-4) 305.319
Ruggedness-(Day-5) 305.319
Ruggedness-(Day-6) 308.437
Average 301.4635
SD 5.530383088
% RSD 1.83
[image:6.595.245.350.321.354.2]Limit of Detection (LOD)&LOQ The detection limit is determined by the analysis of samples with known concentration of analyte and by establishing that minimum level at which the analyte can reliably detected , The LOD are calculated from the calibration curve by formula LOD = 3.3 x SD/ b The quantification limit is generally determined by the analysis of sample with known concentrations of analyte and by establishing the minimum level at which the analyte can be quantified with acceptable accuracy and precision, The LOQ are calculated from the calibration curve by formula LOQ = 10 x SD/ b
Table: 8. Shows LOD & LOQ results of Lumefantrine
Parameters Lumefantrine
LOD 10.0 µg/ml
LOQ 30.5 µg/ ml
Table: 9. Shows summary of validation parameter Results
S.NO Parameter Acceptance criteria HPLC
1 %recovery 98-102% 100.4
2 Linearity range((µg/ml) - 100-500(µg/ml)
3 Correlation coefficient NLT 0.999 0.999
4 No .of Theoretical plates NLT 2500 3255
5 Precision %RSD (NMT 2%) 1.02
6 Intermediate precision %RSD (NMT 2%) 1.83
7 LOD - 10 µg/ml
8 LOQ - 30.5 µg/ml
CONCLUSION
Method development & validation of Lumefantrine was done by RP-HPLC method. The estimation was done by using Hypersil C18 (4.6 x 150mm, 5µm, Make: Analytical technologies) mobile phase as Acetonitrile, methanol (90:10) at a flow rate 1.6ml/min. The linearity range of Lumefantrine was found to be 100-500 µg/ml. Correlation coefficient value was 0.999, values of % RSD was 1.02 which is within the limit. These results show the method is accurate, precise, sensitive, economic & rugged. The HPLC method is more rapid. The proposed method is successfully applied to the bulk dosage form. The method was found to be having suitable application in routine laboratory analysis with high degree of accuracy and precision.
Acknowledgement
We are very thankful to authorities of Nalanda College of Pharmacy for providing the facilities to complete this research work.
REFERENCES
[1]Available at: http://en.DBO67O8
[2]Available at http://www.ualberta.ca/82186-77-4
[3]R Prasanna; D Saravanan; J Padmavathy; K Boopathi. International J of Pharma Res and Development 2014, 2(8), 84-90.
[image:6.595.173.424.376.485.2]