Journal of Chemical and Pharmaceutical Research, 2014, 6(6):2553-2557
Research Article
CODEN(USA) : JCPRC5
ISSN : 0975-7384
Using data mining and UV-VIS spectrophotometric to determine the content
of bisphenol A in plastics
Peijian Zhang, Cuili Gao, Bingbing Zhao and Gengxin Sun
Qingdao University, Qingdao, Shandong Province, China
_____________________________________________________________________________________________
ABSTRACT
A new UV-VIS Spectrophotometric method for the determination of BPA in plastics was established based on its inhibitory effect on acridine orange oxidation which is caused by hydroxyl radical from Fenton reaction in acid medium. The influences of acidity, concentration of reactants, reaction time, reaction temperature, and foreign ions and distractors were found by data mining, and the optimum reaction conditions were established based on data analysis result. The results which were provided by optimal reaction conditions show that there was a linear relationship between the absorption change of AO and the concentration of BPA with the linear regression equation as ∆A=0.643lgc-0.544.The method was used in the determination of BPA in 4 samples, the relative standard deviations were 1.64 %~3.04% and the recoveries were 95. 0%~104.3% with satisfactory results.
Key words: BPA; AO; Fenton reaction; UV-VIS Spectrophotometry
_____________________________________________________________________________________________
INTRODUCTION
Bisphenol A(BPA or 4, 4’-isopropylidenediphenol), a xenoestrogen compound, is a pervasive endocrine-disrupting chemical used in the manufacturing industry as an important intermediate in the production of polycarbonate plastics and epoxy resins, found in everything from beverage containers, drinking water barrel, plastic toys to the lining of food packaging[1]. BPA can inevitably migrate into foodstuffs and beverages from packing of product, and then trace amounts of BPA may be routinely ingested, which may lead to the damage of human health[2]. Recent studies indicate that BPA is a kind of typical environmental estrogen which can potentially interfere with the endocrine system of wildlife and human, increase the cancer rate, reduce immune function and impair reproduction[3]. Given the existing problems of food flexible packaging materials with BPA, China, Norway, Canada, the United States, Sweden and other countries have banned the import and sale of polycarbonate plastic baby bottles containing BPA[4]. Nowadays, the detection of BPA has already been a hot research topic in the world.
To date, the analysis of BPA has mainly been accomplished by gas chromatography (GC)[5], high performance liquid chromatographyt(HPLC)[6], chromatography (GC) and liquid chromatography (LC), with either GC or LC coupled to mass spectrometry (MS)[7-9]. The catalytic-kinetic spectrophotometric method for trace determination of some special chemical substances has been reported recently[10-12], with its advantages of high sensitivity, sufficient accuracy, simple procedures, and necessity of less expensive apparatus.
EXPERIMENTAL SECTION
2.1. Apparatus and Reagent
A T6 UV-VIS Spectrometer (Pgeneral, Beijing, China) was used for recording spectra and making absorbance measurements. A Model HH-6 thermostatic water bath was used to control the reaction temperature. A pHs-3c meter (SPSIC, Shanghai, China)was used for measuring the pH values of the solutions. And a Model SK7200H ultrasonic cleaning instrument was used for extraction of BPA prior to its determination.
The BPA stock solution (1.0 mg/mL) was prepared by dissolving 100.0mg BPA(99.8%, Aladdin, Shanghai, China) in methanol solution in dark amber 100-mL volumetric flask, and then was kept away from light and stored at 4 ℃ in a refrigerator. More dilute solutions were prepared from this stock solution when required.
The concentration of Acridine orange(AO) water solution was 0.1mg/mL; sulfuric acid solution was 5.0×10⁻⁴mol/L; Ferrous sulfate solution was 1.0×10⁻³ mol/L; H2O2 solution was 0.006%. All chemicals used were of analytical grade. Distilled deionized water was used throughout the experiment.
2.2. Procedure
Pipet 3.0 mL AO solution into a 25 mL volumetric flask, and then, 2.5mL sulfuric acid solution, 2.5 mL Ferrous sulfate solution, 2.0 mL H2O2 solution, a definite amount of 1.0 µg/mL of BPA standard solution were also added, and then diluted with distilled deionized water to volume and mixed well. In the meantime a blank experiment without the BPA solution was also made. Both the blank and test solutions were heated in the water bath at 50.0 ± 0.2℃for 10 mins and then let it be cooling naturally to room temperature. The absorbance of the catalytic reaction (A) and the noncatalytic reaction (A0) at the wavelength of 491 nm against water was measured. Then, the rate of reaction, ∆A=A-A0, was calculated
RESULTS AND DISCUSSION
3.1 Select the Wavelength of Maximum Absorption
The absorption spectra of both the blank and test solutions were measured under the experimental conditions. Fig.1 shows that the inhibitory effect of BPA on AO oxidation which is caused by hydroxyl radical from Fenton reaction in acid medium, was significant. Based on its inhibitory effect, a new UV-VIS spectrophotometry method for the determination of trace amount of BPA was established. As seen in fig.1 the wavelength of maximum absorption of the solutions was 491 nm. And so 491 nm was selected as the detection wavelength in this experimental study.
2 . 0 2 . 5 3 . 0 3 . 5 4 . 0 4 . 5 5 . 0
0 . 4 0 . 5 0 . 6 0 . 7 0 . 8
Δ
A
p H v a l u e
3.2 Determination of the Optimal Determination Conditions
In this section, multi-source data have been analyzed by association rules mining and results indicate that the absorbance of reaction system have strong association with the concentration of the reactants, pH, reaction temperature and reaction time. Therefore, the effects of these variable factors on the reaction system were prerequisite. The corresponding change of ∆A value revealed that the reaction rate of these different systems depended on influencing factors discussed above. The data analysis in following parts are executed by R which is popular software in statistics.
3.2.1 The Effect of pH Value in Reaction Medium
Previous study has showed that optimal range of pH value in this reaction system was 2.0~5.0[14]. The pH range of the reaction system was 2.0~5.0 in sulfuric acid and the experimental results was shown in Fig.2. It can be seen from Fig.2 that there was a higher platform in the pH value range of 3.5~4.5, which was identical with the suitable conditions of Fenton reagent reaction reported in literature[14]. In this experimental study, the pH 4.0 is used to
4 0 0 5 0 0 6 0 0 7 0 0
0 . 0 0 . 5 1 . 0 1 . 5 2 . 0
A b s o r b a n c e ( A )
W a v e l e n g t h ( n m )
1
2
3
4
Fig.1 UV-VIS absorption spectrum of different reaction systems Fig.2 Effect of pH on the ∆A value in reaction systems
1. AO+H2SO4 ;
2. AO+ H2SO4+FeSO4+ H2O2+BPA(80ng/mL);
3. AO+H2SO4+FeSO4+ H2O2+BPA(40ng/mL);
control the acidity of the system. Thereby pH 4.0 was selected as the optimum pH in this experimental study.
3.2.2 The Effect of Amount of AO in Reaction System
The effect of AO amount was studied in the range of 1.0mL to 5.0 mL, the experimental results were shown in Fig.3 which showed that within certain range, less AO amount led to slower reaction rates. With the increase of amount of AO the reaction rate increased and there was a relatively higher platform within the amount of AO range of 2.5~4.0mL and then ∆A decreased again. The decreasing of ∆A in the reaction system, when larger than 5mL amount of AO was used, was probably due to selfpolymerization of AO which led to the decreasing the reaction rate. In this paper, the suitable amount of AO was chosen as 3.0 mL.
3.2.3 The Effect of Amount of Ferrous Sulfate in Reaction Systems
In this study, the effect of ferrous sulfate amount was in the range of 0.5~ 5.0 mL, which was shown in Fig.4. The results indicated that the ∆A value of this reaction system climbed up and then declined with the increase of ferrous sulfate amount. Therefore the suitable amount of ferrous sulfate should be in the range of 2.0~3.0mL. Maybe it was just because in certain range ferrous sulfate as catalyst could increase reaction rate to a plateau. When continuing to increase the amount of ferrous sulphate that can react with H2O2, this side reaction decreased the reaction rate in the reaction system. In this article, the suitable amount of ferrous sulfate was chosen about 2.5 mL.
1 2 3 4 5
0 . 1 0 . 2 0 . 3 0 . 4 0 . 5 0 . 6 0 . 7 0 . 8
Δ
A
A m o u n t o f A O / m L
0 1 2 3 4 5
0.3 0.4 0.5 0.6 0.7 0.8
Δ
A
Amount offerrous sulfate/mL
3.2.4 The Effect of H2O2 Amount in Reaction System
In this study, the effect of H2O2 amount was in the range of 0.5~5.0mL, keeping all other experimental variables at constant known values. The experimental results were shown in Fig.5. According to the results, the suitable amount of H2O2 should be in the range of 2.0~2.5mL, because the lower amount of H2O2 led to less hydroxyl radical. While more H2O2 was added into the reation system, rapid and invalid decomposition of H2O2 brought about lower oxidation effectiveness. In this article, the suitable amount of H2O2 was chosen about 2.0mL.
0 1 2 3 4 5
0.3 0.4 0.5 0.6 0.7 0.8
Δ
A
Amount of hydrogen peroxide/mL
2 0 4 0 6 0 8 0
0 . 3 0 . 4 0 . 5 0 . 6 0 . 7 0 . 8
Δ
A
R e a c t i o n T e m p e r a t u r e / ℃
3.2.5 The Effect of Reaction Temperature in Reaction Systems
The influence of reaction temperature on the reaction systems was studied in the range of 20~70°C. Fig.6 showed the results that the ∆A value of this reaction system first increased and then decreased with the suitable reaction temperature in the range of 40~50℃, because the reaction rate was very slow when the reaction temperature was under 40℃, so there was not enough hydroxyl radical to participate in the reaction of AO oxidation. Hydroxyl radical increased along with the increase of reaction temperature which will inhibit the reaction when it was
Fig.4 Effect of ferrous sulfate amount on the ∆A value in reaction systems
Fig.3 Effect of AO amount on the ∆A value in reaction systems
Fig.5 Effect of H2O2 amount on the ∆A value in reaction systems
Fig.6 Effect of reaction temperature on the
beyond 50℃, because there would be more rapid and invalid decomposition of H2O2 and the side reaction could cause lower oxidation effectiveness. In this article, to shorten the analytical time, the reaction system was heated in water bath at 50.0 ± 0.2℃for 10 mins.
3.2.6 The Effect of Reaction Time in Reaction System
Under the selected working conditions, the influence of reaction time on the oxidation was studied in the range of 5~90mins and the results were presented in Fig.7 which showed that after the reaction system was naturally cooled to room temperature, the ∆A value was nearly invariable during 90 minutes. In this article, the absorbance was measured after the reaction system was naturally cooled to room temperature.
3.3 Effect of Foreign Ions in Reaction Systems
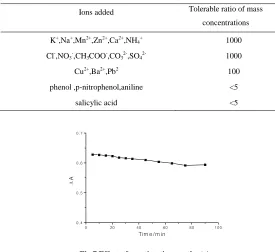
Under the optimal experimental conditions described above, the influence of foreign ions on the determination of 0.2 µg/mL BPA was examined. The criterion for interference was fixed at a relative error of less than ±5% of the average absorbance. The results were summarized in Table 1. In Table 1 it was clear that inorganic ions, such as K+,Na+,Mn2+, 1000 times excess over the content of BPA, would not noticeably affect the accuracy of the BPA determination. However, some organic ions such as phenol, p-nitrophenol, aniline and salicylic acid existing in 5 times excess over the content of BPA, did affect the accuracy of the BPA determination. The influence of these organic ions could be eliminated by ion exchange resin. The results were listed in Table 1.
Ions added Tolerable ratio of mass concentrations K+,Na+,Mn2+,Zn2+,Ca2+,NH
4+ 1000
Cl-,NO
3-,CH3COO-,CO32-,SO42- 1000
Cu2+,Ba2+,Pb2 100
phenol ,p-nitrophenol,aniline <5
salicylic acid <5
3.4. Linear Range and Detection Limit
The calibration graph of the determination BPA was obtained under the following optimum conditions: 3.0 mL AO solution, 2.5 mL sulfuric acid solution, 2.5 mL ferrous sulfate solution and 2.0 mL H2O2 solution, the mixed solution was heated in the water bath at 50.0 ± 0.2℃ for 10 mins and then let it be cooling naturally to room temperature, with the detection wavelength 491 nm. A linear calibration graph was obtained over a concentration range of 0.1-200 ng/mL for BPA with a correlation coefficient of 0.9991 and then a regression equation as
∆A=0.643lgc-0.544, and the detection limit was 0.05ng/mL. The relative standard deviations of the determination
BPA was 1.43% for the BPA standard solutions with the concentration of 4 ng/mL.
SAMPLE ANALYSIS
[image:4.595.168.443.322.574.2]
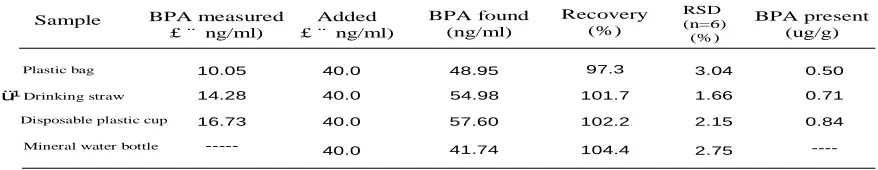
The proposed method was applied to determine trace BPA in 4 types of plastic samples from Qingdao marketplace. The samples were cleaned by redistilled water for 3 times and evaporated to dryness then cut into pieces. Known amounts of plastic samples were added to a conical flask and diluted with 200 mL redistilled deionized water, then
Table 1:Maximum tolerance mass ratio of various ions on the determination of 0.2 µg·mL−1 BPAunder the selected chemical conditions
0 2 0 4 0 6 0 8 0 1 0 0
0 . 4 0 . 5 0 . 6 0 . 7
Δ
A
[image:4.595.168.443.329.548.2]T i m e / m i n
the conical flask was put into the water bath at 80.0 ± 0.2℃ for 90 mins, and ultrasonic extraction was applied to extract BPA from the above solution at 70.0 ± 0.2℃ for 90 mins. After 24 hour' standing, carefully transferring 10 mL of this solution to a 25-mL volumetric flask, then the determination of BPA was carried out under the following optimum conditions: 3.0 mL AO solution, 2.5 mL sulfuric acid solution, 2.5 mL ferrous sulfate solution and 2.0 mL H2O2 solution. The mixed solution was heated in the water bath at 50.0 ± 0.2℃for 10 mins and then let it be cooling naturally to room temperature. The analytical results of the samples were shown in Table 2.
Table 2:The detection results of 4 different types of samples
BPA measured £ ¨ ng/ml)
Added £ ¨ ng/ml)
BPA found (ng/ml)
Recovery (%)
RSD (n=6)
(%)
BPA present (ug/g) Sample
Plastic bag
ü¹Drinking straw
Mineral water bottle
14.28
16.73
---40.0
40.0
40.0
40.0
48.95
54.98
57.60
41.74
97.3
101.7
102.2
104.4
3.04
1.66
2.15
2.75
0.50
0.71
0.84
----10.05
Disposable plastic cup
CONCLUSION
This article described a method combining data mining and UV-VIS spectrophotometric for the determination of trace amount of BPA in 4 types of plastic samples. The process of experiment reveals that as a tool, computer algorithms or methods can play important roles in chemical data processing. The developed method was accurate, rapid, and cheaper, and its recovery results for the determined samples were satisfactory.
REFERENCES
[1] Jeong-Hun Kang, Fusao Kondo, et al.Toxicology.2006, 226(2-3): 78-79
[2]Cao X L, Perez-Locas C, et al.Food Addit Contam. 2011, 28: 791–798
[3]B.S. Rubin.Steroid Biochem. Mol. Biol, 2011, 127(1–2): 27-34.
[4]Lai Y, Wang H H, Cai L X, et al.Chinese Journal of Analysis Laboratory, 2012, 31(3): 43-46
[5]SNCHEZ-BRUNETE C, et al.Journal of Chromatography A, 2009, 1216 (29): 5497-5503.
[6] Tian H Z, Xu J.Food Science and Technology, 2012, 37(8): 286-289.
[7] Gao Y G, Zhang Y Y, Zheng L S, et al.Chinese Journal of Chromatography, 2012, 30(10):1017-1020.
[8]Janis L, Coughlin Bozena, Winnik Brian Buckley.Anal Bioanal Chem, 2011, 401: 995-1002.
[9]Xiao J, Shao B, Wu X Y, et al.Biomedical and Environmental Sciences, 2011, 24(1): 40-46.
[10]Liu Y Y, Wang P. Rare Metals, 2009, 28(1): 7-9
[11] Ding Y Q, Sun W, Gao R F, et al.Chinese Journal of Biochemical Pharmaceuti, 2006, 27(2):68-70.
[12]Bao Z J, Wu W J, Jia R, et al. Chinese Journal of Spectroscoppy Laboratory, 2010, 27(6): 2222-2226.
[13]GB/ T 5009. 156- 2003.The general principles of the immersion test method used for food packaging materials
and products[S].