Average Surface Roughness Measurement Using
Photometric Stereo Method
Thammarat Somthong
*,
Qing-Ping Yang
College of Engineering, Design and Physical Sciences, Brunel University London, UK
Copyright©2016 by authors, all rights reserved. Authors agree that this article remains permanently open access under the terms of the Creative Commons Attribution License 4.0 International License
Abstract
This paper presents a technique for measuring surface roughness (Ra), using photometric stereo method. The method utilizes three or more images of the measured surface from the same view point, taken sequentially under different illumination conditions. The scenes captured by the camera were reconstructed by the least square method to obtain surface normal from surface topography. Three-dimensional surface textural patterns were recovered from those surfaces normal. The system was validated with three standard surface roughness specimens. The Ra calculated from the recovered surface was compared with the nominal value of the standard surface roughness. The best coefficient of the slant angles can also be determined through the linear regression. The experimental results indicate that the technique can be applied to well recoverstandard surface roughness.Keywords Surface Texture, Photometric Stereo,
Measurement, Imaging Techniques1. Introduction
Computer graphics techniques have been extensively popular in the measurement system. The quality of components produced is of major concern in industrial manufacturing, and it is closely related to dimensional accuracy, form and surface finish. Surface topography, especially surface roughness, has an essential role to determine the functional performance of machine parts. The measurement of engineering surface roughness is becoming increasingly important. The traditional way of measuring surface topography is mechanical – most existing roughness standards are defined using stylus instruments that normally use a diamond stylus. Stylus can usually scratch the measured surface and may not be suitable when the measured surfaces are very soft, for example, in biological systems or polymers. In the last few decades, alternative methods rather than stylus have been developed. Those can be loosely divided into optical methods (such as vertical scanning interferometry) and non-optical methods (such as scanning tunneling microscopy) [1] [3].
Recently, photometric stereo method has been considered
as a technique for roughness measurement. The photometric stereo is a method for evaluation of shape and reflectance of an object using three or more images under different lighting positions [7]. The method uses different lighting conditions to mainly measure the gradient field of the surface, which is calculated from an array of surface normal. The gradient field can be therefore considered to be the measurement results. The surface texture can be calculated from the obtained depth information [2] [4] [5].
In this paper, we consider the slant and tilt angles which are suitable for measuring different roughness ranging from 12.5 µm to 50 µm. The Ra is then reconstructed by combining three images, each at a tilt angle with the object. By using the reconstructed Ra of the objects, parameters of a reflection model are estimated in a robust manner. The key point of the proposed method is that the linear regression technique was applied to find the best coefficient between image intensities and roughness.
2. Operating Principle
The Reflectance Model
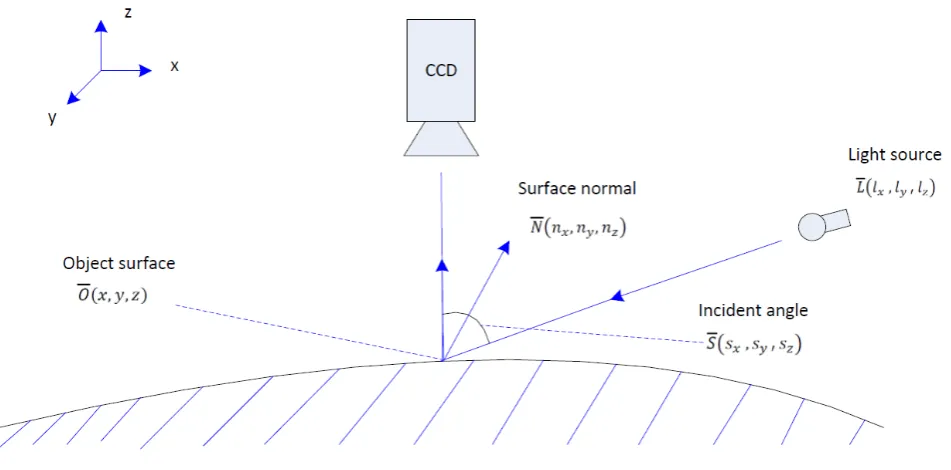
Intensity values are known from image sets that recorded a reflected radiance from the illuminated objects. There are many contributing factors relating to the reflected radiance when the incident light has constant direction and intensity, e.g. the physical properties and shape of the measured object. If the surfaces are rough enough so that all incident light beams are diffusively reflected to all directions, these surfaces are so-called lambertian surfaces [6]. According to the lambertain reflectance model, the light (I) reflected from an object’s surface is related to the surface albedo (ρ) and the cosine angle of the incident light (k) as given in Eq. (1).
𝐼𝐼=𝜌𝜌𝜌𝜌cos(𝜃𝜃𝑖𝑖) (1)
Photometric Stereo (PS)
Figure 1. Photometric stereo system
When three images with the same view are taken under different lighting directions, three reflectance maps are provided for solving a linear system of three unknown surface normals (𝑛𝑛𝑥𝑥,𝑛𝑛𝑦𝑦,𝑛𝑛𝑍𝑍). The cosine of the incident
angle can also be denoted as dot product, as shown in Eq. (2), where𝑆𝑆���⃗represents the unit vector of light source direction and the unit vector 𝑁𝑁��⃗ represents the surface normal:
𝐼𝐼=𝜌𝜌�𝑆𝑆⃗ ∙ 𝑁𝑁��⃗� (2) In case of three images being utilized by the measurement system,
�𝐼𝐼𝐼𝐼12
𝐼𝐼3
�= 𝜌𝜌 �
𝑠𝑠𝑥𝑥1 𝑠𝑠𝑦𝑦1 𝑠𝑠1𝑧𝑧
𝑠𝑠𝑥𝑥2 𝑠𝑠𝑦𝑦2 𝑠𝑠2𝑧𝑧
𝑠𝑠𝑥𝑥3 𝑠𝑠𝑦𝑦3 𝑠𝑠3𝑧𝑧
� �𝑛𝑛𝑛𝑛𝑥𝑥𝑦𝑦
𝑛𝑛𝑧𝑧
� (3)
In Eq. (3), (𝐼𝐼1,𝐼𝐼2,𝐼𝐼3) represent the image intensity values
at image location (x, y). Unknown surface albedo is denoted by𝜌𝜌. The unknown components of the surface normal is represented by (𝑛𝑛𝑥𝑥,𝑛𝑛𝑦𝑦,𝑛𝑛𝑍𝑍), and (𝑠𝑠𝑥𝑥,𝑠𝑠𝑦𝑦,𝑠𝑠𝑍𝑍) are the known
components of light source vector, where numbers 1, 2 and 3 indicate light direction. To solve the unknown surface reflectance factor and surface normal, the following relation has to be used:
𝐼𝐼⃗(𝑥𝑥,𝑦𝑦) =𝜌𝜌(𝑥𝑥,𝑦𝑦)[𝑆𝑆]𝑁𝑁��⃗(𝑥𝑥,𝑦𝑦) (4) To determine the surface normal, N, in Eq. (4), the following relation can be utilized from Eq. (5), where the lighting directions, S, must not be coplanar to a plane.
𝑁𝑁��⃗(𝑥𝑥,𝑦𝑦) = 𝜌𝜌(𝑥𝑥1,𝑦𝑦)[𝑆𝑆]−1𝐼𝐼⃗(𝑥𝑥,𝑦𝑦) (5)
The least squares technique can be utilized to calculate Pseudo-Inverse and local surface gradients
𝑝𝑝(𝑥𝑥,𝑦𝑦) and𝑞𝑞(𝑥𝑥,𝑦𝑦). The local surface normal 𝑁𝑁��⃗(𝑥𝑥,𝑦𝑦) can also be calculated from the Pseudo-Inverse using Eqs. (6)-(8) where 𝑀𝑀��⃗(𝑥𝑥,𝑦𝑦) =�𝑚𝑚1(𝑥𝑥,𝑦𝑦),𝑚𝑚2(𝑥𝑥,𝑦𝑦),𝑚𝑚3(𝑥𝑥,𝑦𝑦)�.
𝑀𝑀��⃗(𝑥𝑥,𝑦𝑦) =𝜌𝜌(𝑥𝑥,𝑦𝑦)𝑁𝑁��⃗(𝑥𝑥,𝑦𝑦) = ([𝑆𝑆]𝑇𝑇[𝑆𝑆])−1[𝑆𝑆]𝑇𝑇𝐼𝐼��⃗(𝑥𝑥,𝑦𝑦) (6)
𝑝𝑝(𝑥𝑥,𝑦𝑦) = 𝑚𝑚1(𝑥𝑥,𝑦𝑦)
𝑚𝑚3(𝑥𝑥,𝑦𝑦), 𝑞𝑞(𝑥𝑥,𝑦𝑦) =
𝑚𝑚2(𝑥𝑥,𝑦𝑦)
𝑚𝑚3(𝑥𝑥,𝑦𝑦) (7)
𝑁𝑁(𝑥𝑥,𝑦𝑦) = �𝑝𝑝(𝑝𝑝𝑥𝑥(,𝑦𝑦𝑥𝑥,)𝑦𝑦2),+𝑞𝑞𝑞𝑞((𝑥𝑥𝑥𝑥,𝑦𝑦,𝑦𝑦),)12+1 (8)
Surface Texture
Surface measurement usually yields the information in two types, i.e. the roughness and the waviness. These parameters can be used to explain and predict the performance and problems of machine tools. Filtering techniques are applied to separate roughness and waviness from the surface topography.
The surface profile parameters are defined by ISO 4287:1997 which encompasses five groups of texture parameters, including amplitude parameters (peak and valley), amplitude parameter (average of ordinates), spacing parameters, hybrid parameters, and curves and related parameters [11].
The surface roughness parameter used throughout this study is the arithmetical mean of the surface profile (Ra). This parameter is also the most widely used surface finish parameter by researchers and industries. Ra is the arithmetic average of the absolute value of the heights of roughness irregularities from the mean value measured [8] [9, p.7]. It can be described in mathematical function as
𝑅𝑅𝑎𝑎=𝑁𝑁1∑𝑁𝑁𝑖𝑖=1|𝑍𝑍𝑖𝑖| (9)
where 𝑍𝑍𝑖𝑖 is the height of roughness irregularities from the
3. System Designs
Optimal Lighting Position
Spence and Chantler [6] worked with three lights of equal slant and using numerical optimisation they concluded that the normals are best recreated when the light sources are 120◦apart, and of slant 55◦. This corresponds to
[image:3.595.80.266.197.366.2]orthogonallight directions and is in full agreement with the results derived from the theory presented here.
Figure 2. Slant and tilt of a light source
In figure 2, the angle between light source (l) and viewing vector (v) is the slant angle (θ). Τilt (φ) is the angle between the projection of l onto the viewing plane (x-y) and the x-axis.
Proposed Photometric Stereo System
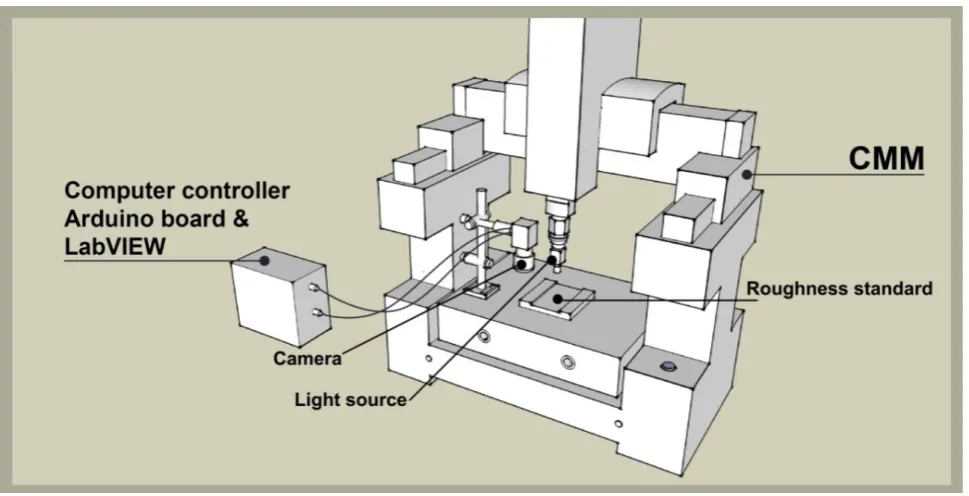
Fig. 3 illustrates the PS system set up on the Coordinate measuring machine (CMM) for surface roughness measurement. The roughness standard is mounted at centre of the measuring table. The light source is assumed to be a point source with a constant incident illumination over the scene.
The purpose of the experimental work was to investigate the practical application of PS techniques for measuring Ra from surface texture. The nominal values of standard surface roughness which included 12.5 um, 25 and 50 um were applied to validate the PS system. Three differing standard surface roughness was viewed by a vision system constrained pose as their position. The light source was attached with the CMM’s probe, which was able to move tilt and slant angles. The sensitivity of the technique to the slant angle was investigated. Three slant angles were examined: θ = 37.5◦, 45◦ and 52.5◦. The optimal illumination
configuration with regard to tilt angle is considered to be an intuitive result since the three vectors are equally spaced at 120◦ apart.
[image:3.595.64.549.402.650.2]Measurement Method
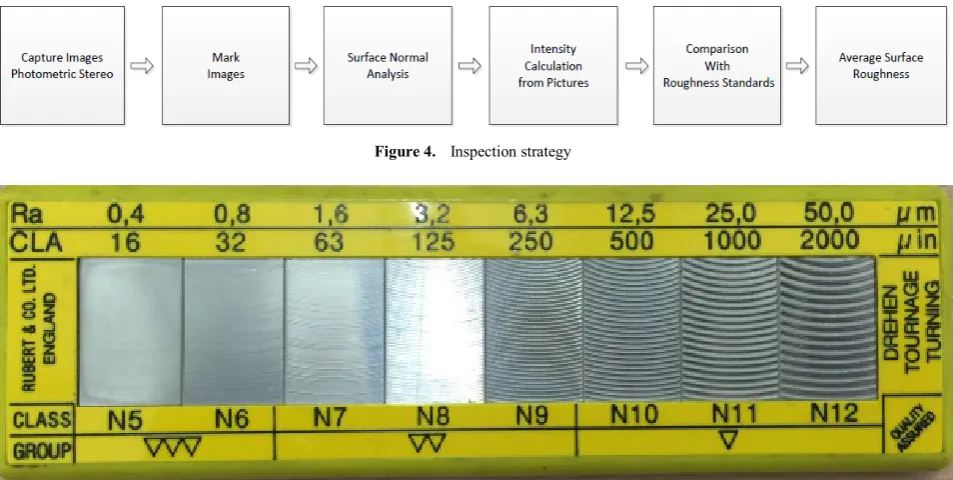
Using the PS method for measuring surface texture can be written as block diagrams in Fig. 4.
The block diagrams show the six steps for measurement method. The Kingbright 52 mm cluster is used as the light source to create a stable and well-controlled illumination condition. The images with a dimensional size 512 × 320 pixel are captured from the Basler Ace Digital Gigabit Ethernet camera with a 16× optical zoom lens. Those images acquired from each tilt angle are precisely performed by the CMM’s movement. In case of mark images, the area of interest is selected by Matlab programming. Gradient space plots are generated and analysed for all standard surface roughness. The surface normal is therefore calculated by the least squares technique following by Eq. (8). Therefore, accurate shape reconstruction results can be achieved. Twelve lines on the scene coming from pixel points are then chosen for intensity calculation and compared with the
roughness standards.
4. Experimental Results
Estimated Average Surface Roughness Profile
In this research, all images were acquired in a darkroom so that the influence of unwanted extra light was prevented in the scenes. The three nominal values of surface roughness standard Type D following ISO 5436-1 were utilized as the reference of our system.
[image:4.595.68.545.312.552.2]The original scenes of the surface roughness standard fewer than three light directions are shown in Fig. 6. The idealised simulated surface roughness standard from the PS system is shown in Fig. 7. The 3D recovery of the surface roughness standard measured using from the PS system is illustrated in Fig. 8.
[image:4.595.64.542.582.689.2]Figure 4. Inspection strategy
Figure 5. Surface roughness standard Type D following ISO 5436-1
Figure 7. Idealised simulated surface roughness standard
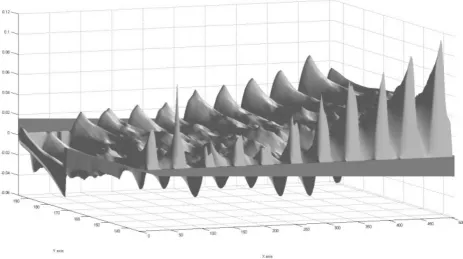
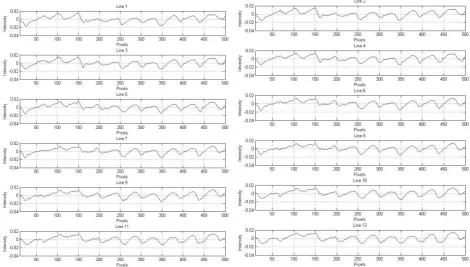
[image:5.595.73.537.449.708.2]Figure 9. Surface roughness profiles
Computing Average Surface Roughness Using Photometric Stereo Method
The sample profiles are captured, with its centre coincides with the image centre. Each image acquired from the camera covers an area of specimen around 512 × 340 mm. The average value 12 lines from the simple profiles are then calculated according to ISO 4288:1996.For each value of surface texture, the best coefficient of linear regression is verified with the profiles. The results of measurement are summarized in Table 1 as the coefficients of determination between the estimated Ra by the PS system against the nominal value from surface roughness standard.
Table 1. Linear Regression between nominal value of surface roughness standard and PS technique results under different slant angles
Slant angle
(θ ) Linear regression model Coefficient of determination
37.5◦ Ra
std = -3040.5RaPS + 438.42 0.94
45◦ Ra
std = -1632.4RaPS + 243.23 0.97
52.5◦ Ra
std = -1116.3RaPS + 114.71 0.99
Where RaPS is roughness standard profiles which are averaged from 12 lines from image measurement system, and Rastd is nominal values which are identified surface roughness standard. Three values of surface roughness standards were utilized for evaluation of the PS system. The best coefficient was found at 52.5◦ of slant angle. This
equation was offered for roughness average estimation form recovered surface. Furthermore, more information on surface characteristics would be presented from three-dimensional (3D) surface textural patterns of the surface roughness standard.
5. Conclusions
The experiment results have shown that the new approach for textural examination using photometric stereo can measure surface roughness of work pieces. However, the results from comparison experiments would be able to increase accuracy by surface roughness standard calibration. In fact, more experimental cases have to be considered and compared with the present method of analysis. In addition, the measurement uncertainty using the PS system should be calculated.
REFERENCES
[1] S. Damodarasamy and S. Raman, Texture analysis with
computer vision. Computer in Industry 16 (1991), pp. 25-34.
[2] M.L. SMITH, The analysis of surface texture using
photometric stereo acquisition and gradient space domain mapping. Image and Vision Computing 17 (1999), pp. 1009-1019.
[3] G. A. Al-Kindi, R. M. Baul, K. F Gill, An application of machine vision in the automated inspection of engineering surfaces. International Journal of Production Research (1992), pp. 241-253.
[4] M.L. Smith, G. Smith, T. Hill, Gradient space analysis of surface defects using a photometric stereo derived bump map. Image and Vision Computing 17 (1999), pp. 321-332. [5] E. North Coleman, JR., R. JAIN, Obtaining 3-dimensional
[image:6.595.56.299.557.622.2](1982), pp. 309-328.
[6] A. Spence and M. Chantler, Optimal illumination for
three-image photometric stereo acquisition of texture, Proceedings of the 3rd International Workshop on Texture Analysis and Synthesis (2003), 89-94.
[7] R.J. Woodham, Determining Surface Curvature with
Photometric Stereo, IEEE International Conference on Robotics and Automation (1989), pp. 36 – 42.
[8] D. Whitehouse, Surface and Their Measurement, Hermes
Penton, London, 2002.
[9] R. Leach, Good Practice Guide No.37 The Measurement of
Surface Texture using Stylus Instruments, National Physical
Laboratory, United Kingdom, 2001
[10] ISO10360-1. Geometrical Product Specification (SPC).
Acceptance and reverification tests for coordinate measuring machines (CMM). Part 1: Vocabulary. International Organization for Standardization; 2000.
[11] ISO 4287:1997 Geometrical Product Specifications (GPS) – Surface texture: Profile method –Terms, definitions and surface texture parameters
[12] ISO 4288:1996 Geometrical Product Specifications (GPS) – Surface texture: Profile method –Rules and procedures for the assessment of surface texture