Journal of Chemical and Pharmaceutical Research, 2014, 6(7):1130-1134
Research Article
CODEN(USA) : JCPRC5
ISSN : 0975-7384
Establishment of multivariate statistical regression model based on
the level of technology and training factors and its application in the
study of basketball reserve talents
Jingfei Chen
1, Shujuan Yuan
1and Aimin Yang
21
Qinggong College, Hebei United University, Tangshan, Hebei, China
2
Science College, Hebei United University, Tang Shan, China
_____________________________________________________________________________________________
ABSTRACT
In this paper, through the investigation and statistical analysis of the 14th "CUBA" qualifier, we discuss the existing problems in CUBA athlete athletics level and the basketball reserve personnel training in our country at present, using the method of multivariate stepwise regression to analyze the relationship between various technical indicators of CUBA team and performance. The indicators are as follows 9 Technologies: 2 point shooting percentage, 3 point shooting percentage, free throw percentage, rebounds, assists, foul, fault, steal, block, as variables. Let the goal average of every game of each team as the dependent variable. Thus establish the optimal regression equation of goal average of 12 CUBA team and 9 technical indicators using stepwise regression method. Use correlation coefficient represents each technical index of contribution to the team member. Then we calculate each teams’ technical indicators and average goal average, obtain the correlation coefficient of technical indicators and goal average through the SAS procedure, sort value and then we can get the sequence of various technical indicators’ contribution to achievement. From large to small order: 2 point shooting percentage, assists, steals, rebounds, free throw percentage, block shot, 3 point shooting percentage, fault, foul. So as to provide technical support for the cultivation of reserve talents in china.
Key words: basketball reserve talent; technology level; regression analysis; CUBA
_____________________________________________________________________________________________
INTRODUCTION
In the past few decades, Chinese basketball training has been on the way along primary school-sports school-professional team. Then, professional team under the planned economic system attract a lot of young people [1-3]. Many parents send their children to the army, the provincial or city professional team as an ideal way out. The material guarantee is the main reason for basketball talents in a certain historical period in relative stability [4-8]. But in the professional team, training children lack of culture, and lack of social communication, but also the lack of a scientific and reasonable training, the life of "a ball, every day, three full, two inverted" is monotonous [9-12]. So a few years later, when they lost their youth, what’s left are only an injured body and uncertain future. So we need a new system to replace it, this is also the reason why CUBA was born [13-15].
University Basketball’s real development can promote the popularization of primary and secondary school basketball, and attract more young people to join the basketball activities, which will form a primary school-middle school-university personnel training system. In this way, the structure of pyramid of Chinese basketball talent can form.
different CUBA team and the athletic level of members to seek better way for the development of basketball reserve personnel in our country.
TECHNICAL INDEX ANALYSIS
Regression analysis
Based on the analysis of technical indicators, it can be seen the main factors affecting the score is mainly determined
by the following 9 technical indicators:
x
1 as 2 point shooting percentage,x
2 as 3 point shooting percentage,3
x
as the free throw percentage,
x
4as rebounds,x
5 as assists,x
6 as for fouls,x
7 as faults,x
8 as steals,9
x
as block shots. Considering each team’s strength differs, we consider each team’s goal average
Z
j as theperformance index.
If the index curve and goal average curve is similar, the more similar the slope change, the bigger the degree of connection is. From the figure, we can see that the correlation of blocked shots, 2 point shooting percentage, free throw percentage and goal average is deep. But this can only see some similar curve, and obtain some indexes correlated with the score rate, but cannot get correlation of index and the result as well as the specific correlation data.
Therefore, we consider each team goal average as the dependent variable, the 9 indexes as variables, using regression method to select the important variables in a number of technical indicators effectively, and establish the
optimal regression equation of goal average
Z
i and technical indexesx
i:Z
i=
f
(
x
i)
, which contains alltechnical indexes that have a significant impact on performance and does not contain technical indicators that have no significant influence on the performance.
Every team played five games. According to the five games data of every team and every game’s goal average, we use SAS program and get each team's regression equation through stepwise regression:
CUBA Team1:
z
=
0
.
66668
+
0
.
03677
x
5;CUBA Team2:
z
=
0
.
25383
−
0
.
71245
x
1+
0
.
07244
x
5+
0
.
10382
x
8;CUBA Team3:
z
=
0
.
25383
−
0
.
71245
x
1+
0
.
07244
x
5+
0
.
10382
x
8;CUBA Team4:
z
=
0
.
3888
+
0
.
57416
x
1+
0
.
01505
x
5+
0
.
00857
x
7;CUBA Team5:
z
=
1
.
39221
+
0
.
11454
x
1+
0
.
75772
x
3+
0
.
00298
x
7CUBA Team6:
z
=
0
.
69296
+
0
.
12114
x
9;CUBA Team7:
z
=
0
.
64396
+
0
.
03795
x
5−
0
.
07209
x
9;CUBA Team8:
z
=
0
.
5735
+
2
.
15444
x
1−
0
.
83891
x
3;CUBA Team9:
z
=
0
.
87614
+
0
.
02029
x
4−
0
.
01282
x
8−
0
.
15433
x
9;CUBA Team10:
z
=
1
.
52566
x
1+
0
.
00730
x
4;CUBA Team11:
z
=
0
.
09003
x
5+
0
.
02481
x
6−
0
.
43080
;CUBA Team12:
z
=
3
.
34512
x
3−
0
.
09664
x
8;From the regression above, we can see clearly that the technical indicators influencing performance are different for different teams.
Correlation coefficient analysis
Table 1 The mean indicator values of each department
Team 2 point shooting percentage3 point shooting percentageFree throw percentage…… Block shotGoal Average
A 0.50 0.35 0.68
……
1.4 0.96372
B 0.53 0.40 0.69 2.2 0.97246
C 0.52 0.39 0.66 2.2 0.95948
D 0.38 0.34 0.57 2.8 0.7685
E 0.54 0.27 0.64 4.4 1.12824
F 0.48 0.35 0.71 0.8 1.00416
G 0.58 0.44 0.71 3.4 1.13356
H 0.51 0.40 0.77 2.6 1.12282
I 0.39 0.27 0.71 1 0.82125
J 0.54 0.40 0.68 2.6 1.20424
K 0.56 0.29 0.71 2.8 1.17358
L 0.55 0.34 0.70 2.7 1.18891
On two groups of random variables
x
i andZ
, random test are conducted for 12 time, the observed values were( )
(
x
ij,
Z
j)
,
i
=
1, 2,
L
9,10
,j
=
1, 2,
L
,11,12
,wherex
i isi
th indicator,Z is the goal average.12 ( ) 1 1 12 j i i j x x = =
∑
, 12 1 1 12 j jZ Z
=
=
∑
Correlation coefficient of random variables
x
iandz
with sample( )
(
x
ij,
Z
j)
, i=1,2,3
L
9
, j=1, 2,L,11,12:
12 ( ) 1
12 12
( ) 2 2
1 1
( )( )
( ) ( )
j
i i j j
i
j
i i j
j j
x x Z Z
R
x x Z Z
= = = − − = − −
∑
∑
∑
While the
R
i can be considered estimate value of correlation coefficient of thei
th indexes and goal average.The correlation coefficient
r
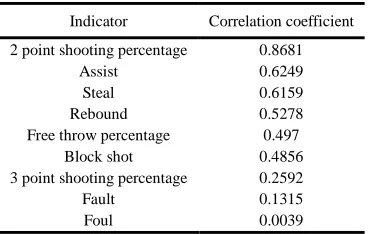
denotes related degree between goal average and 9 technical indicators, and then the contribution of each index on achievement can be calculated.Through correlation analysis of data of 12 teams done by SAS program, we get correlation coefficients
r
of each technique index and goal average; the greater the valuer
is, the more technical indexes contribute on performance, the more the value contribute on the game; on the contrary, the value’s influence on the outcome of the game is small.Table 2 Technical indicators and the gain and loss of each team
Indicator Correlation coefficient 2 point shooting percentage 0.8681
Assist 0.6249 Steal 0.6159 Rebound 0.5278 Free throw percentage 0.497
Block shot 0.4856 3 point shooting percentage 0.2592 Fault 0.1315
Foul 0.0039
[image:3.595.215.400.596.713.2]ANALYSIS OF INFLUENCE FACTORS
[image:4.595.173.438.134.266.2]The development of China's CUBA reserve personnel is influenced by many factors. Through the above analysis, we established the following 12 factors as the research object, see table 3.
Table 3 Factors influencing the development of CUBA reserve talents
Identification Factor Average Score Ranking A Policy guidance 4.18 7 B Scientific management 4 04 10 C The coach's level 4.54 2 D Competition system 4.43 3 E External support 4.07 9 F The scientific selection 4.68 1 G Training system 4.36 4 H Culture conditions 4.32 5 I Individual motivation 4.14 8 J Basketball environment 4.00 11 K Sports Science 4.21 6 L The high-tech talent competition 4.18 12
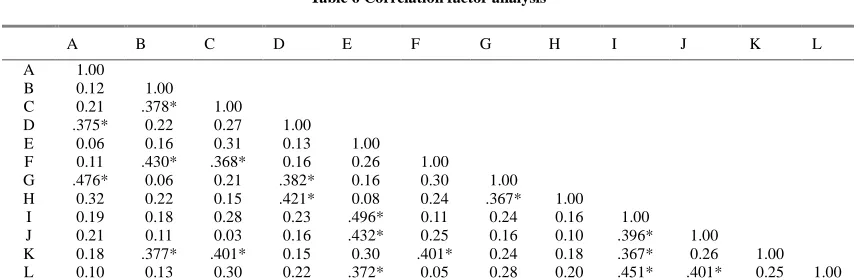
[image:4.595.192.419.358.485.2]Table 4 is the common factor variance table, from table 4 we can see that the common factor variance were more than 0.65. According to the initial characteristics of the 12 variables and the cumulative contribution rate (0.69), it can be statistically analyzed to table 5, get the 12 variable correlation analyzed (Table 6), and we know DAGH, KFBC and JEIL have correlation. As a result, it’s feasible to turn 12 variables into 3 common factors, namely the government behavior factor, technology factor and environment factor.
Table 4 Common factor variance table
Before drawing After drawing
A 1.00 0.83
B 1.00 0.89
C 1.00 0.78
D 1.00 0.79
E 1.00 0.78
F 1.00 0.79
G 1.00 0.79
H 1.00 0.81
I 1.00 0.68
J 1.00 0.82
K 1.00 0.71
L 1.00 0.79
Table 5 Common factor classification and factor loading table
Common factor Indicator Influence factor factor loading Government
Behavior Factor
D Competition system 0.59
A Policy guidance 0.56
G Training system 0.48
H The condition of training 0.45 Technology
Content Factor
K Scientific training 0.61 F The scientific material 0.51 B Scientific management 0.49 C The level of coaches 0.43 Environment
Factor
J Basketball environment 0.56
E Outside support 0.44
I Individual motivation 0.44 L The high-tech talent competition 0.42
CONCLUSION
(1) China's current CUBA players’ level is not high. There are many problems either from the training, management, or match practice. The player think their quality is far behind the international elite level. But as the main Chinese basketball reserve personnel training mode, CUBA’s development is potential.
[image:4.595.101.514.510.634.2]Table 6 Correlation factor analysis
A B C D E F G H I J K L
A 1.00
B 0.12 1.00
C 0.21 .378* 1.00
D .375* 0.22 0.27 1.00
E 0.06 0.16 0.31 0.13 1.00
F 0.11 .430* .368* 0.16 0.26 1.00
G .476* 0.06 0.21 .382* 0.16 0.30 1.00 H 0.32 0.22 0.15 .421* 0.08 0.24 .367* 1.00
I 0.19 0.18 0.28 0.23 .496* 0.11 0.24 0.16 1.00
J 0.21 0.11 0.03 0.16 .432* 0.25 0.16 0.10 .396* 1.00 K 0.18 .377* .401* 0.15 0.30 .401* 0.24 0.18 .367* 0.26 1.00 L 0.10 0.13 0.30 0.22 .372* 0.05 0.28 0.20 .451* .401* 0.25 1.00
(3) In a number of factors, the greatest influence on CUBA was the level of coaches and the training condition, the degree of attention of leadership is also important. Colleges and universities should strengthen the input in these aspect.
(4) The examination system should be reform. Relax the entry conditions to students with basketball talents.
Acknowledgements
This study is support by the humanities and social science project of Education Department of Heilongjiang Province: the 14th "CUBA" qualifier look the status of athletes and the training mode of talents from university basketball in our province. Project number: 12522144.
REFERENCES
[1]Liu Xiao-lan. China Sport Science and Technology. 1984, 29(13), 46-49.
[2]Luo Yang-chun. Journal of Shanghai Physical Education Institute. 1994, 23(12), 46-47. [3]Wan Hua-zhe. journal Of Nanchang Junior College. 2010, 3, 154-156.
[4]Li Ke. Journal of Shenyang Sport University. 2012, 31(2), 111-113.
[5]Zhang Shu-xue. Journal of Nanjing Institute of Physical Education. 1995, 31(2), 25-27. [6]Pan Li. Journal of nanjing institute of physical education(natural science). 2004, 19(1), 54-55. [7]Li Yu-he; Ling Wen-tao. Journal of Guangzhou Physical Education Institute. 1997, 17(3), 27-31. [8] Xu Guo-qin. Journal Of Hebei Institute Of Physical Education. 2008, 22(2), 70-72.
[9] Chen Qing-hong. China Sport Science and Technology. 1990, 21(10), 63-65
[10] Tian Jun-ning. Journal of Nanjing Institute of Physical Education. 2000, 14(4), 149-150.