Journal of Chemical and Pharmaceutical Research, 2014, 6(7):2000-2007
Research Article
CODEN(USA) : JCPRC5
ISSN : 0975-7384
Protein Encoding: A Matlab toolbox of representing or encoding
protein sequences as numerical vectors for bioinformatics
Wen Zhang* and Meng Ke
School of Computer, Wuhan University, Wuhan, China
____________________________________________________________________________________________
ABSTRACT
Recently, machine learning methods are successfully applied to the problems in the bioinformatics, such as the protein function and structure prediction. The popular machine learning methods, for example support vector machine, decision tree and etc., usually require the numerical vectors as inputs. The representation of protein sequences as numerical vectors is well known as ‘encoding’. In this paper, we develop a Matlab toolbox 'Protein Encoding', which help to represent or encode protein sequences as numerical vectors for bioinformatics. This Matlab toolbox provides a user-friendly interface. More importantly, we also provide the Matlab APIs, and the researchers can easily call these APIs for their own programs. This toolbox is available at: http://proteinencoding.sourceforge.net/
Key words: machine learning, protein sequence, features, encoding, Matlab
____________________________________________________________________________________________
INTRODUCTION
Bioinformatics is an interdisciplinary scientific subject that combines the computer science, mathematics, biology and medicine. Jobs in bioinformatics are storing, retrieving, organizing and analyzing biological data, so as to understand the evolutionary and functional aspects of molecular biology.
Proteins are large biological molecules, or macromolecules, which consist of several long chains of amino acid residues. Proteins perform a vast array of functions within living organisms, such as catalyzing metabolic reactions, replicating DNA, responding to stimuli, and transporting molecules from one location to others. Therefore, predicting protein functions and structures is of the most importance in bioinformatics.
Recently, machine learning methods are introduced into the bioinformatics, especially the protein function and structure prediction. The popular machine learning methods, for example support vector machine, neutral network, decision tree and etc., usually require the numerical vectors for model construction. In order to build the machine learning-based models for bioinformatics, the protein sequences should be represented (also well know as ‘encoding’) as the numerical vectors. To our knowledge, there are several groups of sequence-derived structural and physicochemical features, which have been widely used for sequence representation or encoding in bioinformatics.
MATLAB is an integrated numerical computing environment and fourth-generation programming language, which attracts more and more attention from science to engineering. More importantly, MATLAB allows matrix manipulations, plotting of functions and data, implementation of algorithms, creation of user interfaces, and interfacing with programs in other languages (such as C, C++, Java, and Fortran). In this paper, we develop a Matlab toolbox (named ‘ProteinEncoding’) of encoding protein sequences for bioinformatics. This toolbox is available at: http://proteinencoding.sourceforge.net/.
2 Implementation
2.1 features or descriptors for protein sequence encoding
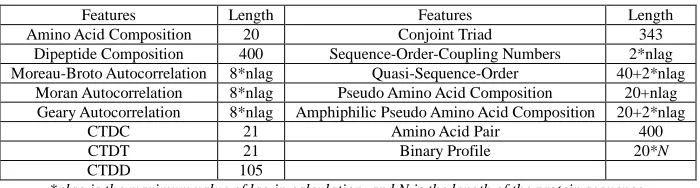
[image:2.595.132.482.226.320.2]To our knowledge, there are several features or descriptors for protein encoding, which are widely used for the bioinformatics problems. These features are shown in Table 1.
Table 1 The structural and physicochemical features of proteins
Features Length Features Length
Amino Acid Composition 20 Conjoint Triad 343
Dipeptide Composition 400 Sequence-Order-Coupling Numbers 2*nlag Moreau-Broto Autocorrelation 8*nlag Quasi-Sequence-Order 40+2*nlag
Moran Autocorrelation 8*nlag Pseudo Amino Acid Composition 20+nlag Geary Autocorrelation 8*nlag Amphiphilic Pseudo Amino Acid Composition 20+2*nlag
CTDC 21 Amino Acid Pair 400
CTDT 21 Binary Profile 20*N
CTDD 105
*nlag is the maximum value of lag in calculation, and N is the length of the protein sequence.
(1) Amino Acid Composition (AAC)
Amino acid composition [4] describes the proportion of each common amino acid type within a protein, and a protein sequence defined as:
20 1 2
(N ,N , ,N )
P
N N N
= L
Where N represents the number of type i amino acid, and N is the length of the sequence. i
(2) Dipeptide Composition (DC)
Dipeptide Composition [4] describes the proportion of each common amino acid pair within a sequence, defined as:
, , 1, 2,..., 20
1 rs r s
N
P r s
N
= =
−
Where N is the sum of dipeptides containing amino type r and type s, and N is the length of the sequence. rs
(3) Autocorrelation (Moreau-Broto, Moran and Geary)
Autocorrelation descriptors are defined based on the distribution of amino acid properties along the sequence, and amino acid properties are amino acids indices taken from AAIndex database. For each type of index, three types of autocorrelation descriptors (Moreau-Broto [5], Moran [6] and Geary [7]) are defined.
(4) Composition, Transition, and Distribution (CTDC, CTDT, CTDD)
The sequence of the amino acids is transformed into sequences of certain structural or physicochemical properties (attributes) of residues. Twenty amino acids are divided into three groups for each of the seven different amino acid attributes representing the main clusters of the amino acid indices of Tomii and Kanehisa.
Three descriptors, composition (CTDC), transition (CTDT), and distribution (CTDD) [8,9] are then computed for a given attribute to describe the global percent composition of each of the three groups in a protein, the percent frequencies with which the attribute changes its index along the entire length of the protein, and the distribution pattern of the attribute along the sequence, respectively.
(5) Conjoint Triad (CTriad)
1 2 343 1 2 343 min{ , ,..., }
max{ , ,..., } i
i
f f f f
P
f f f −
= ,i=1,2,...,343
(6) Sequence-order-coupling Number (SOCN)
The d th-rank sequence-order-coupling number [11] is defined as:
2 , 1
( ) 1, 2,..., nlag
N d
d i i d
i
d d
τ − +
=
=
∑
=Where di i d,+ is the physicochemical distance between the two amino acids at position i and i+d. Besides,
nlag is the maximum lag and is less than the length of sequence. (7) Quasi-sequence-order (QSO)
For each amino acid type, the quasi-sequence-order [11] descriptors of sequence P can be defined as:P=[p p1, 2,L,p20,p21,L,p20+nlag].
20
1 1
20 20
1 1
, 1, 2, , 20
, 21, 22, , 20 r nlag r d i d u r nlag r d i i N i N w p w i nlag N w τ τ τ = = − = = = + = = + +
∑
∑
∑
∑
L Lwhere N is the normalized occurrence for amino acid type i and w is a weighting factor. r
(8) Pseudo-Amino Acid Composition (PAAC)
The sequence order correlated factors is defined as follows:
1 1
( , ), d 1, 2, , nlag L d
d i i d
i
R R N d
θ − +
=
= Θ =
−
∑
LWhere θd is the first-tier correlation factor that reflects the sequence order correlation between all of the nlag-most
contiguous resides along a protein chain, and N is the length of the sequence. Θ(R Ri, j) is given by
2 1 1 2 2 2 2 [ ( ) ( )] 1 ( , ) [ ( ) ( )] 3 [ ( ) ( )] j i
i j j i
j i
H R H R
R R H R H R
M R M R
− +
Θ = − +
−
Where H R1( j), H R2( j) and M R( j) are the hydrophobicity, hydrophilicity, and side-chain mass of amino acid
i , respectively.
Pseudo-Amino Acid Composition [12] can be formulated as P=[p p1, 2,L,p20,p21,L,p20+nlag]
20
1 1
20 20
1 1
, 1, 2, , 20
, 21, 22, , 20 u nlag r j r d u u r nlag r d r d f u f w p w
X u nlag
f w θ θ θ = = − = = = + = = = + +
∑
∑
∑
∑
L L(9) Amphiphilic Pseudo-Amino Acid Composition (APAAC)
The definition is similar to PAAC. Based on previous calculation, we have H1(i) and H2(j). Then the hydrophobicity and hydrophilicity correlation functions are defined as:
1
, 1 1
2
, 2 2
( ) ( )
( ) ( ) i j
i j
H H i H j
H H i H j =
=
From the qualities above, sequence order factors are defined as:
1
2 1 ,
1 2 2 , 1 1 1 1, 2,3, N i i i N i i i H N H N nlag λ λ λ λ λ λ τ λ τ λ λ − − + = − + = = − = − =
∑
∑
LAPAAC [13] is calculated as:
20 2 1 1 20 2 1 1 (1 20)
(21 20 2 )
c c nlag r j r j u c nlag r j r j f P c f
P c nlag
f ω τ ωτ ω τ = = = =
= < <
+
= < < +
+
∑
∑
∑
∑
(10) Amino Acid Pair (AAP)
Amino Acid Pair [14] is developed by Chen et al, which describes the occurrence of dipeptides in the proteins with specified functions against other proteins. For example, the peptide AEACCGCA can be decomposed into 7 AAPs: AE, EA, AC, CC, CG, GC, and CA. There are 20*20=400 AAPs. A AAP component is defined as:
log( AAP) AAP f R f + − =
Where fAAP+ and fAAP− are the occurrence frequency of a given AAP in the proteins with specified functions and
other proteins. Then the AAP scale is centralized and normalized by:
min max min
2( ) 1
AAP R R R R R − = − −
Where Rmin,Rmaxare the min and max values of R. In addition, the occurrence of dipeptides in sequence multiplies with matrix
R
AAP, and produces a 400-dimensional vector as the result.(11) Binary profile
Binary profile [15] is a widely used representation of amino acids. Each amino acid type (20 common types in all) can be represented by a 20-bit binary string, in which the value at one bit is 1 and others are 0.). Thus, a sequence of
N amino acids is transformed to a vector of 20*N dimensions.
2.2 Graphics and GUI
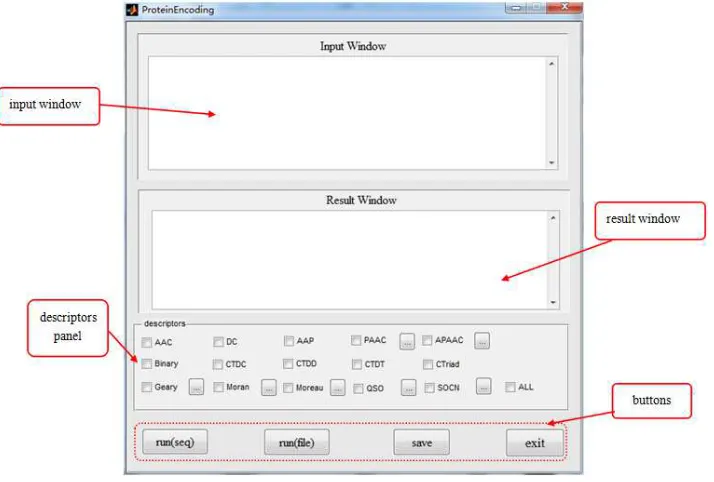
As shown in Figure 1, the interface consists of 4 components: input window, result window, descriptors panel and buttons
The input window is for users to enter protein sequences, and sequences should follow fasta format. The output window shows encoded numerical vectors.
There are 4 buttons: run(seq), run(file), save, exit. The first button and second button are used to start the procedure of protein encoding. The third one helps the user to keep the result. The last button can close the interface.
Figure 1 The interface of the Matlab toolbox ProteinEncoding
2.3 Input, output formats and examples
There are 3 subfolders in this toolbox: ‘data’, ’result’, and ‘API’. Subfolder ‘data’ contains all the data files. Besides, result files will be stored in subfolder ‘result’. Subfolder ‘API’ provides APIs for features or descriptors listed in the section 2.1.
In bioinformatics, fasta is a common format for the records of amino acid sequences. Each record is composed of a heading line with ‘>’ as the start element and following lines of sequence. The input sequences or files should follow this format. Moreover, multiple sequences in fasta format are supported by this toolbox as well. A sequence is given as follows.
>sp|P22303|ACES_HUMAN Acetylcholinesterase OS=Homo sapiens GN=ACHE PE=1 SV=1 MRPPQCLLHTPSLASPLLLLLLWLLGGGVGAEGREDAELLVTVRGGRLRGIRLKTPGGPV SAFLGIPFAEPPMGPRRFLPPEPKQPWSGVVDATTFQSVCYQYVDTLYPGFEGTEMWNPN RELSEDCLYLNVWTPYPRPTSPTPVLVWIYGGGFYSGASSLDVYDGRFLVQAERTVLVSM NYRVGAFGFLALPGSREAPGNVGLLDQRLALQWVQENVAAFGGDPTSVTLFGESAGAASV GMHLLSPPSRGLFHRAVLQSGAPNGPWATVGMGEARRRATQLAHLVGCPPGGTGGNDTEL VACLRTRPAQVLVNHEWHVLPQESVFRFSFVPVVDGDFLSDTPEALINAGDFHGLQVLVG VVKDEGSYFLVYGAPGFSKDNESLISRAEFLAGVRVGVPQVSDLAAEAVVLHYTDWLHPE DPARLREALSDVVGDHNVVCPVAQLAGRLAAQGARVYAYVFEHRASTLSWPLWMGVPHGY
EIEFIFGIPLDPSRNYTAEEKIFAQRLMRYWANFARTGDPNEPRDPKAPQWPPYTAGAQQ YVSLDLRPLEVRRGLRAQACAFWNRFLPKLLSATDTLDEAERQWKAEFHRWSSYMVHWKN
[image:5.595.130.487.110.351.2]QFDHYSKQDRCSDL
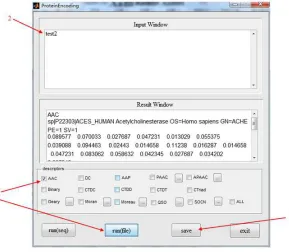
Figure 2 shows an example that directly uses protein sequences for encoding. (1) Type ‘ProteinEncoding’ in the command window, and then the interface opens; (2) Enter the sequence, select descriptor ’AAC’ and click button run(seq); (3) Click the button save, and the
Figure 2 an example for the input by protein sequences
In addition to directly using the protein sequences as input, we can store the sequences in the fasta files, and then input the sequences from the files. For the example shown by Figure 3, the sequences are saved in the fasta file ‘test2’. (1) Type “ ProteinEncoding” into the command window and copy ‘test2’ into subfolder ‘data’; (2) Enter the name of the fasta file in the input window; (3) Select descriptor ‘AAC’, click button run(file); (4) Save the result, and the result file is stored in subfolder ‘result’.
Figure 3 an example for the input by fasta file
3 case study
3.1 Background
[image:6.595.173.462.418.670.2]Raghava [16] compiled a dataset containing 1042 unique B-cell epitopes and 1795 non B-cell epitopes. This dataset contains sequences with variable lengths. In this case, we adopted features to encode sequences as numerical vectors. Then, we built the random forest-based models based on these numerical vectors.
3.2 Results
We respectively transformed the proteins epitopes into the numerical vectors by different features or descriptors, and then built the individual feature-based prediction models. Each model was evaluated by the five-fold cross validations. Table 4 displays the performances of individual feature-based models (five best features are shown for this case study).
Table 4 Performances of individual feature-based models
Feature Sensitivity specificity Matthews correlation coefficient Accuracy Area under Roc curve
AAC 0.7866 0.8032 0.6190 0.7984 0.7608
APP 0.8019 0.8103 0.6334 0.8079 0.7713
DC 0.7868 0.8463 0.7226 0.8262 0.8045
QSO 0.7485 0.7842 0.5797 0.7741 0.7333
APAAC 0.7538 0.7967 0.6113 0.7839 0.7477
Therefore, by using the toolbox, we can easily transform the protein sequences into the numerical vectors, use them to build the machine learning-based models and then predict the protein functions or structures.
CONCLUSION
In this paper, we develop a Matlab toolbox 'ProteinEncoding', which helps to represent or encode protein sequences as numerical vectors for bioinformatics. This Matlab toolbox provides a user-friendly interface, and users without the computer science background can easily adopt it for their study. More importantly, the Matlab APIs for the different features or descriptors are provided, and the researchers can easily call these APIs for their own programs.
Acknowledgment
This work is supported by the National Science Foundation of China (61103126) and Natural Science Foundation of Hubei Province (No. 2011CDB454).
REFERENCES
[1] Z.R. Li, H.H. Lin, L.Y. Han, L. Jiang, X. Chen, and Y.Z. Chen. PROFEAT: A Web Server for Computing Structural and Physicochemical Features of Proteins and Peptides from Amino Acid Sequence. Nucleic Acids Res. Jul 1, 2006; 34(Web Server issue):W32-7.
[2] H.B. Rao, F. Zhu, G.B. Yang, Z.R. Li, and Y.Z. Chen. Update of PROFEAT: a web server for computing structural and physicochemical features of proteins and peptides from amino acid sequence. Nucleic Acids Res. Jul 1, 2011; 39(Web Server issue):W385-90.
[3] Xiao N, Cao D, Xu Q, Liang Y (2012). protr: Protein Sequence Feature Extraction with R. R package version 0.1-0, URL http://CRAN.R-project.org/package=protr.
[4] Bhasin M, and Raghava G.P.S. (2004) ‘Classification of Nuclear Receptors Based on Amino Acid Composition and Dipeptide Composition’, J. Bio. Chem., Vol. 279, p.23262.
[5] Moreau, G. and Broto, P. (1980) ‘Autocorrelation of molecular structures, application to SAR studies’, Nour J.
Chim., Vol. 4, pp.757–767.
[6] Moran, P.A.P. (1950) ‘Notes on continuous stochastic phenomena’, Biometrika, Vol. 37, pp.17–23. [7] Geary, R.C. (1954) ‘The contiguity ratio and statistical mapping’, Incorp. Statist., Vol. 5, pp.115–145.
[8] Dubchak, I., Muchink, I., Holbrook, R.S. and Kim, S.H. (1995) ‘Prediction of protein folding class using global description of amino acid sequence’, Proc. Natl. Acad. Sci. USA, Vol. 92, pp.8700–8704.
[9] Dubchak, I., Muchink, I., Mayor, C., Dralyuk, I. and Kim, S.H. (1999) ‘Recognition of a protein fold in the context of the SCOP classification’, Proteins: Structure, Function and Genetics,Vol. 35, pp.401–407.
[10]Shen J, Zhang J, Luo X, Zhu W, Yu K, Chen K, Li Y, Jiang H (2007). 'Predicting Protein-protein Interactions Based Only on Sequences Information.' Proceedings of the National Academy of Sciences, 104, 4337-4341.
[11]Chou KC (2000).'Prediction of Protein Subcellar Locations by Incorporating Quasi-Sequence-Order Effect.'
Biochemical and Biophysical Research Communications, 278, 477-483.
[12]Chou KC ,and Cai YD. (2004) ‘Prediction of protein sub-cellular locations by GO-FunD-PseAA predictor’,
Biochemical and Biophysical Research Communications, Vol. 320, pp.1236–1239.
[13]Chou KC (2001). 'Prediction of Protein Cellular Attributes Using Pseudo-Amino Acid Com-position.'
[14]Chen J, Liu H, Yang J, Chou K. (2007) ‘Prediction of linear B-cell epitopes using amino acid pair antigenicity scale’. Amino Acids, Vol.33, No.3, pp. 423–428.
[15]Ansari HR, Raghava GP (2010) ‘Identification of conformational B-cell Epitopes in an antigen from its primary sequence.’ Immunome Res 6:6.