International Journal of Emerging Technology and Advanced Engineering
Website: www.ijetae.com (ISSN 2250-2459, Volume 2, Issue 1, January 2012)189
A Novel Feature Extraction Techniques for
Multimodal Score Fusion Using Density Based
Gaussian Mixture Model Approach
Mr.J.Aravinth
1, Dr.S.Valarmathy
21Assistant Professor, Amrita School of Engineering, Coimbatore, Tamil Nadu, India 2Professor, Bannari Amman Institute of Technology, Sathyamangalam, Tamil Nadu, India
1
2
Abstract—An Unimodal biometric systems, which relies only on a single trait of a person for identification is often not able to meet the desired performance. Combining multiple biometrics may enhance the performance of personal authentication system in accuracy and reliability which is adopted in multimodal biometrics. This paper describes the feature extraction techniques for three modalities viz. fingerprint, iris and face. The extracted information is stored as a template which can be fused using density based score level fusion (using GMM followed by likelihood ratio test).
Keywords— Biometrics, Feature, Fusion, GMM, likelihood,
multimodal, Score, Template, Unimodal.
I. INTRODUCTION
Biometrics is the term used to describe the use of biological, physical or behavioural characteristics used to identify a person. Establishing the identity of a person is a task of increasing importance in various areas in the modern society, as entrance control in buildings and restricted areas, authentication in day-to-day affairs like dealing with the post office, and detection of a suspect in a particular crime in the field of criminal investigation. Biometrics, which measures a physiological or behavioural characteristic of a person, such as voice, face, fingerprints, iris, etc., provides an effective way to solve the problems that the traditional methods such as password and IC cards have faced. Biometric systems that rely on the evidence of a single source of information for authentication (e.g., single fingerprint or face) are often affected by a variety of practical problems such as noisy data (due to a dirty sensor or an environment poorly illuminated), large intra-class variations (i.e. several facial poses), non-universality, spoof attacks, and unacceptable error rates. Multiple biometrics can help to solve several practical problems: thus improving the recognition performance, increasing population coverage (i.e. to those not having a legible fingerprint) and providing anti-spoofing measures by making it difficult for an intruder to spoof multiple biometric traits simultaneously.
In a multimodal biometric system that uses different biometric traits, fusion can be done at four different levels of information, and these levels correspond to four important components of a biometric system. Those four important modules are: (1) Sensor module, (2) Feature extraction module, (3) Matching module, and (4) Decision-making module. The fusion thus can take place at the sensor level, feature extraction level, matching score level, or decision level. In this paper we examine the strategies that can be used in extracting features from fingerprint, iris and face biometric which are to be integrated at the match score level.
II. RELATED WORK
In a multimodal biometric system, fusion can be performed at the sensor level, feature extraction level, matching score level and decision level. Sensor level fusion is quite rare because fusion at this level requires that the data obtained from the different biometric sensors must be compatible, which is seldom the case with biometric sensors. Fusion at the feature level is also not always possible because the feature sets used by different biometric modalities may either be inaccessible or incompatible. Fusion at the decision level is too rigid since only a limited amount of information is available. Therefore, fusion at the score level is preferred as it offers the best trade-off in terms of the information content and the ease in accessing and combining matching score.
Score fusion techniques can be divided into four categories: combination approach fusion, transformation based score fusion, density based score fusion and classifier based score fusion.
International Journal of Emerging Technology and Advanced Engineering
Website: www.ijetae.com (ISSN 2250-2459, Volume 2, Issue 1, January 2012)190
B. Transformation-based score fusion: Accurate estimation of the class conditional densities is possible only when the number of match scores available for training the fusion module is large. When the number of training match scores is limited, the match scores obtained from the different matchers are transformed into a common domain in order to make them compatible. This transformation is known as score normalization and the resulting fusion approach is known as transformation base score fusion. In the transformed domain, the sum, max and min classifier combination rules can be directly applied [1]. The sum of scores fusion method with simple score normalization represents a commonly used transformation based core fusion.
C. Classifier-based score fusion: Scores from multiple matchers are treated as a feature vector and a classifier is constructed to discriminate genuine and impostor scores [2], [3], [4]. When biometric score fusion is considered as a classification problem, the following issues pose challenges: 1) Unbalanced training set: The number of genuine match scores available for training is O(n), but the number of impostor scores is O(n2), where n is the number of users in the database. 2) Cost of misclassification: Depending on the biometric application, the cost of accepting an impostor may be very different from the cost of rejecting a genuine user. For example, a biometric system in security applications typically requires the false accept rate (FAR) to be less than 0.1 percent. Therefore, the fusion classifier needs to minimize the false reject rate (FRR) at the specified FAR values rather than minimizing the total error rate (sum of FAR and FRR). 3) Choice of classifier: Given a variety of admissible classifiers, selecting and training a classifier that gives the optimal performance (minimum FRR at a specified FAR) on a given data set is not trivial [5].
D. Density-based score fusion: This approach is based on the likelihood ratio test and it requires explicit estimation of genuine and impostor match score densities. Density estimation can be done either by parametric or non-parametric methods. In non-parametric density estimation techniques, the form of the density function is assumed to be known and only the parameters of this density function are estimated from the training data. On the other hand, non-parametric techniques do not assume any standard form for the density function and are essentially data driven. After estimating the densities, the probabilities are computed and then decision rules are applied to make a decision. Density based approach has the advantage that it directly achieves optimal performance at any desired operating point (False Acceptance Rate), provided the score densities are estimated accurately [5].
III. SYSTEM DESIGN
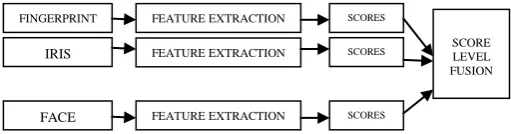
[image:2.595.324.580.234.301.2]In figure 1, the first block (fingerprint, iris, face) represents the respective image databases. The second block represents the feature extraction module. The third block represents the scores obtained from the respective test images. Finally, these scores obtained are fused in the fourth block where the Accept /Reject decision is made.
Fig. 1 Block diagram of the multimodal biometric system
For fusion to happen we have to obtain the scores of the test image. For that we have to extract the features of the test image and the extracted feature has to be compared with the features of each one of the images present in the database. Hence what we do is we extract the features of every image present in the database and store it as a template prior to verification so that it can be easily compared.
Features of each biometric trait can be obtained using various techniques. We propose the techniques which are widely used and very easy to implement.
A. Fingerprint:
The features that we concentrate upon are the
terminations and bifurcations which together are otherwise called as minutiae. Following are the steps involved in minutiae extraction from a fingerprint image.
i). Histogram Equalization
In order to enhance the contrast of the fingerprint image
histogram equalization is adopted. Histogram
equalization defines a mapping of gray levels p into gray levels q such that the distribution of gray level q is uniform. This mapping stretches contrast (expands the range of gray levels) for gray levels near the histogram maxima. Since contrast is expanded for most of the image pixels, the transformation improves the detectability of many image features. The probability density function of a pixel intensity level rk is given by
n
n
r
P
kk r
(
)
Where: 0 rk 1, k = 0, 1, 2….. 255, nk is the number of
pixels at intensity level rk and n is the total number of
pixels. The histogram is derived by plotting pr (rk) versus
International Journal of Emerging Technology and Advanced Engineering
Website: www.ijetae.com (ISSN 2250-2459, Volume 2, Issue 1, January 2012)191
)
(
0 0 j k j r k j jk
P
r
n
n
S
ii). Binarization
Fingerprint Image Binarization is to transform the 8-bit gray fingerprint image to a 1-bit image with 0-value for ridges and 1-value for valleys. After the operation, ridges in the fingerprint are highlighted with black colour while valleys are white.
The two types of binarization are 1. Global Binarization 2. Local Binarization
A locally adaptive binarization method is performed to binarize the fingerprint image. Each pixel is assigned a new value (1 or 0) according to the intensity mean in a local neighbourhood (8x8 pixels), as follow
1
( 1) 1( 1) 1(
,
)
A m mA i s B n nB j
j
i
G
AB
mn
mn
- mean of region (m x n)th sub – image of size (AxB)Gs(i,j) – original image
The pixel wise binarized image is given by
1 if Iold(n1,n2)
mnInew(n1,n2) =
0 otherwise
iii). Thinning
The width of a fingerprint pattern carries no useful information for our immediate purpose and is eliminated by a thinning operation. Thinning algorithms reduce connected patterns to a width of a single pixel while maintaining their topology. A good thinning algorithm is also resistant to contour noise and produces a skeleton that falls approximately on the medial axis of the pattern. While numerous algorithms exist, many trade reliability of speed and result in the deletion or disconnection of some patterns. Many thinning algorithms like Hilditch‟s Algorithm, Stentiford Algorithm, Zhang-Suen algorithm and modified Zhang- Suen Algorithm was tried with input images. Out of which modified Zhang-Suen Algorithm gave better results.
iv). Minutiae Extraction:
In order to find the location of the terminations and bifurcations, we move a 3x3 window over the fingerprint image.
If the central pixel value is 1 and has only one 1-value neighbour, then the central pixel is a termination. If the central pixel value is 1 and it has three 1-value neighbours, then the central pixel is a bifurcation. If the central pixel value is 1 and it has two 1-value neighbours, then the central pixel is just a usual pixel (neither a termination nor a bifurcation).
iv). Removal of Spurious Minutiae:
We actually do not need all the minutiae that we have extracted. So we remove the minutiae that are very close to each other. These are called spurious minutiae and in order to remove them we fix a distance D (say 6). If the distance between a termination and a bifurcation is smaller than D, we remove this minutiae. If the distance between two bifurcations is smaller than D, we remove this minutiae. If the distance between two terminations is smaller than D, we remove this minutiae.
v). Region Of interest (ROI):
Minutiae present at the edges of the images are not actually real minutiae. This is because the fingerprint image obtained is constrained on all the four sides which abruptly cut the ridges, thus appearing to a termination. So we determine a ROI, by closing and eroding the image obtained from the previous step, and consider only those minutiae which are present in ROI. Once this is done, the feature of the fingerprint is successfully extracted and the position of minutiae is saved as a template. In figure 2, the red dots present in the minutiae extracted image represents the terminations and the green dots represents the bifurcations.
Fig. 2 Original Image (left). Minutiae extracted image (right)
B. Iris:
International Journal of Emerging Technology and Advanced Engineering
Website: www.ijetae.com (ISSN 2250-2459, Volume 2, Issue 1, January 2012)192
These visible patterns are unique to all persons and the chance to find two individuals with identical iris patterns is about zero. For our developed approach of iris recognition, the input is an eye image, and the output is the iris template (a mathematical representation of the iris region) [7].
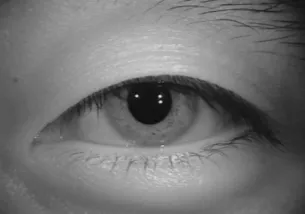
[image:4.595.83.236.238.345.2]The algorithm consists in 3 steps: segmentation, Normalization and Feature encoding.
Fig. 3 Sample iris image
i). Segmentation:
[image:4.595.333.529.408.549.2]It consists in separating the iris region in two circles: the iris/sclera boundary and the iris/pupil one. This step is decisive to the success of an iris recognition system, since wrong iris pattern will alter the generated biometric templates, and cause poor recognition rates [8]. For this, we require good quality of the used images. The segmentation step consists in applying Canny edge detection to generate an edge map, then using circular Hough transform to detect the iris and pupil boundaries and deduce their radius and centre coordinates [9]. To increase the efficiency of the circle detection process, we apply the Hough transform for the iris/sclera boundary first, then for the iris/pupil within the iris region, instead of the whole eye region. As a result, six parameters are stored: the radius, and (x, y) centre coordinates for both circles.
Fig.4 Segmented iris image
After that, we need to detect and eliminate the eyelash and eyelid using ID Gabor filters [10].
Fig.5 Noise elimination (eyelid and eyelash)
ii). Normalization:
Once the iris region is successfully segmented, we transform it to have fixed dimensions in order to tolerate upcoming comparisons. The dimensional variations between different eye images are generally due to the iris stretching caused by pupil dilation from varying levels of illumination. The remapping of the iris region from (x,y) Cartesian coordinates to the normalized non-concentric polar representation is modelled using the following formula [9].
I(x, y) is the pixel intensity.
O is the centre of the iris/pupil boundary and the cartesian landmark reference.
O' is the centre of the iris/sclera boundary.
A and B are respectively a point from the iris/pupil boundary and another from the iris/sclera boundary and they have between them an angle 0 with the horizontal axe of the cartesian mark.
iii). Feature Encoding:
[image:4.595.73.235.593.700.2]International Journal of Emerging Technology and Advanced Engineering
Website: www.ijetae.com (ISSN 2250-2459, Volume 2, Issue 1, January 2012)193
These measures should be distinguishable to highlight confidence in judging whether two templates are from the same iris or from two different irises. For this, we have chosen to encode iris pattern data by Log-Gabor filters using the following equation:
where f
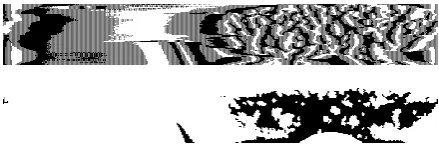
[image:5.595.43.263.299.374.2]0 represents the centre frequency, and σ gives the bandwidth of the filter[5]. This iris template and its mask are obtained for all the iris images in the database and is stored with which we can obtain the scores of the test image during the verification process.
Fig. 6 Iris Template (top). Mask of the iris template (bottom).
C. Face:
Principal Component Analysis (PCA) is a powerful technique foe extracting a structure from potentially high dimensional data sets like an entire database containing images. This eigenvector analysis is widely used in face processing.
Consider the number of images (each of size P*Q) present in the database as „n‟, with each of size (PQ).
First of all what we do is we reshape all the 2-D images into a 1-D image (column) vector and construct a matrix X which contains all the reshaped images as its column. Then calculate the mean matrix of size PQx1.
Now obtain the centred matrix A by subtracting the mean matrix form X.
A=
-Find the covariance matrix C.
C= AT*A
We know from linear algebra theory that for a n*PQ matrix, the maximum number of non-zero eigenvalues that the matrix can have is min(n-1,PQ-1). Since the number of training images „n‟ is usually less than the number of pixels (P*Q), the most non-zero eigenvalues that can be found are equal to n-1.
So we can calculate eigenvalues of AT*A (n*n matrix) instead of A*AT (PQ*PQ matrix). It is clear that the dimensions of A*AT is much larger that AT*A. So the dimensionality will decrease. Now find the eigenvalues (λ) and eigenvectors (V) of the C matrix. We see that λ is a diagonal matrix with each of its non-zero elements λi
having a corresponding vector Vi in V.
In order to obtain the eigen face, we multiply the centred matrix A with the eigen vector matrix V.
E
f=A*V
The eigenface(Ef) contains all the information about all
face images present in the database. Hence it can be stored as a template for the verification process.
D. Matching and Fusion at Score Level
As described earlier, for the score level fusion process, the required scores are obtained by comparing the extracted features of the test image with the templates. The comparison is usually obtaining either the Hamming distance or the Euclidean distance. The score vector is formed with the scores obtained from each of the databases.
We then fuse the scores using Density based Score Fusion. We can actually get better results if we use GMM and likelihood ratio test [4].
IV.LIKELIHOOD RATIO TEST
Combining match scores is a challenging task because the scores of different matchers don‟t have the same nature and scale. Score fusion techniques can be divided into three [5] as transformation-based score fusion, classifier-based score fusion and density based score fusion, out of which the last category is based on the likelihood ratio test and it requires explicit estimation of genuine and impostor match score densities. Density based approach followed by a classifier based on the Neyman-Pearson theorem has advantages over the other techniques. Authors in [5] say that the other fusion schemes such as the Sum rule and SVM performs comparable to LR fusion, the former techniques require a careful selection of parameters such as score normalization and fusion weights in sum rule, type of kernel and kernel parameters in SVM, on a case-by-case basis. The likelihood ratio based fusion rule with GMM-based density estimation achieves consistently low verification error rates.
For K different biometric matchers, the match scores are obtained as X=[X1,X2,…….Xk] where k=1,2,3,…K [5].
International Journal of Emerging Technology and Advanced Engineering
Website: www.ijetae.com (ISSN 2250-2459, Volume 2, Issue 1, January 2012)194
Any vector X can be assigned to genuine or imposter class based on the Test of Hypotheses. The hypotheses are Ho: X corresponds to an imposter, and H1: X corresponds
to a genuine user. Ho has to be tested against H1 using the
statistical test Ψ. This probability test can be done using the Neyman Pearson theorem explained in [11]. According to this Neyman Pearson theorem, the value of FAR (α) is fixed and the threshold value, η can be set to a value such that the Genuine Accept Rate is maximized by the LR test. This decision of the threshold value can be done after several trials on the database images. The Neyman-Pearson theorem states that
1. For testing H0 against H1, there exists a test Ψ
and a constant η such that P(Ψ(x)=1|H0)=α
and
Ψ(x)=1 for f
gen(x)/f
imp(x)> η
Ψ(x)=0 for f
gen(x)/f
imp(x)< η
2. If a test satisfies the above conditions for some η, then that test is the most powerful test for testing H0 against H1 at a level α.
V. GAUSSIAN MIXTURE MODEL
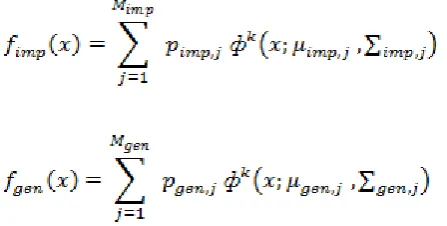
Density estimation is a challenging task because of the discrete score values. GMM can be successfully used to estimate arbitrary densities which make GMM, the best choice for the estimation of genuine and imposter score densities. The fgen(x) and fimp(x) estimations are obtained
by the following equations.
respectively, where
ф
k(x;μ,∑)
is the k-variate Gaussian density with mean value μ and covariance matrix ∑. Here, the number of components and the component parameters are selected using the Expectation Maximization algorithm. [image:6.595.34.258.495.608.2]Expectation Maximization is the extension of the k-means algorithm. An example of the EM process is shown in the figure. The two clusters correspond to the Gaussian distributions g(m1,σ1) and g(m2,σ2)
Fig 2: example of clustering using EM algorithm.
Each dotted circle represents a cluster with a distinct mean and standard deviation. This algorithm assigns a weight to each object based on the probability of membership relative to the mean of the cluster and then groups them under an appropriate cluster.
The EM algorithm can be explained as follows. 1. Make an initial guess of the parameter vector:
This involves randomly selecting k objects to represent the cluster means or centers (as in k -means partitioning), as well as making guesses for the additional parameters.
2. Iteratively refine the parameters (or clusters) based on the following two steps:
(a) Expectation Step: Assign each object xi to cluster Ck with the probability
P(x
iЄc
k) = p(c
k|x
i) = p(c
k)*p(x
i|c
k) / p(x
i)
These probabilities are the “expected” cluster memberships for object xi.(b)Maximization Step: Use the probability estimates from above to re-estimate (or refine) the model parameters. For example,
m
k= (1/n)*∑(x
iP(x
iЄc
k)) / (∑
jP(x
iЄc
j))
This step is the “maximization” of the likelihood of the distributions, given the data.
The EM algorithm is robust to the initialization of the mean vector and covariance matrices. Hence a small value (less than 10-5) is added to the diagonal values of the covariance matrix. This regularization value does not affect the performance of the system. The Likelihood Ratio criterion can now be expressed as,
L(x) = (fgen/fimp) > threshold
This method calculates the ratio and then thresholds it according to FAR (False Acceptance Rate) or FRR (False Rejection Rate). When FAR is fixed, the likelihood ratio criterion minimizes the FRR and vice versa. The performance of the likelihood ratio test depends on the accuracy of the estimation of match score densities. The densities fgen(x) and fimp(x) is obtained using the training
International Journal of Emerging Technology and Advanced Engineering
Website: www.ijetae.com (ISSN 2250-2459, Volume 2, Issue 1, January 2012)195
VI.EXPERIMENTAL RESULTS
We obtained the databases from standard websites viz. www.fbi.com, www.polyu.com, www.sinobiometrics.com. Fingerprint images were collected from FBI databases, while iris with the help of poly databases and the face images where collected from the sino biometrics database. A database consisting of fingerprint, face and iris images of 50 individuals has been constructed. 15 prints are collected from single individual with 5 records per biometric modality. Thus multimodal database consists of 15 x 55 = 825 records, consisting of 275 fingerprints, 275 iris and 275 face records. In our experiments, the developed database is divided into two non-overlapping sets: training and validation sets of images each of 275 for each modality. Feature Extraction for multimodal biometrics system is implemented in Matlab on a 3.0 GB RAM, 2.0 GHz Intel CoreDuo processor PC.
FEATURE EXTRACTION FOR FINGERPRINT
A. Original Image
B.Histogram Equalized Image
C.Noise Image
D.Filtered Image
E.Binarized Image
International Journal of Emerging Technology and Advanced Engineering
Website: www.ijetae.com (ISSN 2250-2459, Volume 2, Issue 1, January 2012)196
F.Thinned Image
G.Minutiae Extraction
H.Removal of Spurious Minutiae
FEATURE EXTRACTION FOR IRIS
A. Original Image
B. Noise Region Image
C. Segmented Image
D.Polar Image
E.Polar Noise Image
International Journal of Emerging Technology and Advanced Engineering
Website: www.ijetae.com (ISSN 2250-2459, Volume 2, Issue 1, January 2012)197
G. Mask Obtained
FEATURE EXTRACTION FOR FACE
A.Original Image
B.Features interms of Templates
The Face features are stored as a template in the system itself .So it cannot be viewed as a good quality image.
The post processing stage involves the matching process to obtain the scores for different input (test) images. The scores thus obtained have to be fused by the proposed fusion technique at the match score level, using Likelihood Ratio test. The density estimation problem, due to the large multibiometric database, is tractable in the LR method. This method can yield a good performance compared to the other fusion methods such as Sum rule or SVM because,No requirement of parameter tuning in LR method, as in the case of other methods, Reduction in the False Rejection Rates and a consistently high recognition rates, Ease of parameter selection in the case of LR method unlike the other methods which require a very careful selection of parameters, LR fusion method incorporates the biometric sample quality information.
VI. CONCLUSION
This paper deals with the widely used feature extraction techniques for fingerprint, iris and face. It also gives ideas about how we can fuse the scores obtained during the verification process using density based score level fusion.
REFERENCES
[1] A. Ross, K. Nandakumar, and A.K. Jain, “Handbook of Multibiometrics,” Springer-Verlag, 2006.
[2] R. Brunelli and D. Falavigna, “Person Identification Using Multiple Cues,”IEEE Trans. Pattern Analysis and Machine Intelligence, vol. 17, no. 10, pp. 955-966, Oct. 1995.
[3] J. Fierrez-Aguilar, J. Ortega-Garcia, J. Gonzalez-Rodriguez, and J. Bigun, “Discriminative Multimodal Biometric Authentication Based on Quality Measures,” Pattern Recognition, vol. 38, no. 5, pp. 777-779, May 2005.
[4] Y. Ma, B. Cukic, and H. Singh, “A Classification Approach to Multibiometric Score Fusion,” Proc. Fifth Int‟l Conf. Audio Video-Based Biometric Person Authentication, pp. 484-493, July 2005.
[5] Karthik Nandakumar, Yi Chen, Sarat C. Dass and Anil K. Jain “Likelihood Ratio-Based Biometric Score Fusion,” IEEE Trans. Pattern Analysis and Machine Intelligence, vol. 30, no. 2, Feb.
2008
[6] Krichen.E., "Identification des personnes par Iris", France Telecom RD, Issy les moulineaux, April 2003.
[7] Libor Masek, "Recognition of Human Iris Patterns for Biometric Identification", Report for the Bachelor of Engineering degree of the School of Computer Science and Software Engineering, Western Australia, 2003.
[8] Xiaomei Liu, B.S., M.S., "Optimizations in Iris Recognition", PhD thesis in Computer Science and Engineering Notre Dame, Indiana, November 2006
[9] Jhon Daugman, PhD, OBE, "How Iris Recognition Works", University of Cambridge, The Computer Laboratory, Cambridge CB2 3QG, U.K., 2004.
[10]Jianwei Yang, Lifeng Liu, Tianzi Jiang, Yongan, "A modified Gabor filter design method for fingerprint image enhancement", National Laboratory of Pattern Recognition, Institute of Automation,Chinese Academy of Sciences, January 2003.
[11] E.L. Lehmann and J.P. Romano, Testing Statistical Hypotheses. Springer, 2005.