Journal of Chemical and Pharmaceutical Research, 2014, 6(2):480-488
Research Article
CODEN(USA) : JCPRC5
ISSN : 0975-7384
Removal of manganese by using activated carbon as biosorbent
Golamari Siva Reddy
and Mallu Maheswara Reddy
Department of Biosciences and Bioengineering, K L University, Guntur, India
_____________________________________________________________________________________________
ABSRACT
This investigation handles the adsorption of manganese from aqueous solution using activated carbon. Effects of different parameters such as agitation time, adsorbent size, adsorbent dosage, initial concentration of manganese in aqueous solution, volume, pH of aqueous solution on removal of manganese are determined. From these investigations, one gram of activated carbon powder of 82.5µm size is found to remove 90% of 20 mg/l manganese from 30ml of aqueous solution in 30min. These results indicate that adsorption of manganese is increased with an increase in adsorbent dosage and decrease in adsorbent size. A significant increase in percentage removal of manganese is observed as pH value increased from 4 to 7.28 and percentage removal is marginally increased from 1 to 4. The percentage removal decreased as pH value increased beyond 7.28. Freundlich and Langmuir isotherm models describe the adsorption data very well indicating favorable adsorption of manganese adsorbent. Freundlich isotherm is relatively more suitable than Langmuir isotherm. Hence based on results obtained it is found that Activated carbon powder is effective in manganese removal and can be appreciably considered as most versatile, economical and feasible adsorbent for removal of manganese from aqueous solutions.
Keywords: Manganese, Activated carbon, Biosorption, Langmuir and Freundlich isotherm.
_____________________________________________________________________________________________
INTRODUCTION
This study presents the optimum values for the following parameters 1. Agitation time
2. Adsorbent size 3. Adsorbent dosage
4. Initial concentration of adsorbate in the aqueous solution 5. Volume of aqueous solution 6. pH of aqueous solution
EXPERIMENTAL SECTION
Preparation of the adsorbent
Activated carbon is carbon produced from carbonaceous source materials like nutshells, peat, wood, lignite and coal and petroleum pitch. It can be produced by one of the following processes:
Physical reactivation: The precursor is developed into activated carbons using gases. This is generally done by using one or a combination of the following processes:
Carbonization: Material with carbon content is pyrolyzed at temperatures in the range 600-900 °C, in absence of air (usually in inert atmosphere with gases like argon or nitrogen)
Activation/Oxidation: Raw material or carbonized material is exposed to oxidizing atmospheres (carbon dioxide, oxygen, or steam) at temperatures above 250 °C, usually in the temperature range of 600-1200 °C.
Chemical activation: Prior to carbonization, the raw material is impregnated with certain chemicals. The chemical is typically an acid, strong base, or a salt (phosphoric acid, potassium hydroxide, sodium hydroxide, zinc chloride, respectively). Then, the raw material is carbonized at lower temperatures (450-900 °C). It is believed that the carbonization / activation step proceeds simultaneously with the chemical activation. This technique can be problematic in some cases, because, for example, zinc trace residues may remain in the end product. However, chemical activation is preferred over physical activation owing to the lower temperatures and shorter time needed for activating material.
Preparation of manganese stock solution:
In order to make Manganese stock solution 1gm of KMnO4 of A.R. grade is taken in to 1000ml of distilled water. The stock solution made is of the concentration of 1gm/lit.
Effect of Agitation Time:
• 12 stoppered flasks are taken into which 50ml of 1gm/lit KMnO4 solution is taken whose PH is maintained at 3 and into that we add 0.5 gms of 150-mesh sized adsorbent.
• Then we keep all the flasks on to a rotary shaker and adsorption is allowed to take place. So, each flask is drawn for 10, 20, 30, 40, 50, 60, 70, 80, 90, 100, 110, 120 minutes respectively
• After adsorption the adsorbent is filtered using a filter paper and then the filtrate is collected separately.
• Samples are collected and then the readings regarding the optical densities of each solution are noted only after calibrating the colorimeter with the blank solution using pure distilled water.
• Using the calibration curve, we can find out the concentration of manganese adsorbed from which we can find out the % removal of manganese.
Effect of Initial Concentration of KMnO4 solution:
• 10 stoppered flasks are taken of different concentrations of KMnO4 solutions. The different concentrations used are 1, 0.8, 0.6, 0.4, 0.2, 0.1, 0.07, 0.05, 0.03, 0.01(gms/lit) respectively.
• 50ml solution of each concentration is taken into the flask and its PH is maintained at 3.To this flask 0.5 gms of the adsorbent (150-mesh size)is added.
• Now all the flasks are kept for shaking for an optimal time period of 110 minutes and then the samples are taken out for filtration using the filter paper.
• The so collected filtrate is then taken into the sample cell and then optical density of each concentration solution is noted. This was done only after calibrating the colorimeter using the blank solution prepared earlier from the pure distilled water.
Effect of Size of Adsorbent:
• Take 5 stoppered flasks into which we add 50ml of 1 gm/lit concentration of KMnO4 solution and its P H
is maintained at 3.To that we add 0.5 gms of adsorbent of varying sizes.
• Normally the different sizes which we consider here are 6, 10, 36, 85, 150 mesh respectively and then we all the stoppered flasks are kept for shaking for an optimal time period of 110 minutes on an orbital shaker.
• After shaking gets completed filtration operation is done from which the so collected filtrate is into the sample cell and the optical densities are noted for each sample.
• Then using the calibration curve plotted earlier, the concentration of KMnO4 solution after adsorption is noted down and the % removal of manganese is thus calculated.
Effect of Dosage of Adsorbent:
• 5 flasks are taken of each with 50ml of 1 gm/lit KMnO4 solution, its PH is maintained at 3.To these flasks we add adsorbent of 150-mesh size of varying amounts of 0.1, 0.2, 0.3, 0.4, 0.5 gms respectively.
• All these flasks are kept for shaking for an optimal time period of 110 minutes and then they are taken out for filtration. After filtration the filtrate is collected and is taken into a sample cell whose optical density is noted from the calibrated colorimeter.
• Then using the calibration curve, we can get the concentration of KMnO4 solution after adsorption from which we will be calculating the % removal of manganese.
Effect of Volume of Solution:
• Firstly take 5 stoppered flasks into which we add 0.5 gms of adsorbent(150-mesh) and then we add varying volumes of stock solution prepared earlier of 1(gms/lit)KMnO4.The stock solution is maintained at a PH of 3.The varying which we use here are 10, 20, 30, 40, 50 ml of KMnO4 stock solution.
• Then the flasks are kept for shaking on a orbital shaker for a time period of 110 minutes. After the shaking gets completed filtration is done from which the so collected filtrate is taken into the sample cell.
• By using the calibrated colorimeter, the optical density of each sample is noted down. And then from the calibration curve, the concentration of KMnO4 solution after adsorption from which we will be calculating the % removal of manganese.
Effect of PH of Solution:
• 5 bottles each of 50ml of 1gm/lit concentration of KMnO4 solution is taken and the PH of each flask is varied. The solutions of different PH which we use are 3, 5, 9, 11, 12 respectively. To these flasks we add 0.5gms of 150-mesh size adsorbent and keep them for shaking for an optimum time period of 110 minutes on a orbital shaker.
• Then the flasks are filtered off. From which the so collected filtrate is taken as sample to the colorimeter and the optical density is noted.
• Using the calibration curve, the concentration of KMnO4 after adsorption is noted from which %removal of manganese ions are calculated.
RESULTS AND DISCUSSION
Effect of agitation time
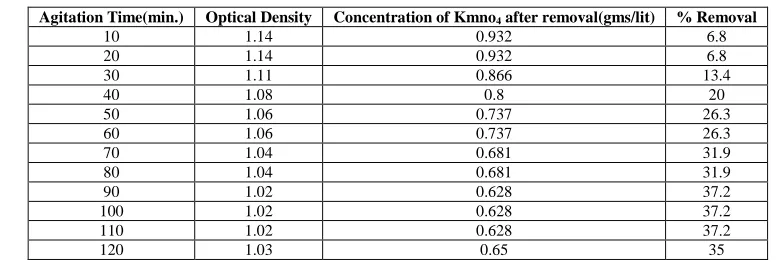
The optimum agitation time is determined by plotting the % removal of mangenese against agitation time in fig.1 for different dosages at the interaction time intervals of 10 minutes to 120 minutes. The % Removal of manganese increases from 10 to 120 minutes. The % adsorption is found to increase up to 90 to 110 minutes and thereafter, negligible increase in % removal is noticed with agitation time. It is noticed that the rate of adsorption is faster in the initial stages because adequate surface area of the adsorbent is available for the adsorption of manganese. As the time increases, more amount of manganese gets adsorbed onto the surface of the adsorbent and surface area decreases. The maximum % adsorption is attained at 90 to 110 minutes of agitation. The % removal of manganese becomes almost constant after 90 to 110 minutes. All other experiments are conducted at this optimum agitation time.
Effect of initial concentration of Kmno4 solution
Table 1: Variation in % Removal of Kmno4 with Time
Agitation Time(min.) Optical Density Concentration of Kmno4 after removal(gms/lit) % Removal
10 1.14 0.932 6.8
20 1.14 0.932 6.8
30 1.11 0.866 13.4
40 1.08 0.8 20
50 1.06 0.737 26.3
60 1.06 0.737 26.3
70 1.04 0.681 31.9
80 1.04 0.681 31.9
90 1.02 0.628 37.2
100 1.02 0.628 37.2
110 1.02 0.628 37.2
120 1.03 0.65 35
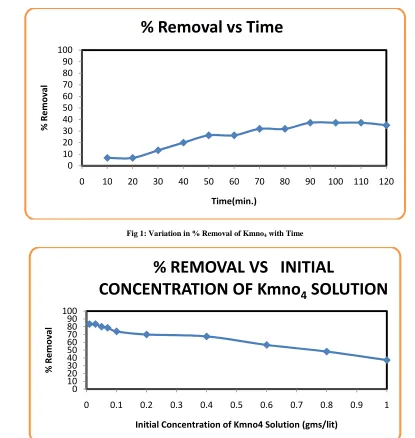
Table 2: Variation in % Removal with Initial Concentration of Kmno4 Solution
Initial Concentration of Kmno4 Solution(gms/lit) Optical Density Concentration of Kmno4 after removal(gms/lit) % Removal
1 1.02 0.628 37.2
0.8 0.92 0.415 48.12
0.6 0.76 0.26 56.66
0.4 0.50 0.13 67.5
0.2 0.28 0.060 70
0.1 0.13 0.026 74
0.07 0.07 0.015 78.57
0.05 0.06 0.01 80
0.03 0.02 0.005 83.33
[image:4.595.91.513.260.703.2]0.01 0.02 0.005 83.33
Table 3: Variation in % Removal with Size of Adsorbent
Mesh Number Optical Density Concentration of Kmno4 Solution after removal (gms/lit) % Removal
6 1.15 0.955 4.5
10 1.10 0.845 15.5
36 1.07 0.77 23
85 1.05 0.707 29.3
150 1.02 0.628 37.2
Table 4: Variation in % Removal with Dosage of Adsorbent
Weight of Adsorbent(gms) Optical Density Concentration of Kmno4 Solution after removal (gms/lit) % Removal
0.1 1.16 0.98 2
0.2 1.11 0.866 13.4
0.3 1.07 0.771 22.9
0.4 1.03 0.655 34.5
0.5 1.01 0.612 38.8
Table 5: Variation in % Removal with volume of Solution
Volume of Solution(ml) Optical Density Concentration of Kmno4 Solution after removal (gms/lit) % Removal
10 0.01 0.005 99.5
20 0.18 0.035 96.5
30 0.87 0.35 65
40 0.96 0.482 51.8
50 1.01 0.612 38.8
Table 6: Variation in % Removal with Initial PH of Solution
Initial PH of Solution Optical Density Concentration of Kmno
4 Solution after removal (gms/lit) % Removal
3 1.02 0.628 37.2
5 1.05 0.707 29.3
9 1.07 0.77 23
11 1.08 0.8 20
Fig 1: Variation in % Removal of Kmno4 with Time
Fig 2: Variation in % Removal of Kmno4 with Initial Concentration of Kmno4 Solution
Effect of size of adsorbent
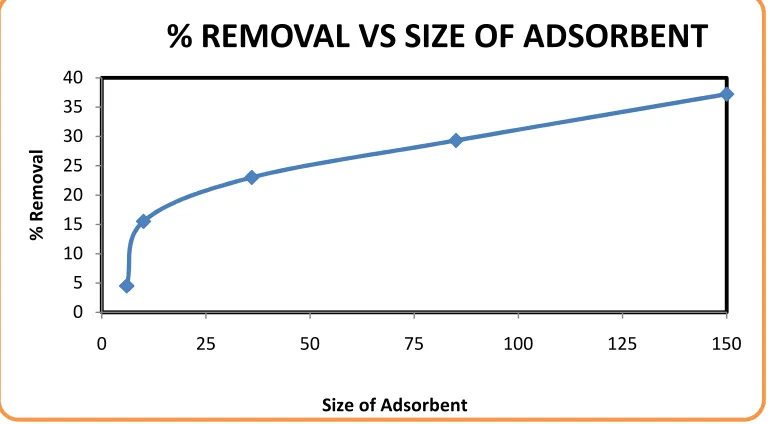
The percentage removal of manganese from aqueous solution with various particle sizes (6 µm, 10 µ m, 36 µ m, 85 µ m and 150 µ m) are obtained at 0.5 gm. The results are shown in fig.3
With an increase in Size of Adsorbent the % Removal increases. If we consider the case of Activated Carbon over here when the mesh size was around 6 µ m the % Removal was 4.5%, where as that when the size reaches to around 150 µm the % removal was 37.2%.The optimum size of adsorbent is 150-mesh sized adsorbent.
Effect of adsorbent dosage
The percentage removal of manganese is drawn against adsorbent dosage different in fig.4 with an increase in dosage of adsorbent the % removal increases. From the graph we can say that at 0.1gms of the adsorbent the % removal is only 2%, where as at a weight of 0.5 gms of the adsorbent the % removal is around 39%. So, by this we can say that the optimum dosage over here was found as 0.5 gms.
Effect of volume of Kmno4 solution
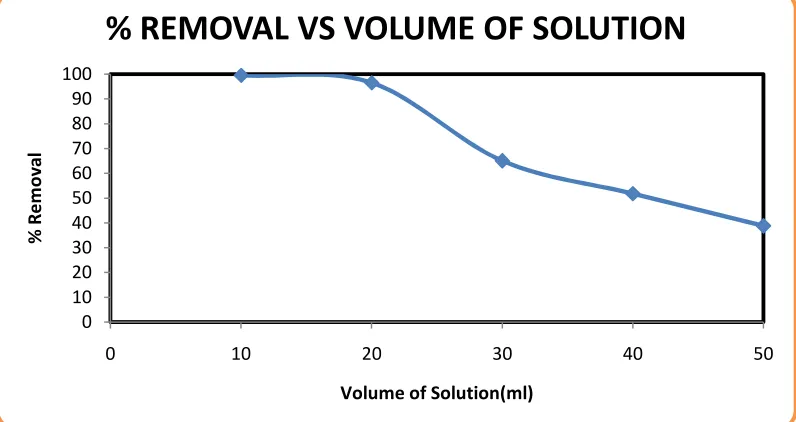
Change in % removal of manganese with variation in the volume of the aqueous solution from 10 ml to 50 ml is shown in fig. 5 with an increase in the volume of solution the rate of adsorption decreases which resembles that the
0 10 20 30 40 50 60 70 80 90 100
0 10 20 30 40 50 60 70 80 90 100 110 120
%
R
e
m
o
v
al
Time(min.)
% Removal vs Time
0 10 20 30 40 50 60 70 80 90 100
0 0.1 0.2 0.3 0.4 0.5 0.6 0.7 0.8 0.9 1
%
R
e
m
o
v
al
Initial Concentration of Kmno4 Solution (gms/lit)
% REMOVAL VS INITIAL
Fig 3: Variation in % Removal of Kmno4 with Size of Adsorbent
Fig 4: Variation in % Removal of Kmno4 with Dosage of Adsorbent
Effect of PH of solution
pH influences the surface charge of the adsorbent, the degree of ionization and the species of adsorbate. So pH is an important factor controlling the process of adsorption. In the present investigation, adsorption data are obtained in the pH range of 3 to 12 for manganese initial concentration of 1 gm/lit and 1 gm of 150 µ m size adsorbent. The effect of pH of the aqueous solution on % removal of manganese is drawn in fig.6. The % removal of manganese dye is increased from 4.5% to 37.2% as pH is increased from 1 to 7.28. The graph reveals that % removal increased significantly from 3 to 12 . With an increase in PH of the solution the % removal decreases. Here for manganese at a PH of 3 the % removal is around 38%, where as with the further increase in the PH of the solution let it be 12 the % removal decreases to 4.5%.In the present investigation, the maximum % removal of manganese is obtained for 1 gm of 150 µm size adsorbent at optimum agitation time. The principal driving force for dye ion adsorption is the electrostatic interaction (i.e) attraction between adsorbent and adsorbate. The greater the interaction, adsorption of dye will be more. With an increase in interaction, the dye ions replace H+ ions bond to the adsorbent for forming part of the surface functional groups such as –OH, -COOH etc. As the electro-negativity of Activated carbon powder is greater, more manganese ions are adsorbed.
Freundlich isotherm for adsorption of manganese
The Freundlich relationship is an empirical equation. It does not indicate a finite uptake capacity of the adsorbent and can thus only be applied in case of low and intermediate concentration ranges. However, it is easier to handle
0 5 10 15 20 25 30 35 40
0 0.1 0.2 0.3 0.4 0.5
%
R
e
m
o
v
al
Weight of Adsorbent(gms)
% REMOVAL VS DOSAGE OF
ADSORBENT
0 5 10 15 20 25 30 35 40
0 25 50 75 100 125 150
%
R
e
m
o
v
al
Size of Adsorbent
[image:6.595.117.502.80.292.2]mathematically in more complex calculations. The Freundlich isotherm is given by qe = Kf Cen [9-14] Taking logarithms on both sides log qe = log Kf + n log Ce where Kf and n are known as Freundlich constants. Freundlich isotherms are drawn between log qe and log Ce in figs.7. The resulting line have the correlation coefficient of 0.86.
[image:7.595.114.499.367.575.2]Fig 5: Variation in % Removal of Kmno4 with Volume of Solution
Fig 6: Variation in % Removal of Kmno4 with PH of Solution
Langmuir isotherm for adsorption of manganese
Since the chemical forces fall off very rapidly with distance, it is probable that chemisorption does not extend beyond a single layer of adsorbate on the surface of the solid. It can be anticipated as first pointed out by Langmuir that chemisorbed adsorbate layers may be only one molecule thick. The Langmuir is most widely used two-parameter equation. The relationship is given by qe / qm = b Ce / (1+bCe)[15-17] where Ce concentration of the adsorbate at equilibrium, qe is the amount adsorbed at equilibrium per unit mass of adsorbent, qm is the maximum amount adsorbed per unit mass of adsorbent and b is the coefficient related to affinity. from above Equation can be rearranged as (Ce/qe) =1/b qm + Ce/qm From fig.8 between (Ce/qe) and Ce, we can calculate the slope (1/qm) and the intercept (1/b qm). Further analysis of Langmuir equation is made on the basis of separation factor, RL.
0 10 20 30 40 50 60 70 80 90 100
0 10 20 30 40 50
%
R
e
m
o
v
al
Volume of Solution(ml)
% REMOVAL VS VOLUME OF SOLUTION
0 5 10 15 20 25 30 35 40
0 2 4 6 8 10 12
%
R
e
m
o
v
al
Initial PH of Solution
Fig 7: Freundlich isotherm
Fig 8: Langmuir isotherm
CONCLUSION
The analyses of the experimental data result in the following conclusions.
1. Among Activated Carbon and Toner, Toner is considered as the best adsorbent than Activated Carbon in removing the manganese from aqueous solutions.
2. With increase in time the % adsorption of manganese increases and reaches an optimum condition above which there is no further increase in the adsorption rate of manganese. The optimum time maintained is 110 minutes. 3. As the initial concentration of manganese increases, % removal of manganese always decreases.
4. The decrease in size of the adsorbent particles results in increased surface area which increases the adsorption rate of manganese. For Activated Carbon(150-mesh), the % removal of manganese is nearly 38% where as that for Toner (150-mesh), the % removal of manganese is nearly 78%.
5. With an increase in the dosage of adsorbent the %adsorption of manganese also increases. 6. As the PH of manganese stock solution increases %adsorption of manganese also increases.
Acknowledgment
We are grateful to the authorities of K. L. University, Guntur, Andhrapradesh, India; Thanks are also due to Prof. T. R. Kubendran of Anna University, Chennai, India, for his cooperation during the experimental work.
y = 0.731x - 1.071 R² = 0.867
-3.5 -3 -2.5 -2 -1.5 -1 -0.5 0
-3 -2.5 -2 -1.5 -1 -0.5 0
Lo
g
Q
e
LogCe
Logqe vs LogCe
y = 5.798x - 53.78 R² = 0.569
0 250 500 750 1000 1250 1500 1750 2000
0 25 50 75 100 125 150 175 200
1
/Q
e
1/Ce
REFERENCES
[1]A. Bennani Karim, B. Mounir, M. Hachkar, M. Bakasse and A.Yaacoubi, Canadian Journal on Environmental,
Construction and Civil Engineering Vol. 2,pp. No.2 2011.
[2]A. Hebeish, M. A. Ramadan, E. Abdel- Halim, A. Abo-Okeil, Clean Techn Environ Policy, 13:713–718, 2011. [3]A. M. Ben Hamissa, M. C. Ncibi, B. Mahjoub and M. Seffen, Int. J. Environ. Sci. Tech., 5 (4), pp. 501-508, 2008.
[4]Ahmet Demirak, Ömer Dalman, Ezel Tilkan, Dilek Yıldız, Evşen Yavuz, Cansu Gökçe, Microchemical Journal 99, pp 97–102, 2011.
[5]Ana Me´ndez, Sandra Barriga, Antonio Saa and Gabriel Gasco, J Therm Anal Calorim 99, pp. 993–998, 2010. [6]Arh-Hwang Chen and Shin-Ming Chen, Journal of Hazardous Materials 172, pp. 1111-1121, 2009.
[7]Russo M.E., Marzocchella A., Olivieri G., Prigione V., Salatino P., Tigini V. and Varese G.C., “Characterization of dyes biosorption on fungal biomass”.9th international conference on chemical and process engineering110-119may2009.
[8]B. D. Bhole, Bratati Ganguly, Anusha Madhuram,Deepti Deshpande and Jui Joshi, Current science, vol. 86, no. 12, 25 june 2004.
[9]B.H. Hameed, R.R. Krishni and S.A. Sata, Journal of Hazardous Materials 162, pp. 305–311, 2009. [10]Baoe Wang and Xiu Guo, World J Microbiol Biotechnol , 27, pp.:1297–1302, 2011.
[11]Bao-E. Wang, Yong-You Hu, Lei Xie and Kang Peng, Bio resource Technology 99, pp. 794–800, 2008. [12]Bellir Karima, Bencheikh Lehocine Mossa And Meniai A-Hassen, International Renewable Energy Congress November 5-7, 2010 – Sousse, Tunisia.
[13]Catherine Faur, H´El`Ene M´Etivier- Pignon And Pierre Le Cloirec, Biochemical Engineering Journal, 2006. [14]M. Sarioglu and U.A. Atay, Global NEST Journal, Vol 8, No 2, pp 113-120, 2006.
[15]S.Abirami, S.Srisudha and P.Gunasekaran, Int J Pharm Bio Sci 2012 July; 3(3): (B) 584 - 595